
S&P started the day by moving towards the downside, increasing the confidence in the main count, but price reversed direction ending the day near its highs.
Summary: The main wave count expects downwards movement to a target at 1,955. This would be confirmed (short term confirmation) with a new low below 1,980.90. The alternate must see upwards movement from here. The target zone for the alternate starts from 2,035.47 and ends at 2,038.35, and this would be confirmed (short term confirmation) with a new high above 2,024.64.
Click on charts to enlarge.
Main Bull Wave Count
I will favor neither the bull or bear wave count. Both are viable and both expect this current upwards impulse may again be close to complete.
To see a weekly chart with subdivisions and how to draw trend lines and channels click here.
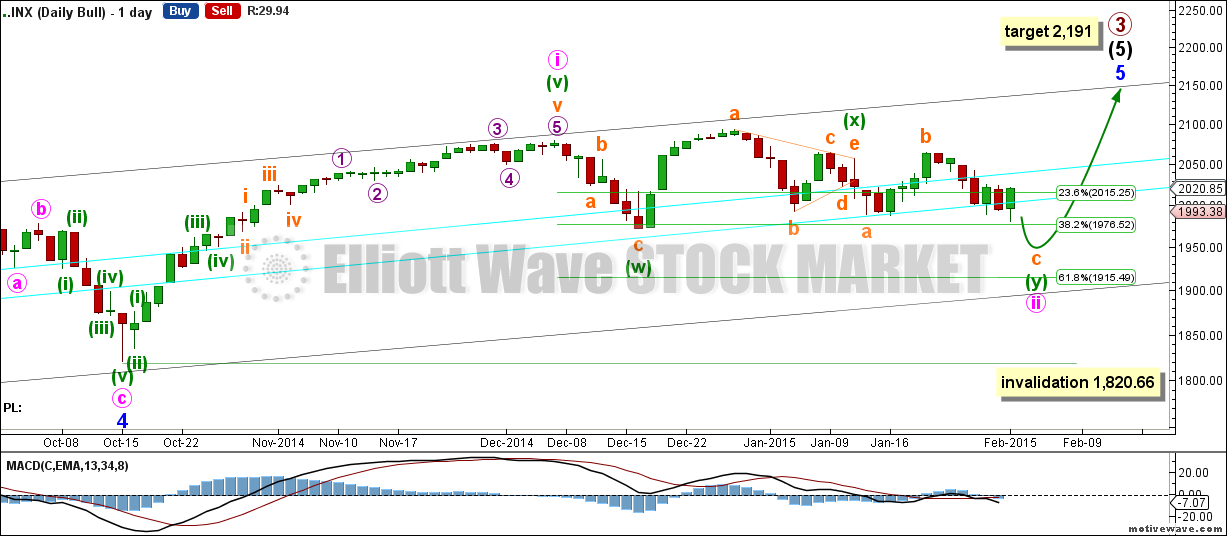
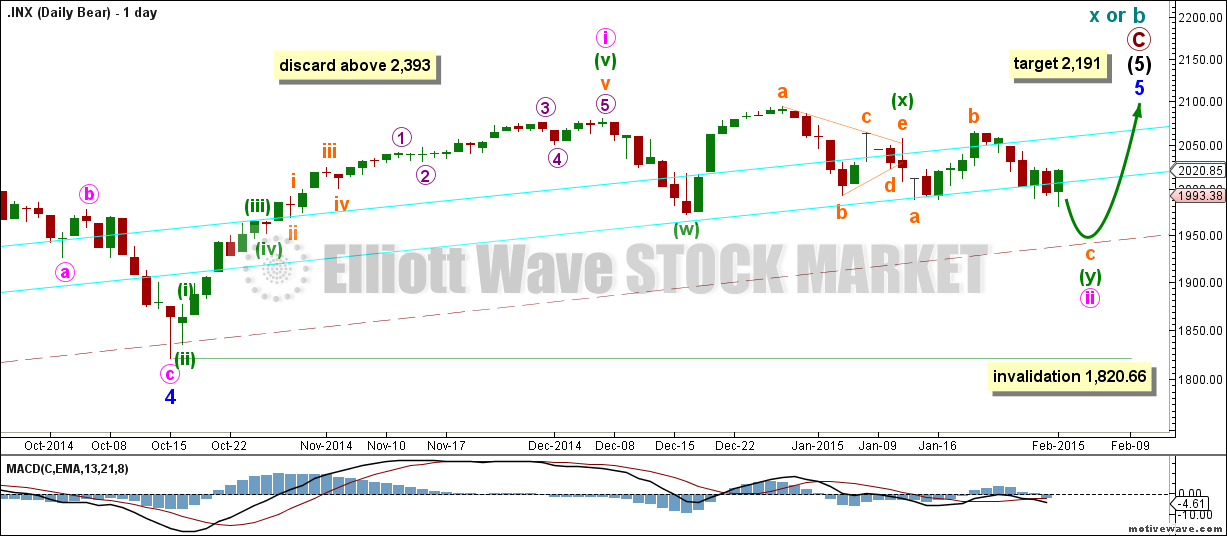
Upwards movement from the low at 666.79 subdivides as an incomplete 5-3-5. For the bull wave count this is seen as primary waves 1-2-3.
The aqua blue trend lines are traditional technical analysis trend lines. These lines are long held (the lower one has its first anchor in November, 2011), repeatedly tested, and shallow enough to be highly technically significant. When the lower of these double trend lines is breached by a close of 3% or more of market value that should indicate a trend change. It does not indicate what degree the trend change should be though. It looks like the last two corrections may have ended about the lower aqua blue trend line, which gives the wave count a typical look.
I have pulled the upper trend line down a little to touch the low of minute wave a within minor wave 4. This may be a better position for recent movement.
There is still triple technical divergence between MACD and price at the weekly chart level.
Minute wave i lasted seven weeks, 36 days, which is two days longer than a Fibonacci 34. Minute wave ii has now lasted 38 days, and there is more structure required to complete it.
At 2,191 primary wave 3 would reach 1.618 the length of primary wave 1. This would expect that within minor wave 5 minute wave iii will be shorter than minute wave i, and minute wave v will be shorter still. Or the target is wrong.
Looking at momentum within intermediate wave (5) it is concerning that minor wave 3 exhibits weakest momentum. It is for this reason I am seriously considering the alternate bullish wave count.
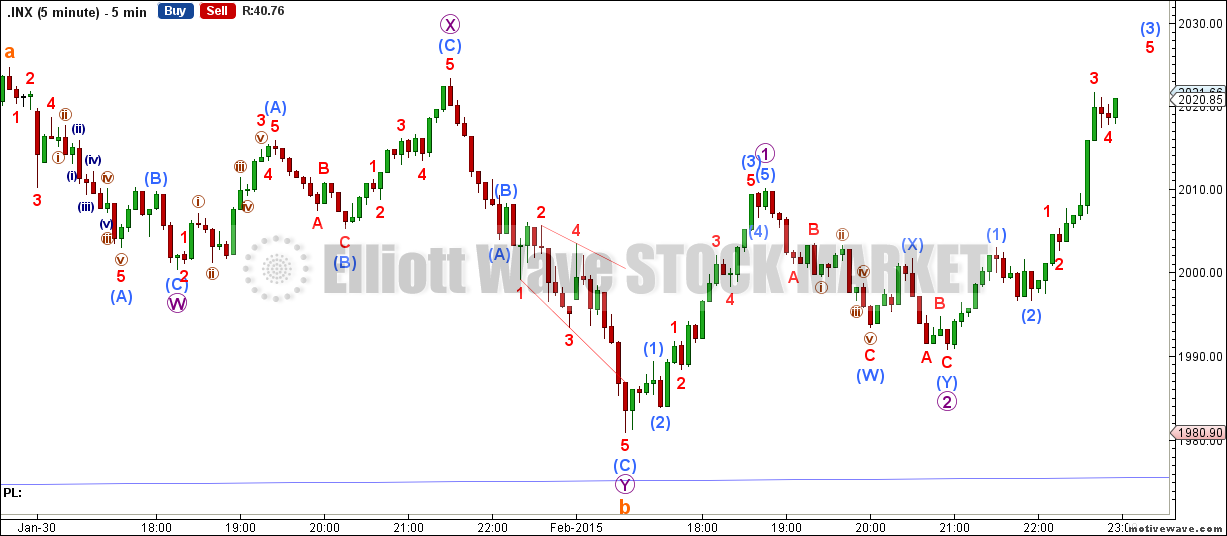
If minute wave ii is continuing then it is as a double combination: the first structure labelled minuette wave (w) (shown on the daily chart) is a zigzag, minuette wave (x) is a “three” in the opposite direction joining the two structures of the double, and minuette wave (y) must be a flat correction.
Within minuette wave (y) subminuette wave a is seen here as a zigzag. This downwards movement is ambiguous and can be seen as either a three or a five.
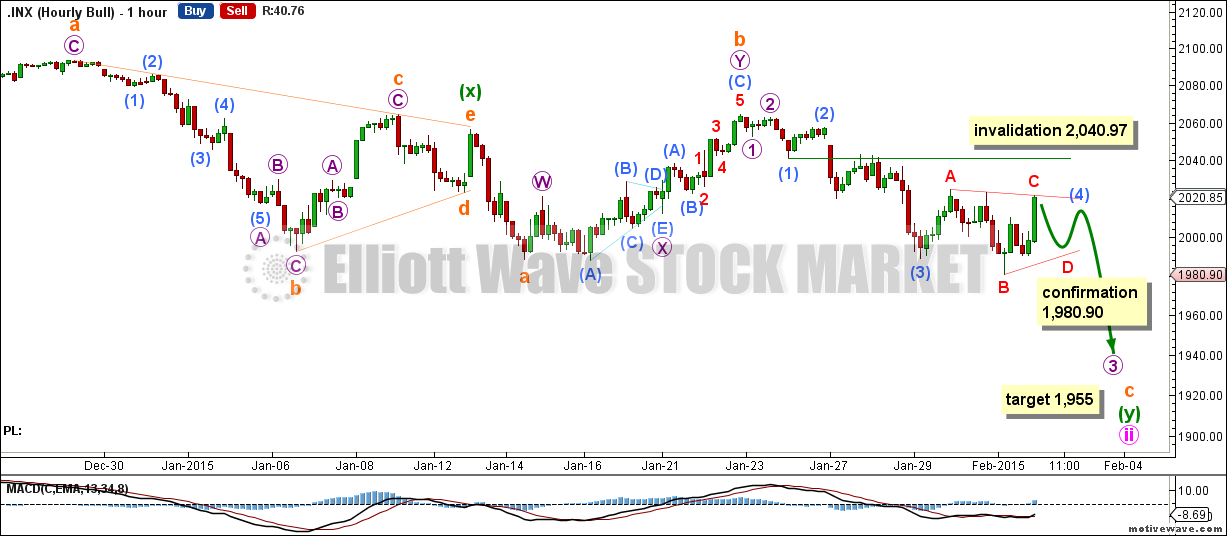
Subminuette wave b is a 112% correction of subminuette wave a so this flat would be an expanded flat. At 1,955 subminuette wave c would reach 1.618 the length of subminuette wave a, the most common ratio between A and C within an expanded flat. This would see minuette wave (y) end a little below the end of subminuette wave (w), and at the daily chart level the whole structure for minute wave ii would have a mostly sideways look to it.
The purpose of double combinations is to take up time and move price sideways, so minuette wave (y) should end around the same level as minuette wave (w).
Subminuette wave c must subdivide as a five wave structure and within it micro waves 1 and 2 are complete and micro wave 3 is unfolding towards the downside.
The recent sideways movement was ambiguous and was formed of three wave structures suggesting a triangle is underway. Just as double combinations, triangles are time consuming and move price sideways.
Submicro wave 4 may not move into submicro wave 1 price territory above 2,040.97.
This wave count now requires further downwards movement, with two more obvious fourth wave corrections along the way down.
At 1,955 subminuette wave c will reach 1.618 the length of subminuette wave a.
Alternate Bull Wave Count
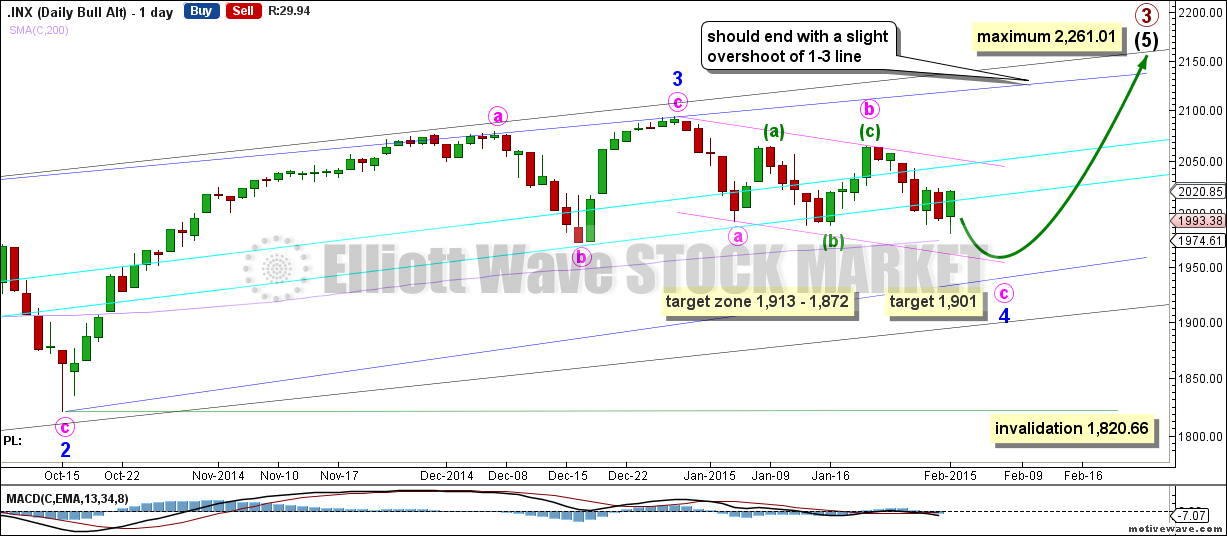
Looking at momentum for the whole of intermediate wave (5) I want to label minor wave 3 over at the high at 2,094 because this has the strongest upwards momentum. The only way this fits is if intermediate wave (5) is seen as an ending diagonal, because within an ending diagonal all the sub waves must be zigzags and the fourth wave should overlap first wave price territory.
The diagonal is contracting: minor wave 3 is shorter than minor wave 1 and minor wave 4 is expected to be shorter than minor wave 2.
Minor wave 4 has more to offer towards the downside and within it minute wave a unfolded as an impulse and minute wave b unfolded as a flat correction labeled minuette waves (a), (b) and (c).
So long as price does not close more than 3% below that aqua blue trend line, and for minor wave 4 to be more normal and deeper, minor wave 4 might find a bottom at 1,901 as at that level minute wave c would reach 1.618 the length of minute wave a. I’m using this ratio for the target because it would bring minor wave 4 down to within the normal range of 0.66 to 0.81 of minor wave 3. This is given as a “target zone” that starts from 1,913 and ends at 1,872 representing 0.66 to 0.81 of minor wave 3, respectively.
Minor wave 4 may not move beyond the end of minor wave 2 below 1,820.66.
I’m seeing minute wave b as a perfect regular flat correction, within minor wave 4 zigzag.
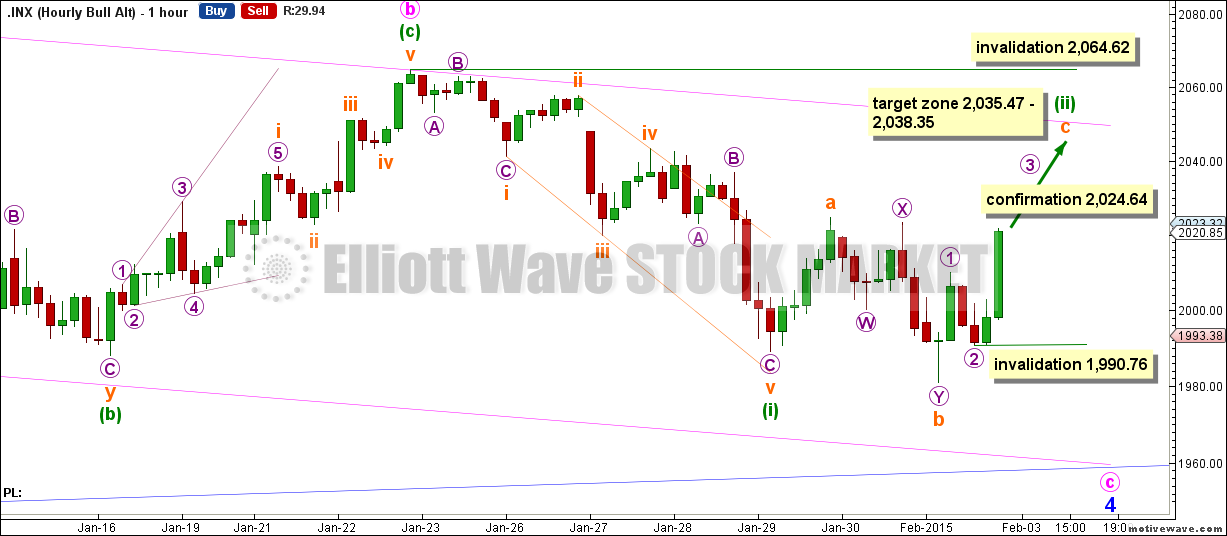
Minute wave c is seen subdividing highly likely as an impulse with minuette wave (i) complete as an expanding leading diagonal and minuette wave (ii) is unfolding towards the upside.
Minuette wave (ii) is seen unfolding as an expanded flat correction with subminuette waves a and b complete, and subminuette wave c is unfolding towards the upside as an impulse.
The target zone for the completion of minuette wave (ii) starts at 2,035.47 as at that level minuette wave (ii) will reach 0.618 the length of minuette wave (i), and that target zone ends at 2,038.35 where subminuette wave c will reach 1.618 the length of subminuette wave a. The upper trend line of the Elliott channel connecting the start of minute wave a to the end of minute wave b should provide support if price continued upwards exceeding the target zone.
Minuette wave (ii) may not move beyond the start of minuette wave (i) above 2,064.62. Also within micro wave 3 within subminuette wave c no second wave may move beyond the start of its first wave below 1,990.76.
Bear Wave Count
This bear wave count differs from the bull wave count at the monthly chart level and at super cycle wave degree. To see the historic picture go here.
The subdivisions within primary waves A-B-C are seen in absolutely exactly the same way as primary waves 1-2-3 for the bull wave count. The alternate bull wave count idea also works perfectly for this bear wave count.
At cycle degree wave b is over the maximum common length of 138% the length of cycle wave a, at 165% the length of cycle wave a. At 2,393 cycle wave b would be twice the length of cycle wave a and at that point this bear wave count should be discarded.
While we have no confirmation of this wave count we should assume the trend remains the same, upwards. This wave count requires confirmation before I have confidence in it.
This analysis is published about 12:03 a.m. EST.
Nady thanks – just want to double check with you that we now expect the alternate to dip down to the 1900 area before ascending to top trend line – 2261 max. Reason for asking is that on previous day’s video we had alternate not dipping down so low before ascension. Regards Matt.