
Downwards movement was expected for the main Elliott wave count and upwards movement was expected for the alternate.
Summary: I expect downwards movement at least to start tomorrow’s session. If the blue 2-4 trend line on the alternate chart is not breached, and this trend line provides support initiating an upwards bounce, the alternate wave count will be favoured. If price moves below 1,988.12 the main wave count would be confirmed and the alternate invalidated.
Click on charts to enlarge.
Main Bull Wave Count
I will favor neither the bull or bear wave count. Both are viable and both expect this current upwards impulse may again be close to complete.
To see a weekly chart with subdivisions and how to draw trend lines and channels click here.
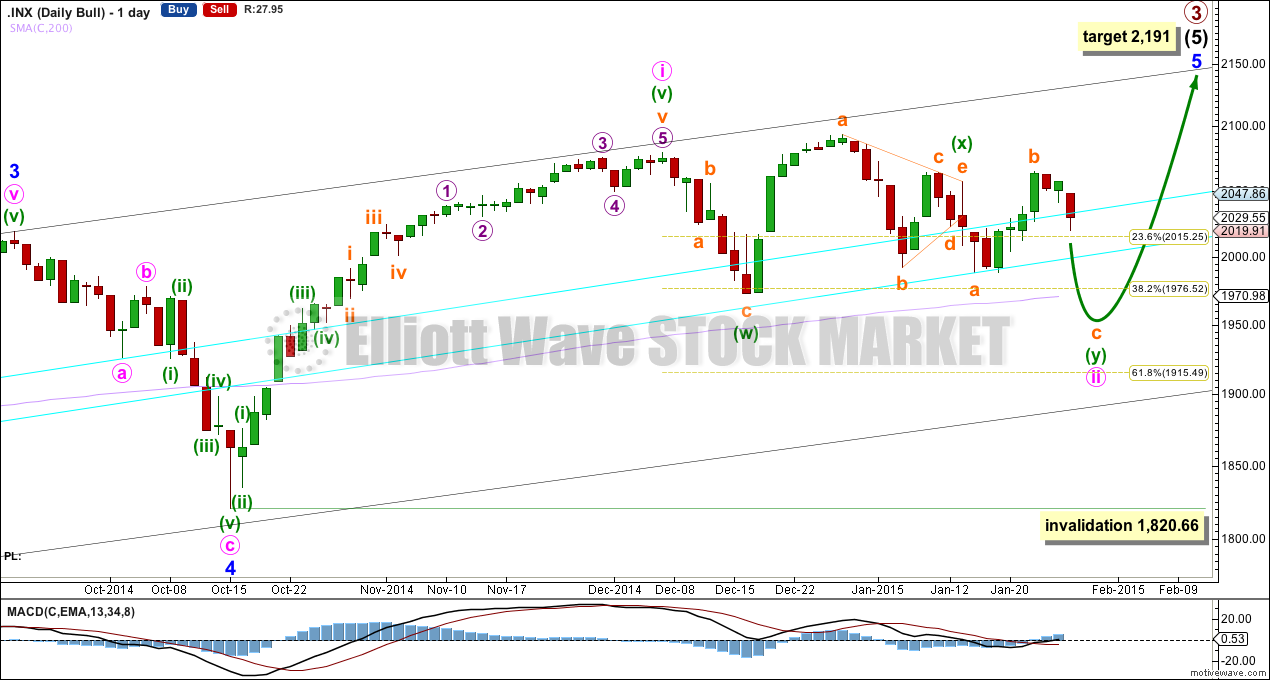
Upwards movement from the low at 666.79 subdivides as an incomplete 5-3-5. For the bull wave count this is seen as primary waves 1-2-3.
The aqua blue trend lines are traditional technical analysis trend lines. These lines are long held, repeatedly tested, and shallow enough to be highly technically significant. When the lower of these double trend lines is breached by a close of 3% or more of market value that should indicate a trend change. It does not indicate what degree the trend change should be though. It looks like the last two corrections may have ended about the lower aqua blue trend line, which gives the wave count a typical look.
I have pulled the upper trend line down a little to touch the low of minute wave a within minor wave 4. This may be a better position for recent movement.
There is still triple technical divergence between MACD and price at the weekly chart level.
Minute wave i lasted seven weeks, 36 days, which is two days longer than a Fibonacci 34. Minute wave ii has now lasted 34 days, and there is more structure required to complete it.
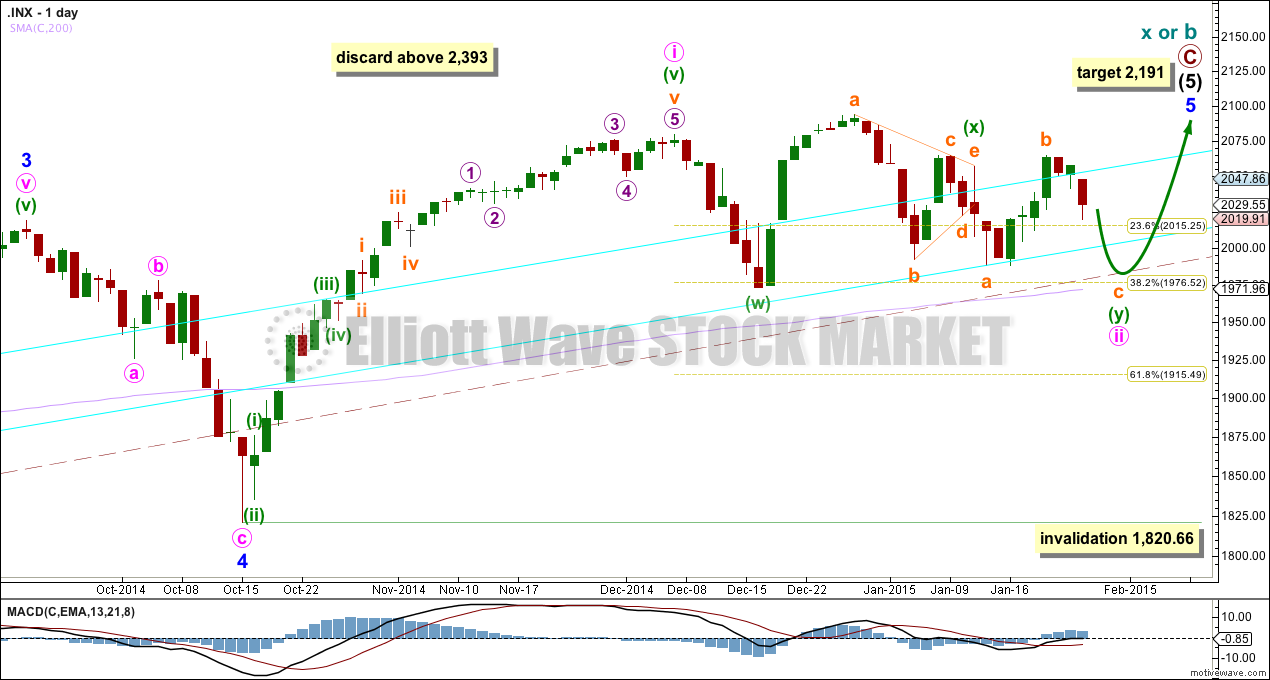
At 2,191 primary wave 3 would reach 1.618 the length of primary wave 1. This would expect that within minor wave 5 minute wave iii will be shorter than minute wave i, and minute wave v will be shorter still. Or the target is wrong.
Looking at momentum within intermediate wave (5) it is concerning that minor wave 3 exhibits weakest momentum. It is for this reason I am seriously considering the alternate bullish wave count.
If minute wave ii is continuing then it is as a double combination: the first structure labelled minuette wave (w) (shown on the daily chart) is a zigzag, minuette wave (x) is a “three” in the opposite direction joining the two structures of the double, and minuette wave (y) must be a flat correction.
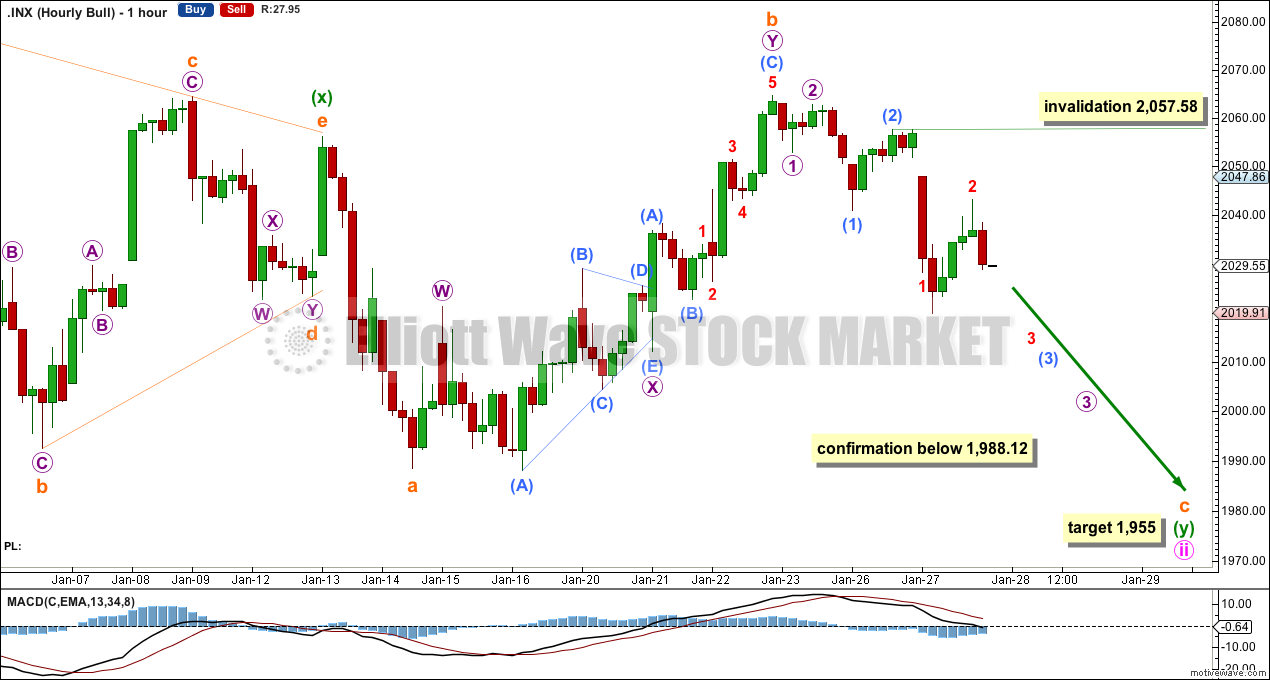
Within minuette wave (y) subminuette wave a is seen here as a zigzag. This downwards movement is ambiguous and can be seen as either a three or a five.
Subminuette wave b is a 112% correction of subminuette wave a. At 1,955 subminuette wave c would reach 1.618 the length of subminuette wave a, the most common ratio between A and C within and expanded flat. This would see minuette wave (y) end a little below the end of subminuette wave (w), and at the daily chart level the whole structure for minute wave ii would have a mostly sideways look to it.
The purpose of double combinations is to take up time and move price sideways, so minuette wave (y) should end around the same level as minuette wave (w).
Subminuette wave c must subdivide as a five wave structure, and it is extremely likely to at least make a new low below the end of subminuette wave a at 1,988.44 to avoid a truncation and a very rare running flat.
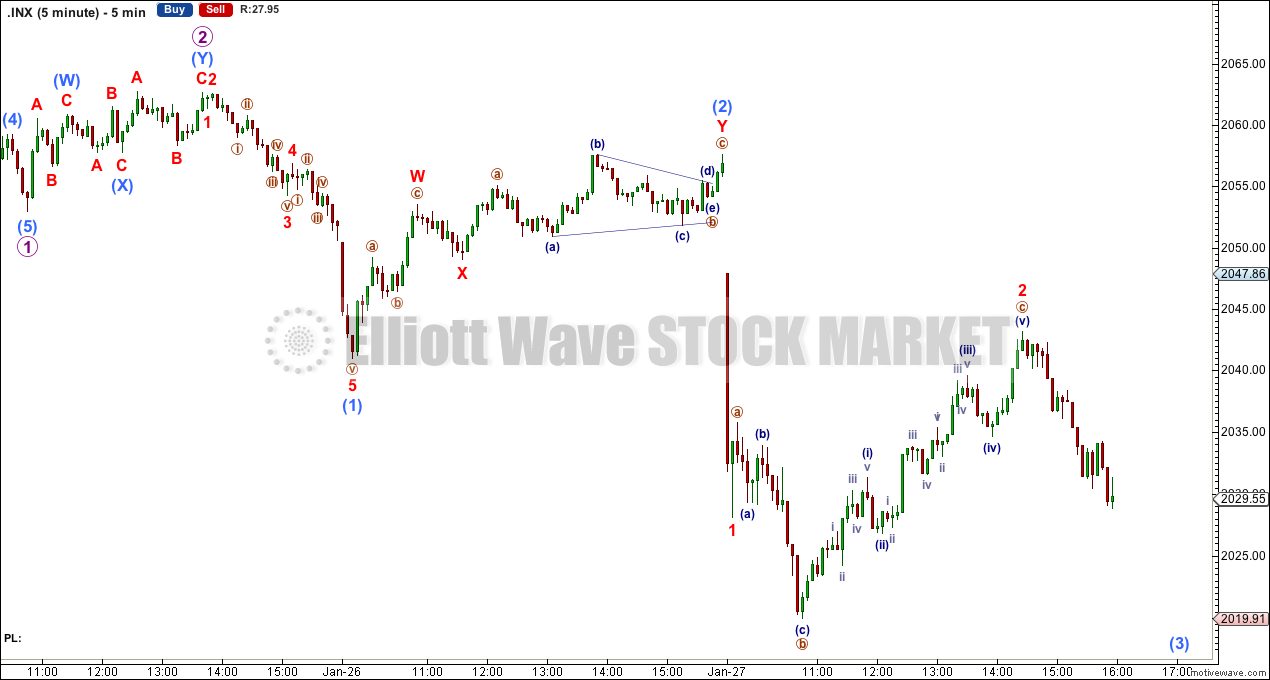
Subminuette wave c may be beginning with a series of overlapping first and second waves, although the increasing size of each second wave correction and the structure of minuscule wave 2 are concerns for this wave count.
Minuscule wave 2 may not move beyond the start of minuscule wave 1 above 2,057.58.
Alternate Bull Wave Count
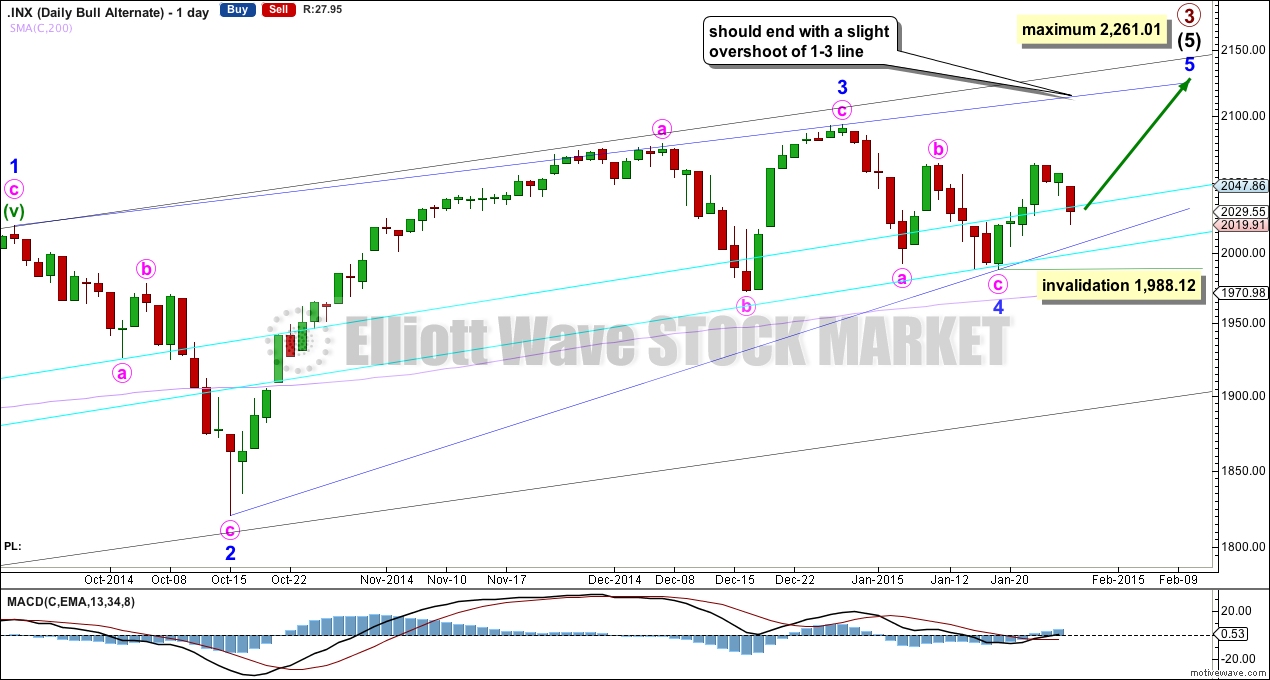
Looking at momentum for the whole of intermediate wave (5) I want to label minor wave 3 over at the high at 2,094 because this has the strongest upwards momentum. The only way this fits is if intermediate wave (5) is seen as an ending diagonal, because within an ending diagonal all the sub waves must be zigzags.
The diagonal is contracting: minor wave 3 is shorter than minor wave 1 and minor wave 4 is shorter than minor wave 2.
Within the final zigzag of minor wave 5 minute wave b may not move beyond the start of minute wave a below 1,988.12.
Minor wave 5 may not be longer than equality with minor wave 3, because the diagonal is contracting and a third wave may never be the shortest. This limit is at 2,261.01. However, I would expect minor wave 5 to come to an end well below this point, and should end with a slight overshoot of the 1-3 trend line as this is the most common place for fifth waves of contracting diagonals to end. This trend line is probably the best way to tell when this fifth wave should end.
Minor wave 1 lasted 228 days (5 short of a Fibonacci 233), minor wave 2 lasted 18 days, minor wave 3 lasted 51 days, and minor wave 4 lasted a Fibonacci 13 days. Minor wave 5 should be more brief than minor wave 3, and it may be about even in duration with minor wave 4. It may end in another 7 days time to total a Fibonacci 13.
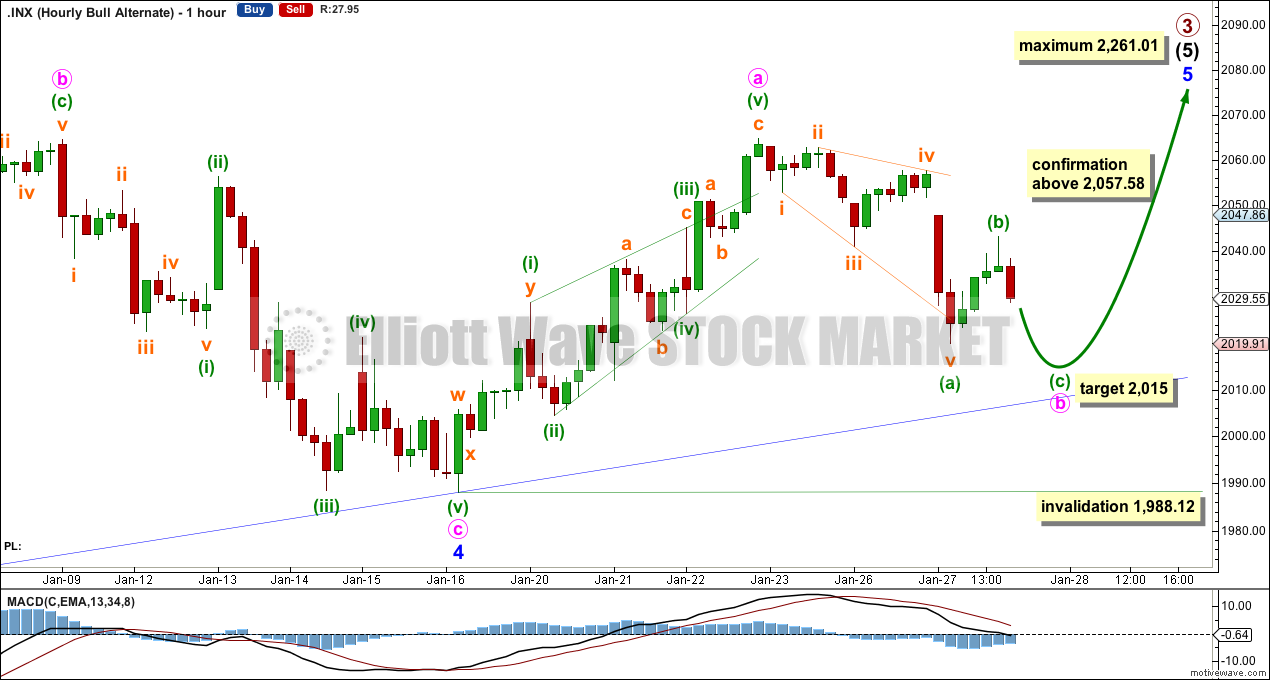
Minute wave b may be continuing lower. If it reaches the blue 2-4 trend line copied over here from the daily chart I would expect it to find very strong support there. Diagonals almost always adhere very closely to their trend lines.
So far within minute wave b minuette wave (a) may be a completed leading expanding diagonal. This downwards movement may also be labelled as an incomplete double zigzag, which would also require one final downwards wave.
At 2,015 minuette wave (c) would reach 0.618 the length of minuette wave (a).
Minute wave b may not move beyond the start of minute wave a below 1,988.12.
A new high tomorrow above 2,057,58 would provide a lot of confidence in this wave count.
Bear Wave Count
This bear wave count differs from the bull wave count at the monthly chart level and at super cycle wave degree. To see the historic picture go here.
The subdivisions within primary waves A-B-C are seen in absolutely exactly the same way as primary waves 1-2-3 for the bull wave count. The alternate bull wave count idea also works perfectly for this bear wave count.
At cycle degree wave b is over the maximum common length of 138% the length of cycle wave a, at 165% the length of cycle wave a. At 2,393 cycle wave b would be twice the length of cycle wave a and at that point this bear wave count should be discarded.
While we have no confirmation of this wave count we should assume the trend remains the same, upwards. This wave count requires confirmation before I have confidence in it.
This analysis is published about 08:21 p.m. EST.