
Upwards movement was expected for Thursday’s session. The Elliott wave counts remain the same.
Summary: More upwards movement is required in the short term. A new high above 2,124 would see the main bull wave count discarded in favour of the alternate.
Click on charts to enlarge.
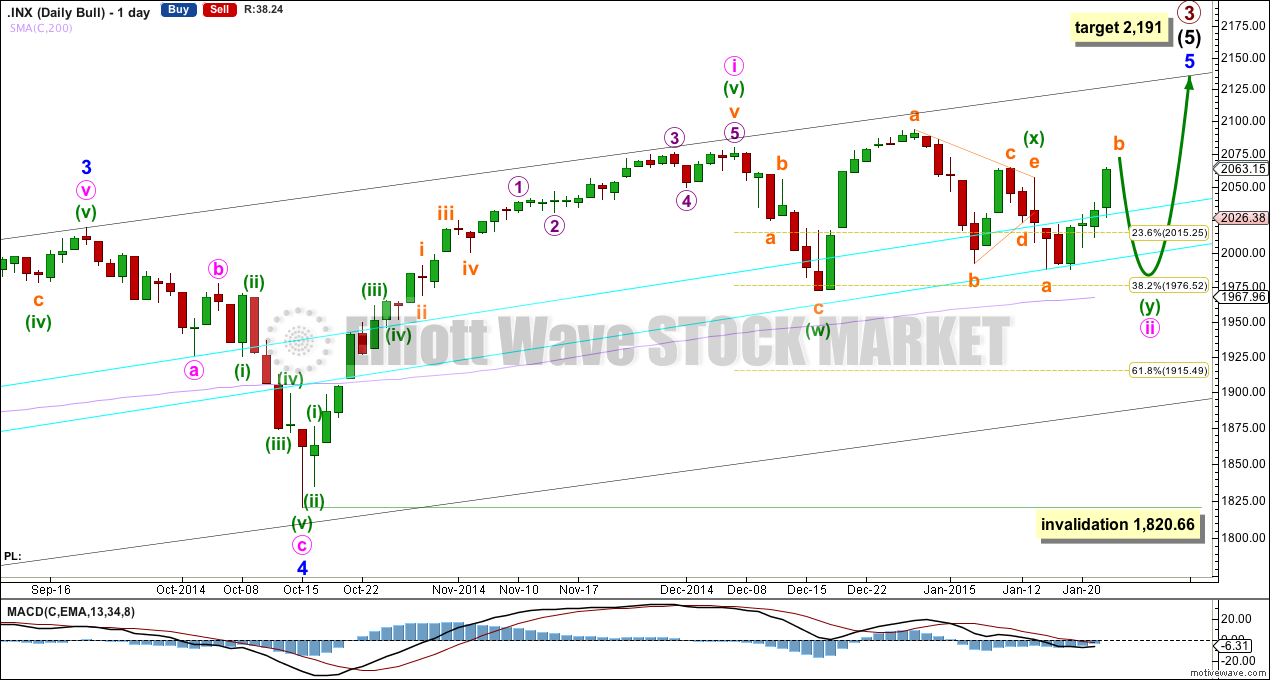
Main Bull Wave Count
I will favor neither the bull or bear wave count. Both are viable and both expect this current upwards impulse may again be close to complete.
To see a weekly chart with subdivisions and how to draw trend lines and channels click here.
Upwards movement from the low at 666.79 subdivides as an incomplete 5-3-5. For the bull wave count this is seen as primary waves 1-2-3.
The aqua blue trend lines are traditional technical analysis trend lines. These lines are long held, repeatedly tested, and shallow enough to be highly technically significant. When the lower of these double trend lines is breached by a close of 3% or more of market value that should indicate a trend change. It does not indicate what degree the trend change should be though. It looks like the last two corrections may have ended just short of the lower aqua blue trend line, which gives the wave count a typical look.
I have pulled the upper trend line down a little to touch the low of minute wave a within minor wave 4. This may be a better position for recent movement.
There is still triple technical divergence between MACD and price at the weekly chart level.
Minute wave i lasted seven weeks, 36 days, which is two days longer than a Fibonacci 34. Minute wave ii has now lasted 31 days. It if ends in another three to five sessions it would be equal in duration or a Fibonacci 34 days.
At 2,191 primary wave 3 would reach 1.618 the length of primary wave 1. This would expect that within minor wave 5 minute wave iii will be shorter than minute wave i, and minute wave v will be shorter still. Or the target is wrong.
Looking at momentum within intermediate wave (5) it is concerning that minor wave 3 exhibits weakest momentum. It is for this reason I am seriously considering the alternate bullish wave count.
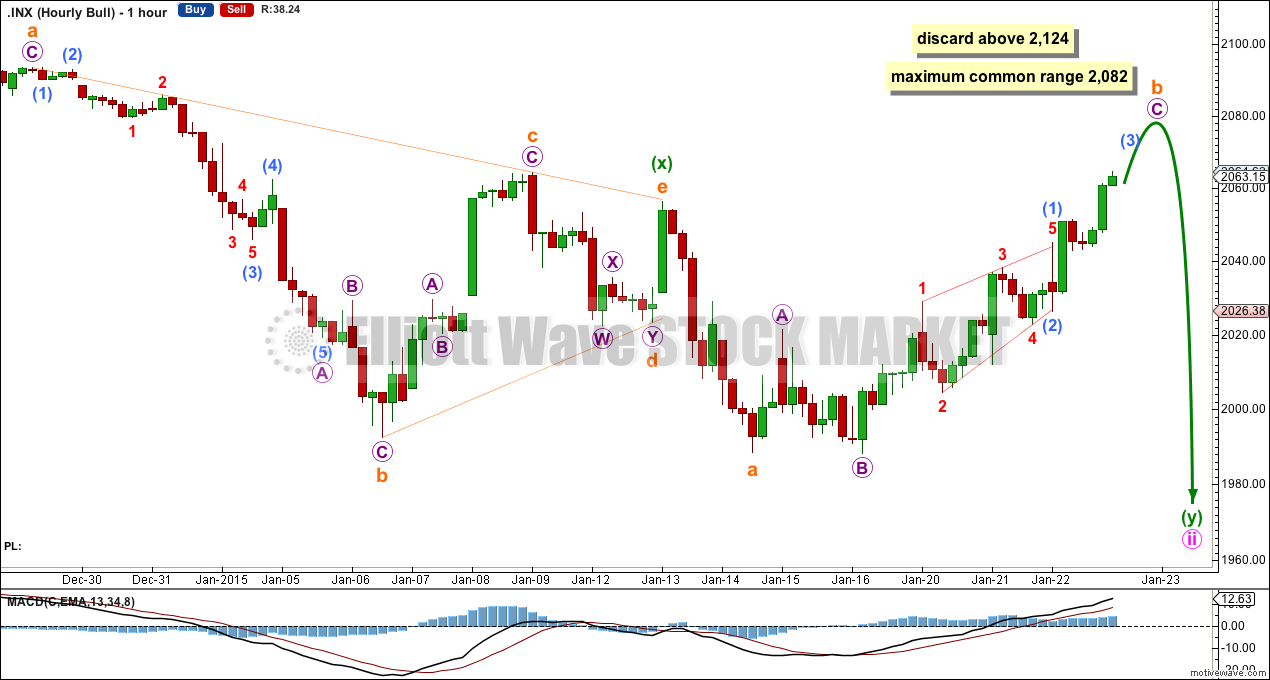
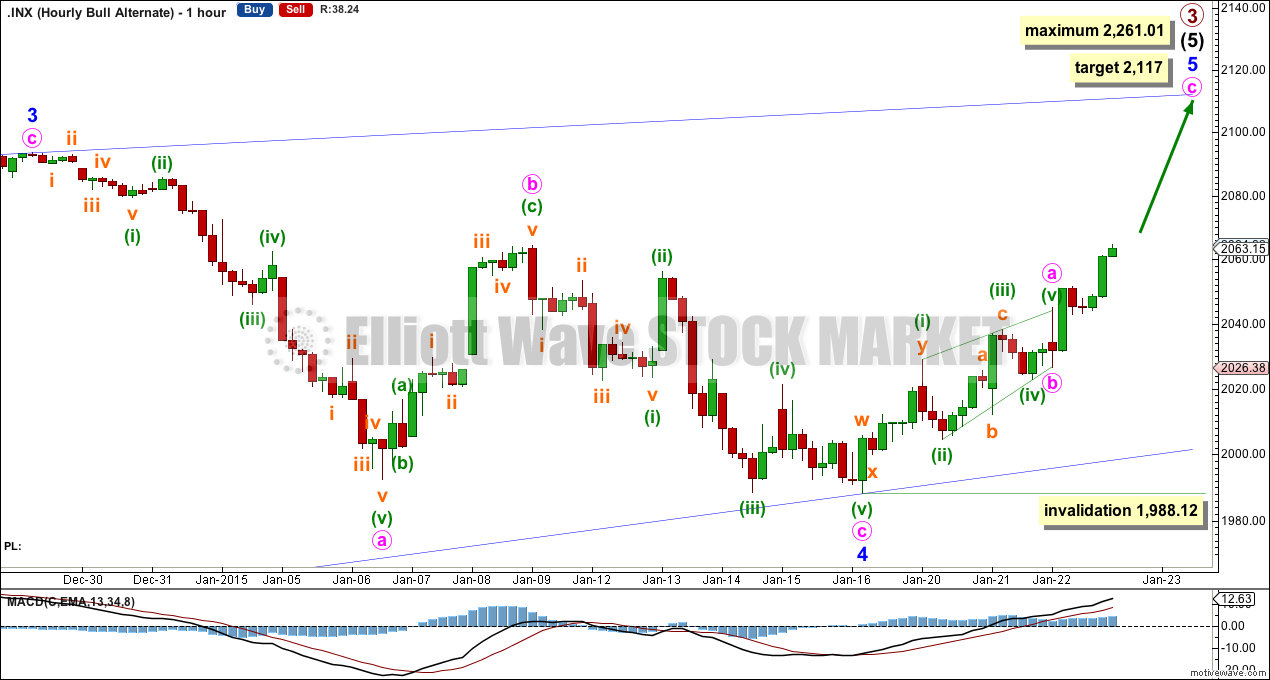
Minute wave ii would be still incomplete. It is unfolding as a double combination: zigzag – X – flat.
Within the second structure in this double, the flat of minuette wave (y), subminuette wave b is itself a regular flat with a rather long C wave. Subminuette wave b has reached and passed the minimum requirement of 90% the length of subminuette wave a. At 2,082 subminuette wave b would be the maximum common length of a B wave within a flat at 138% the length of subminuette wave a. It is reasonably likely to end before this point, but it does not have to.
The maximum allowable length for a B wave within a flat is twice the length of the A wave. Subminuette wave b would reach this maximum length at 2,124. If upwards movement passes this point this wave count should be discarded. It would not be invalidated (there is no maximum limit, just a maximum tendency) but the probability that an expanded flat is unfolding for minuette wave (y) would be so minuscule.
When subminuette wave b is over this wave count expects subminuette wave c to move below the end of subminuette wave a at 1,988.44 to avoid a truncation and a very rare running flat. That would complete the corrective structure for minute wave ii.
Minuette wave (y) is very likely to end close to the same level as minuette wave (w) at 1,972.56 as the purpose of combinations is to take up time and move price sideways, and to achieve this purpose the second structure ends close to the same level as the first.
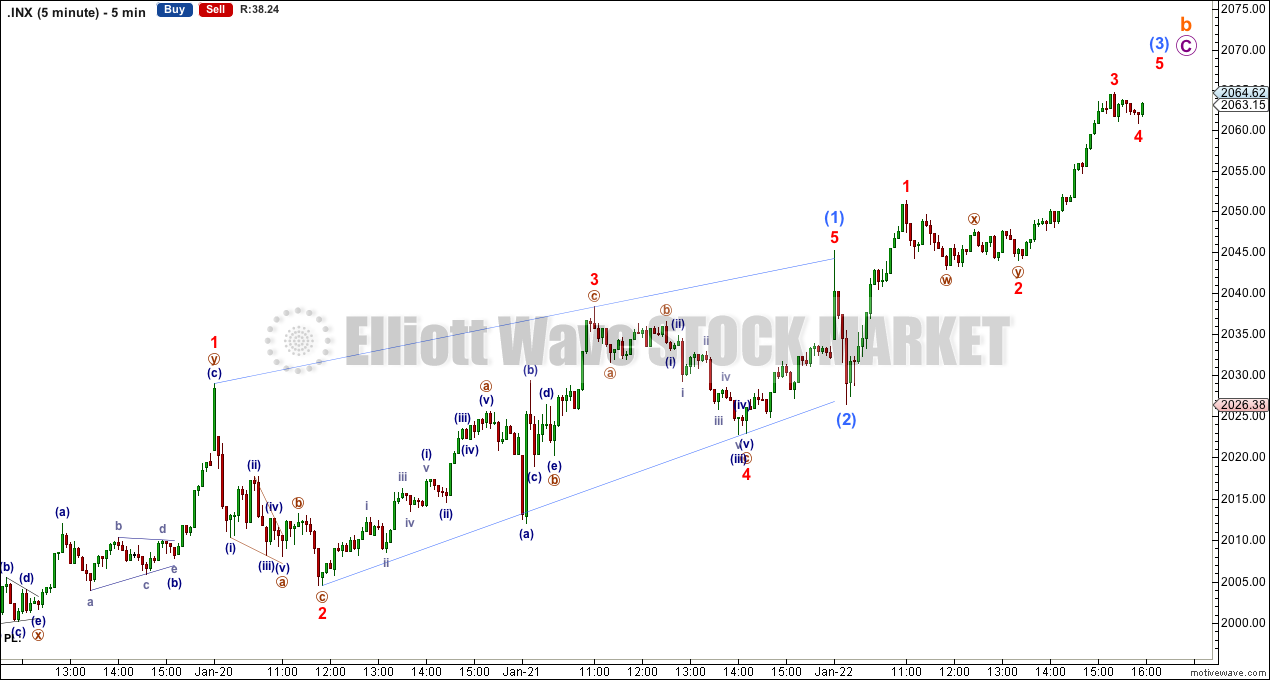
Within the five wave structure up for micro wave C I have a problem today with the subdivisions. Because the first upwards movement labelled here minuscule wave 1 fits only as a double zigzag on the five minute chart, the first wave up within micro wave C must be a leading diagonal. When first waves subdivide as leading diagonals they are normally followed by very deep second wave corrections. Submicro wave (1) is a leading contracting diagonal, but submicro wave (2) is a lot more shallow than should be expected. This reduces the probability of this main wave count slightly in favour of the alternate.
Alternate Bull Wave Count
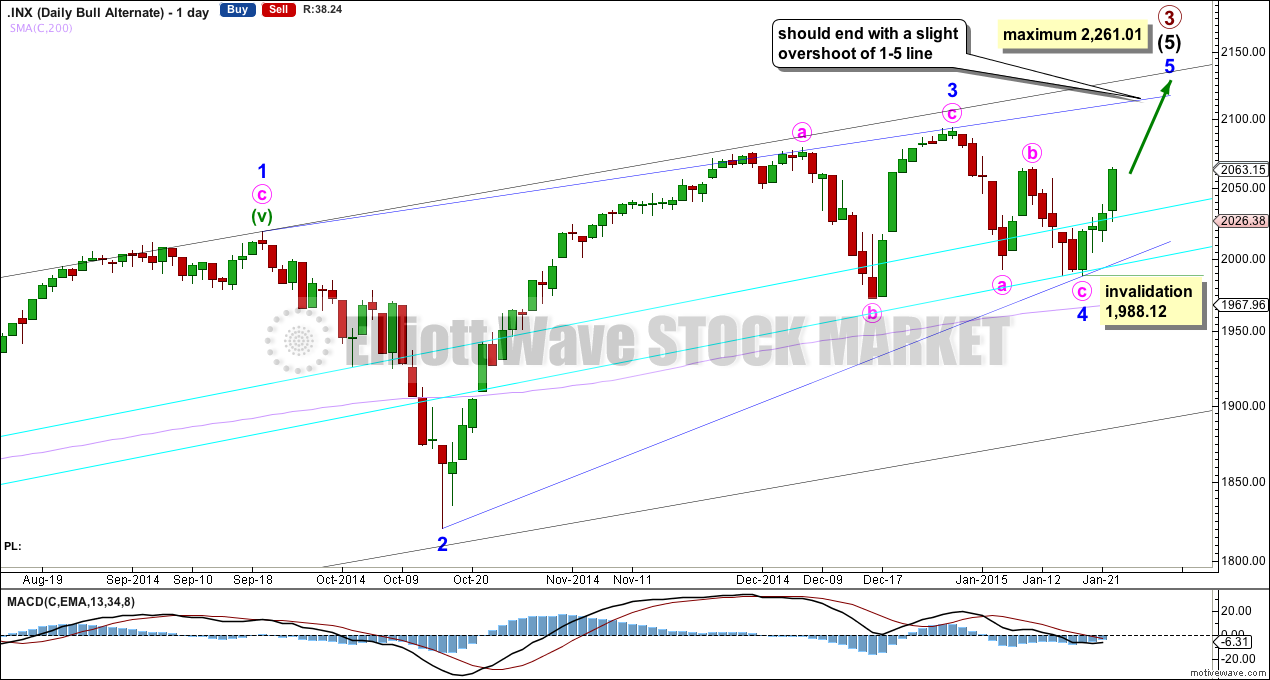
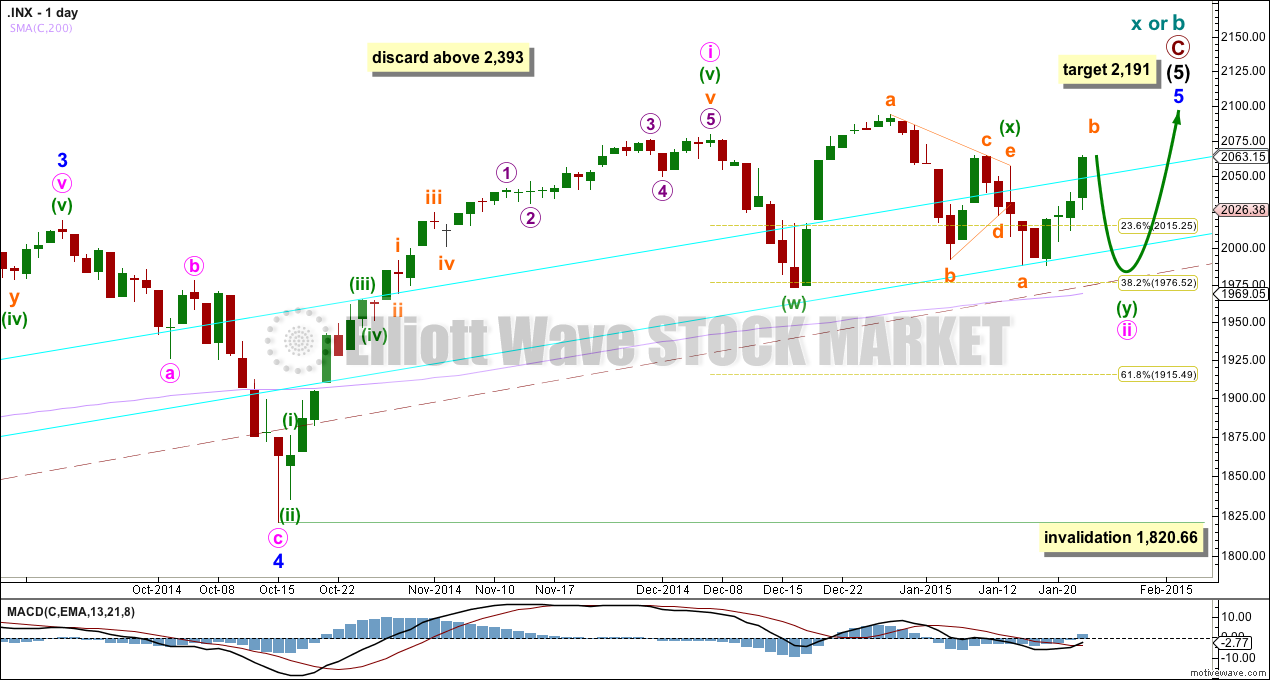
Looking at momentum for the whole of intermediate wave (5) I want to label minor wave 3 over at the high at 2,094 because this has the strongest upwards momentum. The only way this fits is if intermediate wave (5) is seen as an ending diagonal, because within an ending diagonal all the sub waves must be zigzags.
The diagonal is contracting: minor wave 3 is shorter than minor wave 1 and minor wave 4 is shorter than minor wave 2.
Within the final zigzag of minor wave 5 minute wave b may not move beyond the start of minute wave a below 1,988.12.
Minor wave 5 may not be longer than equality with minor wave 3, because the diagonal is contracting and a third wave may never be the shortest. This limit is at 2,261.01. However, I would expect minor wave 5 to come to an end well below this point, and should end with a slight overshoot of the 1-3 trend line as this is the most common place for fifth waves of contracting diagonals to end. This trend line is probably the best way to tell when this fifth wave should end.
Minor wave 1 lasted 228 days (5 short of a Fibonacci 233), minor wave 2 lasted 18 days, minor wave 3 lasted 51 days, and minor wave 4 lasted a Fibonacci 13 days. Minor wave 5 should be more brief than minor wave 3, and it may be about even in duration with minor wave 4. It may end in another 10 days time to total a Fibonacci 13.
Within minor wave 5 minute wave a fits as a leading contracting diagonal. Minute wave b is also probably over as a quick shallow zigzag.
At 2,117 minute wave c would reach 2.618 the length of minute wave a. This would see upwards movement probably slightly overshoot the blue 1-3 trend line.
Bear Wave Count
This bear wave count differs from the bull wave count at the monthly chart level and at super cycle wave degree. To see the historic picture go here.
The subdivisions within primary waves A-B-C are seen in absolutely exactly the same way as primary waves 1-2-3 for the bull wave count. The alternate bull wave count idea also works perfectly for this bear wave count.
At cycle degree wave b is over the maximum common length of 138% the length of cycle wave a, at 165% the length of cycle wave a. At 2,393 cycle wave b would be twice the length of cycle wave a and at that point this bear wave count should be discarded.
While we have no confirmation of this wave count we should assume the trend remains the same, upwards. This wave count requires confirmation before I have confidence in it.
This analysis is published about 09:53 p.m. EST.
Thx Lara, I agree there’s no way to count 1988-2029 as an impulse. In the alt scenario, shouldn’t the b wave show up on the daily chart with an ED of this magnitude? The one today lasted less than one hr. With the shallow retraces, the ED does not have the right look anyhow which you always stress is important. It’s a very difficult count right now and I’m still searching myself for another count
I agree. I may have a solution today, although its not the best. That upwards movement from the last low is such a difficult piece to analyse.