
Sideways movement had the upper hand on Thursday`s session, That part was expected but also we expected short term upwards correction to take place before resuming downwards movement. Today`s price action suggests that this might not be the case.
Summary: Consolidation is expected to continue for one or two trading sessions as triangles typically unfold in a sideways manner. Following triangle completion, downwards movement should resume to complete the second wave correction.
Click on charts to enlarge.
Bull Wave Count
I will favor neither the bull or bear wave count. Both are viable and both expect this current upwards impulse may again be close to complete.
To see a weekly chart with subdivisions and how to draw trend lines and channels click here.
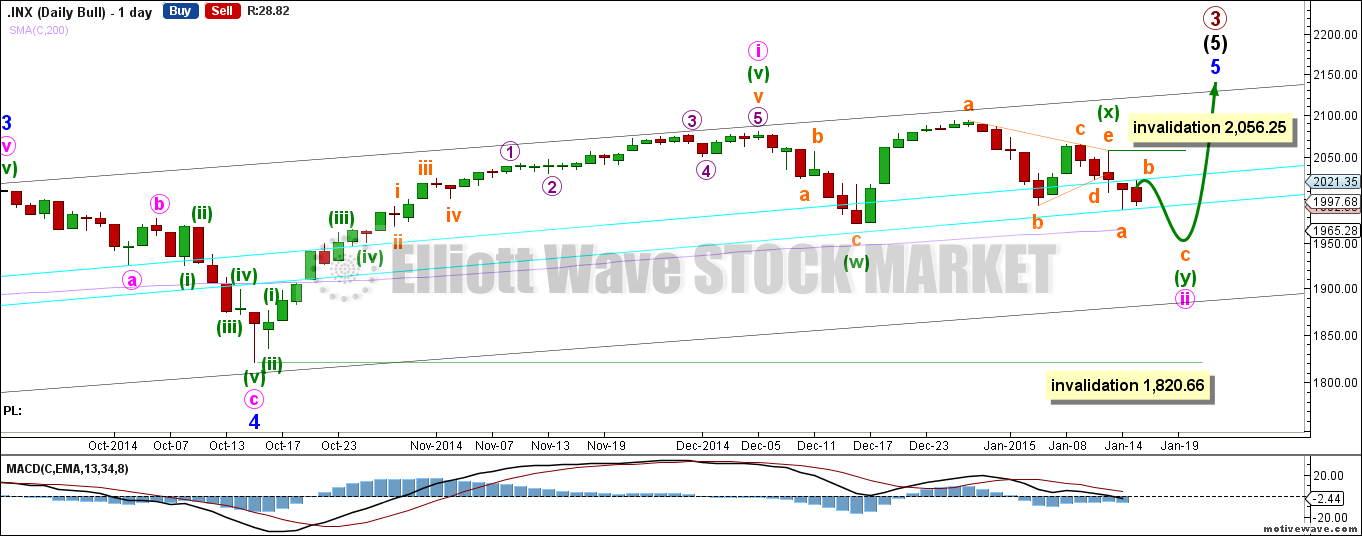
Upwards movement from the low at 666.79 subdivides as an incomplete 5-3-5. For the bull wave count this is seen as primary waves 1-2-3.
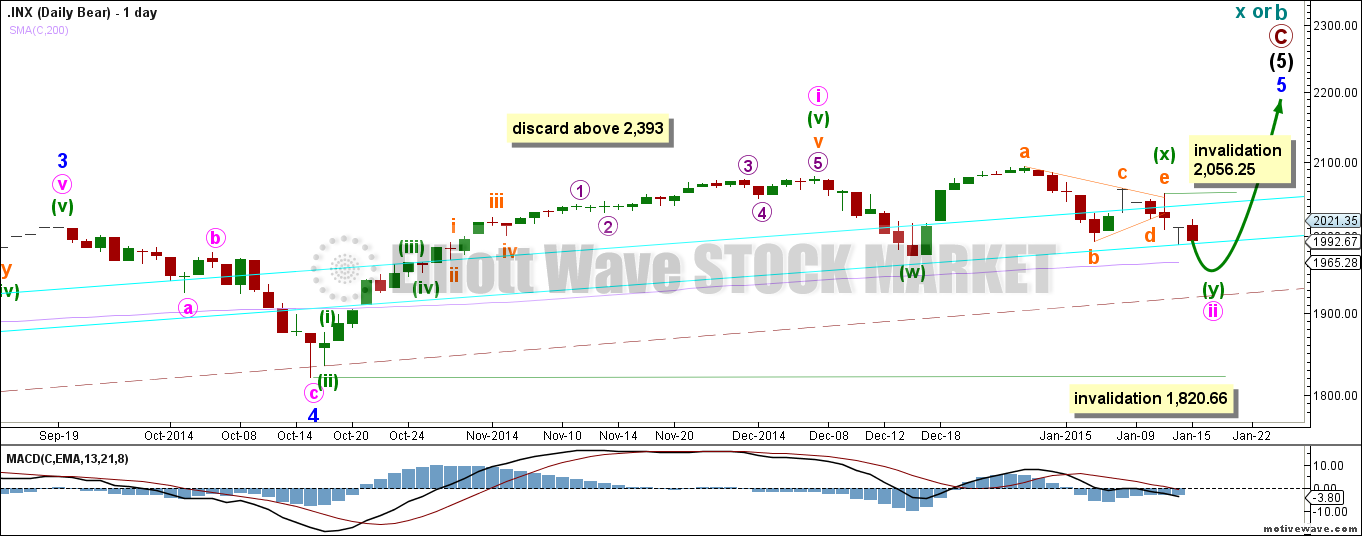
The aqua blue trend lines are traditional technical analysis trend lines. These lines are long held, repeatedly tested, and shallow enough to be highly technically significant. When the lower of these double trend lines is breached by a close of 3% or more of market value that should indicate a trend change. It does not indicate what degree the trend change should be though. It looks like the last two corrections may have ended just short of the lower aqua blue trend line, which gives the wave count a typical look.
I have pulled the upper trend line down a little to touch the low of minute wave a within minor wave 4. This may be a better position for recent movement.
There is still triple technical divergence between MACD and price at the weekly chart level.
Minute wave i lasted seven weeks, 36 days, which is two days longer than a Fibonacci 34. The recent downwards movement is labeled as a continuation of minute wave ii which is unfolding as a double zigzag labeled minuette waves (w), (x) and (y) green.
Minuette wave (w) unfolded as a zigzag while minuette wave (x) unfolded as a triangle. Today`s price action suggests that minuette wave (y) might be unfolding as a zigzag correction with subminuette wave a complete and subminuette wave b is underway.
We will be able to calculate a target for subminuette wave c once subminuette wave b is complete. Commonly, wave c should travel 42 points towards the downside to reach 0.618 the length of wave a or even travel 68 points to reach equality with wave a. Once started, the subdivisions within subminuette wave c will provide us with the guidance needed.
Minute wave ii may not move below the start of minute wave i at 1,820.66. Movement below that point will invalidate this count. Also, subminuette wave b may not move above the start of minuette wave a at 2,056.25.
Main Count Hourly Chart
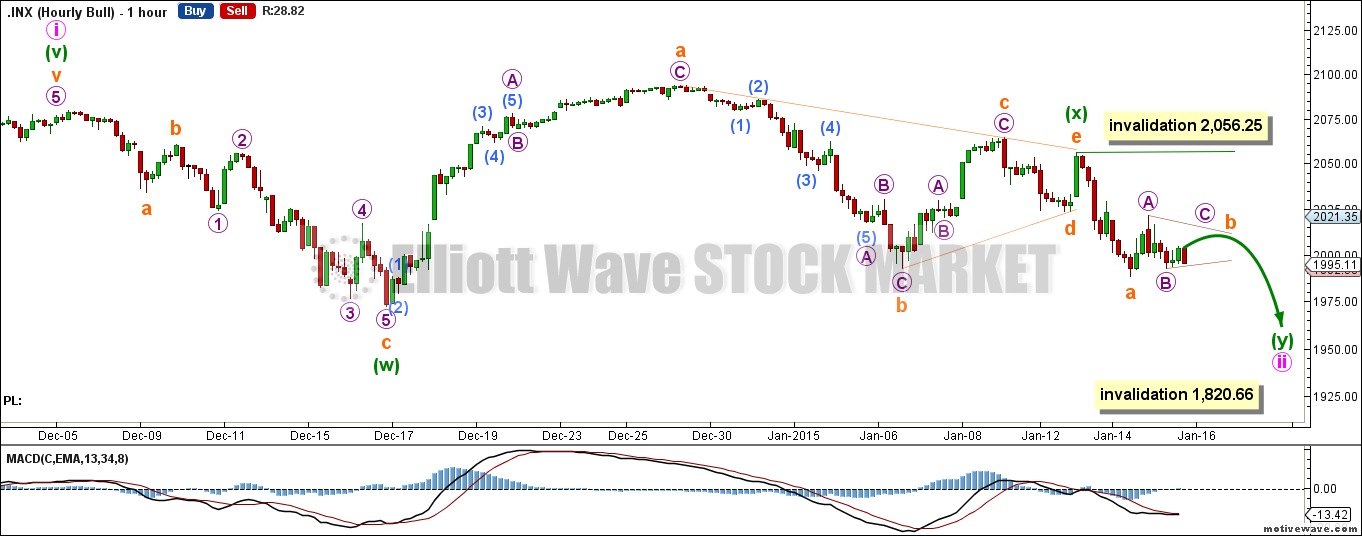
The recent downwards movement is seen as a continuation of minute wave ii which is unfolding as a double zigzag labeled minuette waves (w), (x) and (y).
Minuette wave (w) unfolded as a zigzag correction labeled subminuette waves a, b and c.
Minuette wave (x) unfolded as a triangle labeled subminuette waves a through e.
Minuette wave (y) is seen unfolding as a zigzag correction with subminuette wave a complete and subminuette wave b is unfolding as a triangle.
Subdivisions with subminuette wave a are ambiguous as they can be labeled as a five wave structure or a three wave structure. Therefore, it is possible that minuette wave (y) is unfolding as a double zigzag.
Time-wise, minuette wave (w) lasted 7 days and it is possible for wave (y) to reach equality with wave (w) from a time perspective.
We will be able to calculate a target for subminuette wave c once subminuette wave b is complete, commonly wave c should travel 42 points towards the downside to reach 0.618 the length of wave a or even travel 68 points to reach equality with wave a. Once started, the subdivisions within subminuette wave c will provide us with the guidance needed.
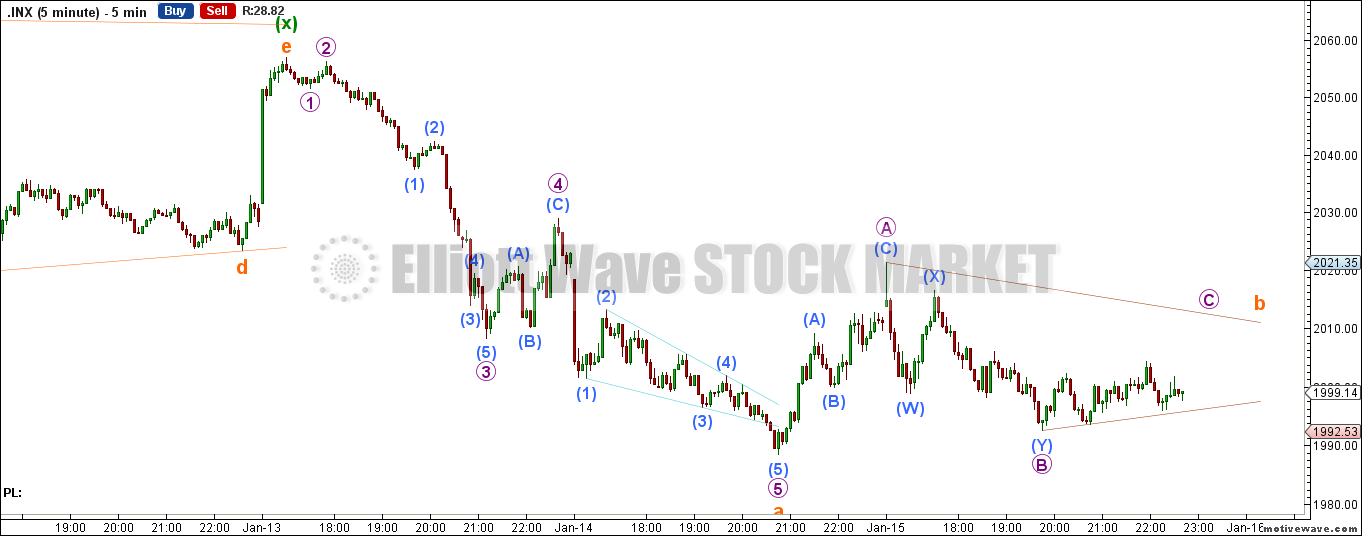
On the 5 minute chart subminuette wave b seems to be unfolding as a triangle with micro waves A and B complete. Since triangles are very hard to predict, this count`s invalidation point will remain at the start of subminuette wave a at 2,056.25 until the structure is confirmed on a higher time frame as subminuette wave b may not move beyond the start of a.
Minute wave ii may not move below the start of minute wave i at 1,820.66. Movement below that point will invalidate this count.
Alternate Bull Wave Count
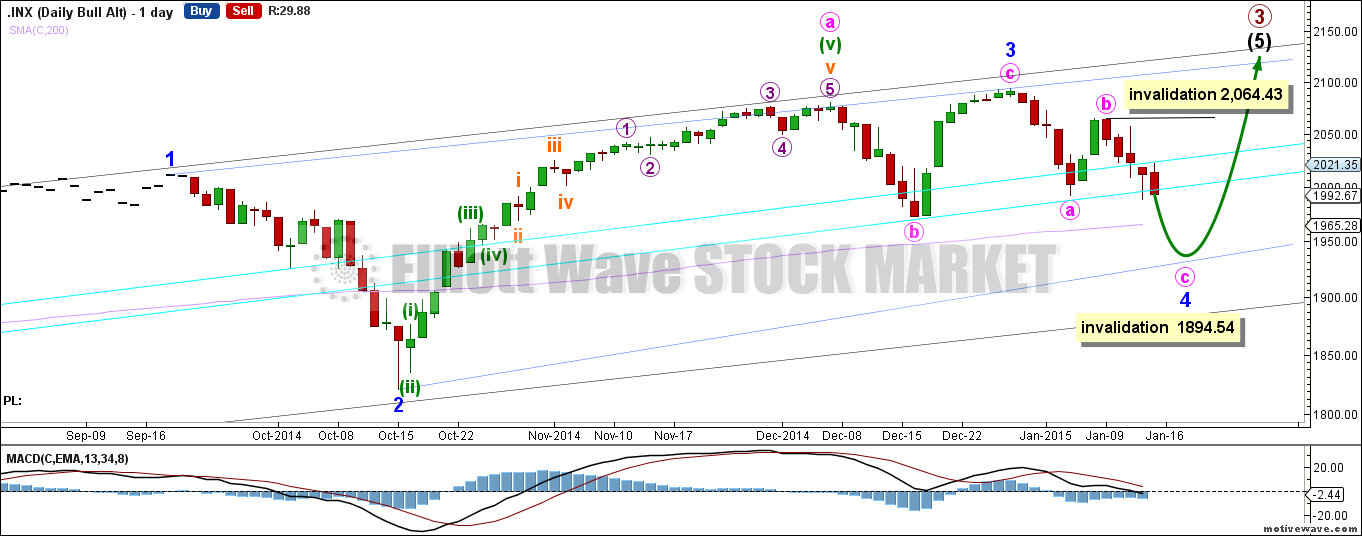
Alternatively, intermediate wave 5 may be an ending contracting diagonal. Within an ending diagonal all sub waves must be zigzags, and the fourth wave must overlap back into first wave price territory.
Within this diagonal minor wave 2 is .52 of minor wave 1, and there is no Fibonacci ratio between minor waves 1 and 3.
Within diagonals the normal depth of second and fourth waves is between 0.66 to 0.81. Therefore, a typical target zone for the completion of minor wave 4 may be between 1913.44 and 1872,51.
However, since this diagonal is a contracting ending diagonal wave 4 has to be shorter than wave 2 to provide us with converging trend lines which are the trade mark of contracting diagonals. Therefore, the maximum target for wave 4 is at equality with wave 2 at 1,894.55 and wave 4 may not move below this point for this count to provide the right look. This count would be discarded by movement below 1,894.54.
It is worth noting that momentum supports this count as we should typically see the highest momentum accompanying a third wave which is the case with this count. If further upwards movement continued to register higher momentum then this count probability will decrease.
Bear Wave Count
This bear wave count differs from the bull wave count at the monthly chart level and at super cycle wave degree. To see the historic picture go here.
The subdivisions within primary waves A-B-C are seen in absolutely exactly the same way as primary waves 1-2-3 for the bull wave count.
At cycle degree wave b is over the maximum common length of 138% the length of cycle wave a, at 165% the length of cycle wave a. At 2,393 cycle wave b would be twice the length of cycle wave a and at that point this bear wave count should be discarded.
While we have no confirmation of this wave count we should assume the trend remains the same, upwards. This wave count requires confirmation before I have confidence in it.
This analysis is published about 05:01 p.m. EST.