
My main Elliott wave count had expected upwards movement. This is not what happened. The main hourly wave count was invalidated with downwards movement, which is what the alternate expected.
Summary: In the short term I expect downwards movement to show a further increase in momentum early next week. The short / mid term target for next week is 1,942. In the short / mid term the bull and bear wave count now expect the same movement.
Click on charts to enlarge.
Bull Wave Count
I will favour neither the bull or bear wave count. Both are viable and both expect this current upwards impulse may again be complete.
To see a weekly chart with subdivisions and how to draw trend lines and channels click here.
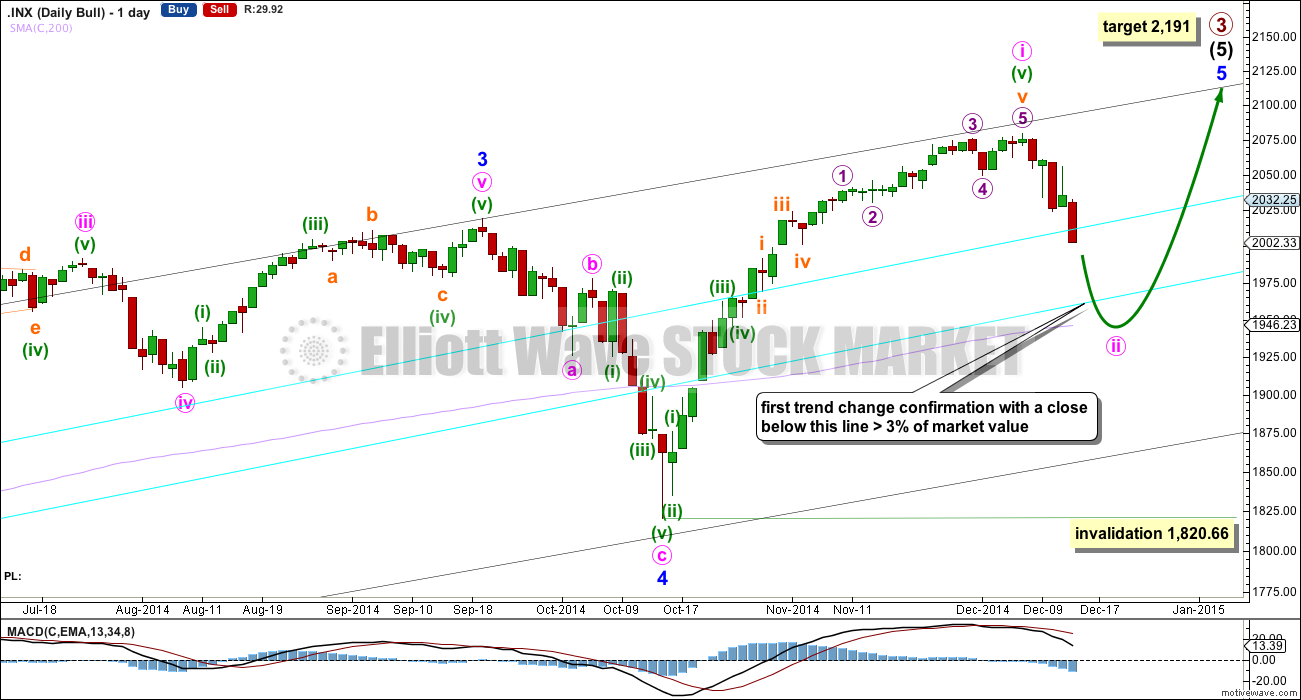
Upwards movement from the low at 666.79 subdivides as a complete 5-3-5. For the bull wave count this is seen as primary waves 1-2-3.
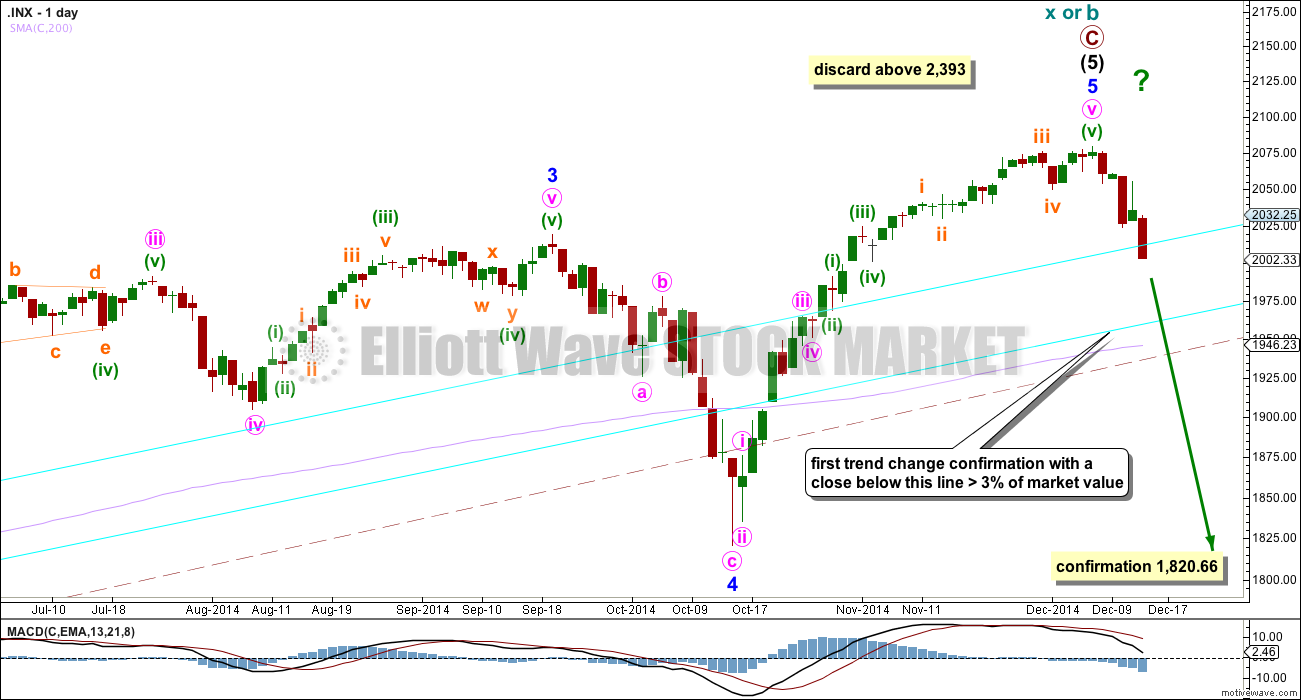
Within intermediate wave (5) minor wave 2 is an expanded flat and minor wave 4 is a zigzag. Minor wave 3 is 14.29 points longer than 1.618 the length of minor wave 1.
At intermediate degree there is also a very close relationship between intermediate waves (3) and (1): intermediate wave (3) is just 0.76 points less than 2.618 the length of intermediate wave (1).
The aqua blue trend lines are traditional technical analysis trend lines. These lines are long held, repeatedly tested, and shallow enough to be highly technically significant. When the lower of these double trend lines is breached by a close of 3% or more of market value that should indicate a trend change. It does not indicate what degree the trend change should be though.
There is still triple technical divergence between MACD and price at the weekly chart level.
I would expect the final top to form a slow curving structure, like a double head and shoulders or a rounding top. At the high volume should be low. I will expect to see deep second wave corrections if the high is now in place, forming the right hand shoulder or shoulders of a single or double head and shoulders pattern.
Because we should assume the trend remains the same until proven otherwise, while price remains above both aqua blue trend lines I will assume this downwards movement is a smaller correction within the upwards trend. This downwards movement may be minute wave ii, and it may find strong support now at the lower aqua blue trend line. These trend lines may force this second wave correction to be more shallow than otherwise. Minute wave ii may not move beyond the start of minute wave i below 1,820.66.
At 2,191 primary wave 3 would reach 1.618 the length of primary wave 1. This would expect that minor wave 5 is either an ending contracting diagonal (minute wave i would be seen as a zigzag, which is possible) or within minor wave 5 minute wave iii will be shorter than minute wave i, and minute wave v will be shorter still. Both these scenarios are possible. Or the target is wrong. At 2,184 minute wave iii would reach 0.618 the length of minute wave i.
Main Hourly Wave Count
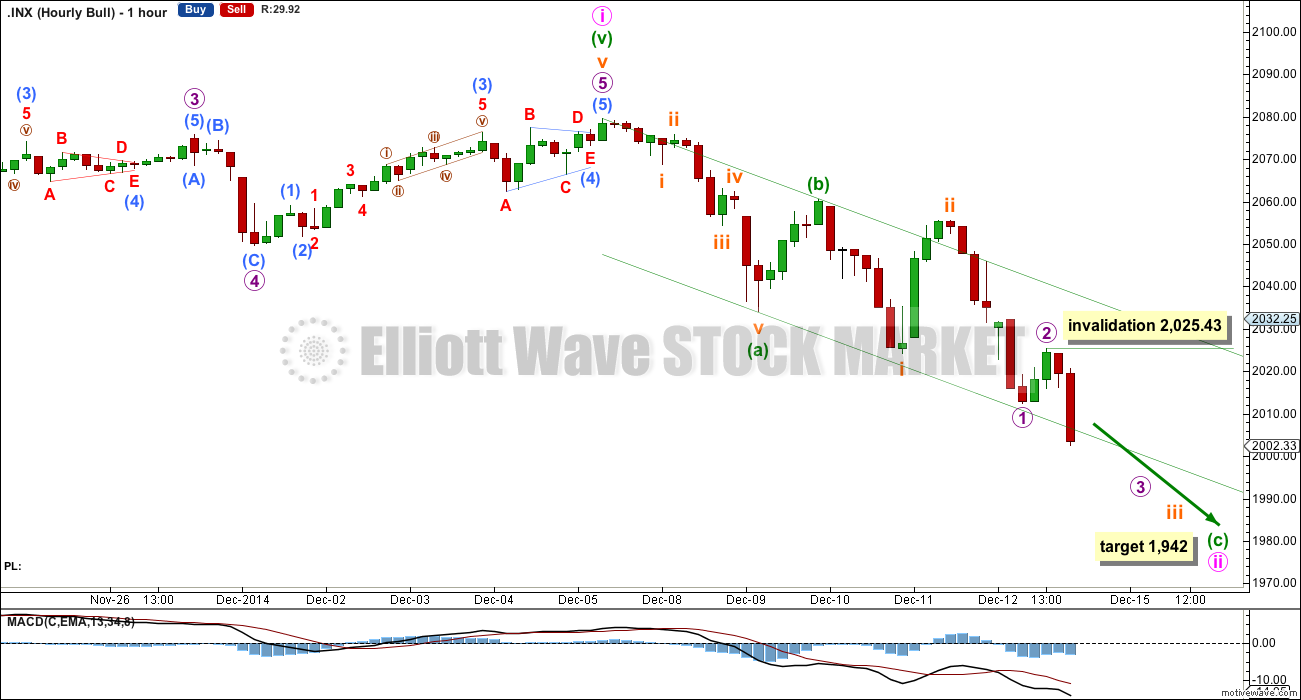
1-2-3 and A-B-C subdivide exactly the same: 5-3-5. This downwards movement may be an incomplete zigzag for minute wave ii.
At 1,942 minuette wave (c) would reach 2.618 the length of minuette wave (a). I am using this Fibonacci ratio to calculate the target because it looks like minuette wave (c) is extending and has begun with two overlapping first and second waves. Within micro wave 3 no second wave correction may move beyond its start above 2,025.43.
When the 5-3-5 downwards is complete then this main wave count will again diverge from the alternate below.
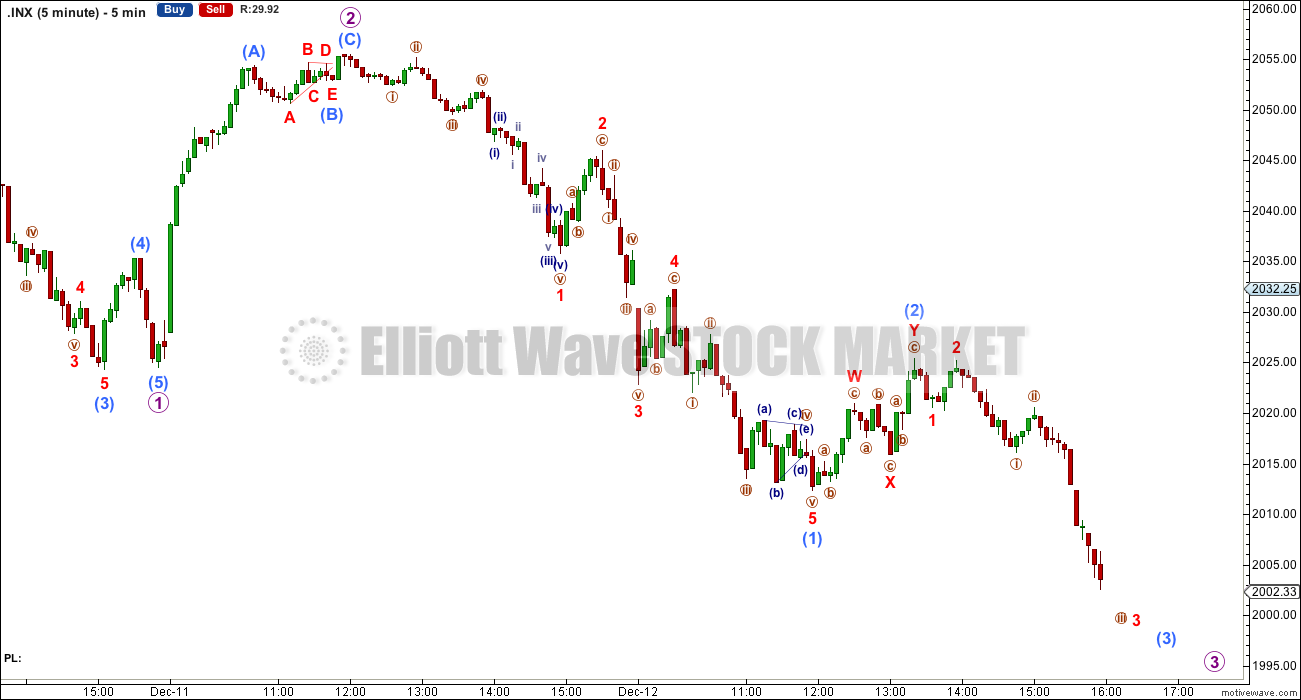
* Note: I have changed my degree of labelling on the hourly chart, but not on the five minute yet. I leave the five minute chart as it is below, with the subdivisions exactly the same.
Alternate Hourly Wave Count
To have confidence in a trend change at primary degree (or for the bear count at cycle degree) I now want to see the following things (probably in this order):
1. A clear five down on the daily chart.
2. A breach of the lower aqua blue trend line by a close of more than 3% of market value.
3. A new low below 1,820.66.
Following that it should be the structure which shows which wave count is correct: bull or bear.
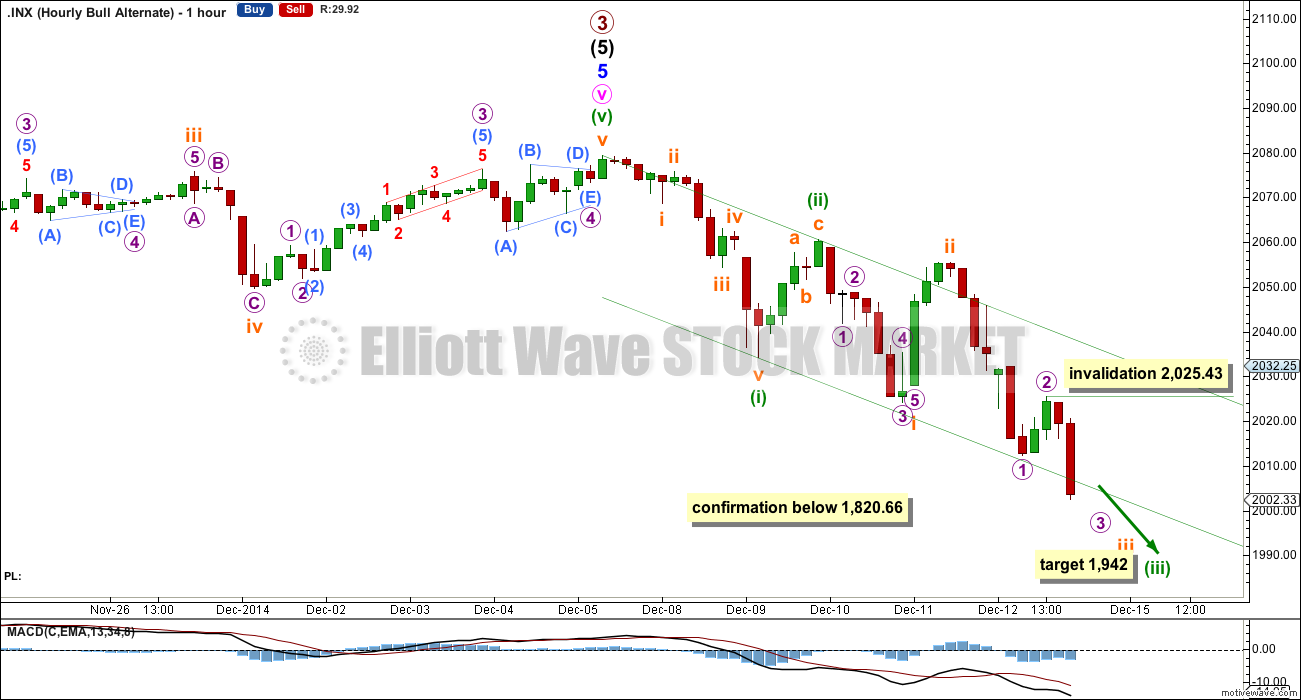
The degree of labelling and subdivisions within this downwards movement are exactly the same as the bullish main hourly wave count. We are seeing either a zigzag unfold downwards, or a new impulse unfold downwards. The target and invalidation point are the same.
In the next couple of weeks it should become clear which wave count is correct. Once this current impulse down (which is minuette wave (iii) on this bear wave count and minuette wave (c) on the main hourly wave count) is complete then the low of minuette wave (i) at 2,034.17 will differentiate the two wave counts. Movement above that point would invalidate an impulse downwards and confirm that downwards movement would be a complete zigzag correction, so the bull market would remain intact.
Bear Wave Count
This bear wave count differs from the bull wave count at the monthly chart level and at super cycle wave degree. To see the historic picture go here.
The subdivisions within primary waves A-B-C are seen in absolutely exactly the same way as primary waves 1-2-3 for the bull wave count.
At cycle degree wave b is over the maximum common length of 138% the length of cycle wave a, at 164% the length of cycle wave a. At 2,393 cycle wave b would be twice the length of cycle wave a and at that point this bear wave count should be discarded.
At this point in time it is again possible that the market has just turned and is beginning a big crash. This wave count would be confirmed if we see a clear breach of the lower maroon – – – channel on the weekly chart. If we see a full weekly candlestick below this trend line and not touching it then this bear wave count would be my main wave count. A new low below 1,370.58 would provide price confirmation of a market crash, but we should have confidence in this wave count well before that point by looking carefully at structure.
While we have no confirmation of this wave count we should assume the trend remains the same, upwards. This wave count requires confirmation before I have confidence in it.
This analysis is published about 05:11 p.m. EST.
Lara, why do you keep saying that the aqua trend needs to be broken with a one day >3% decline? That would equate to 60pts on the SP500.
“Technical Analysis of Stock Trends” by Edwards, Magee and Bassetti, ninth edition, page 262:
“a close beyond the line by a price margin of 3%”
And on page 266 it describes how to draw the double trend line.
I love this book. Its clear, simple and easy to read. I can see why it’s such a classic. If you don’t have a copy then purchasing one would be money well spent.