
I had expected more downwards movement first before the resumption of the upwards trend. This is not what happened, but price remains below the confirmation / invalidation point.
Summary: We should always assume the trend remains the same, until proven otherwise. The trend is your friend. At this stage I will assume that a small second wave correction may be over. This would be confirmed with a new high above 2,060.60 and a clear five up on the hourly chart. Alternatively, the second wave correction may continue sideways before the upwards trend resumes.
Click on charts to enlarge.
Bull Wave Count
I will favour neither the bull or bear wave count. Both are viable and both expect this current upwards impulse may again be complete.
To see a weekly chart with subdivisions and how to draw trend lines and channels click here.
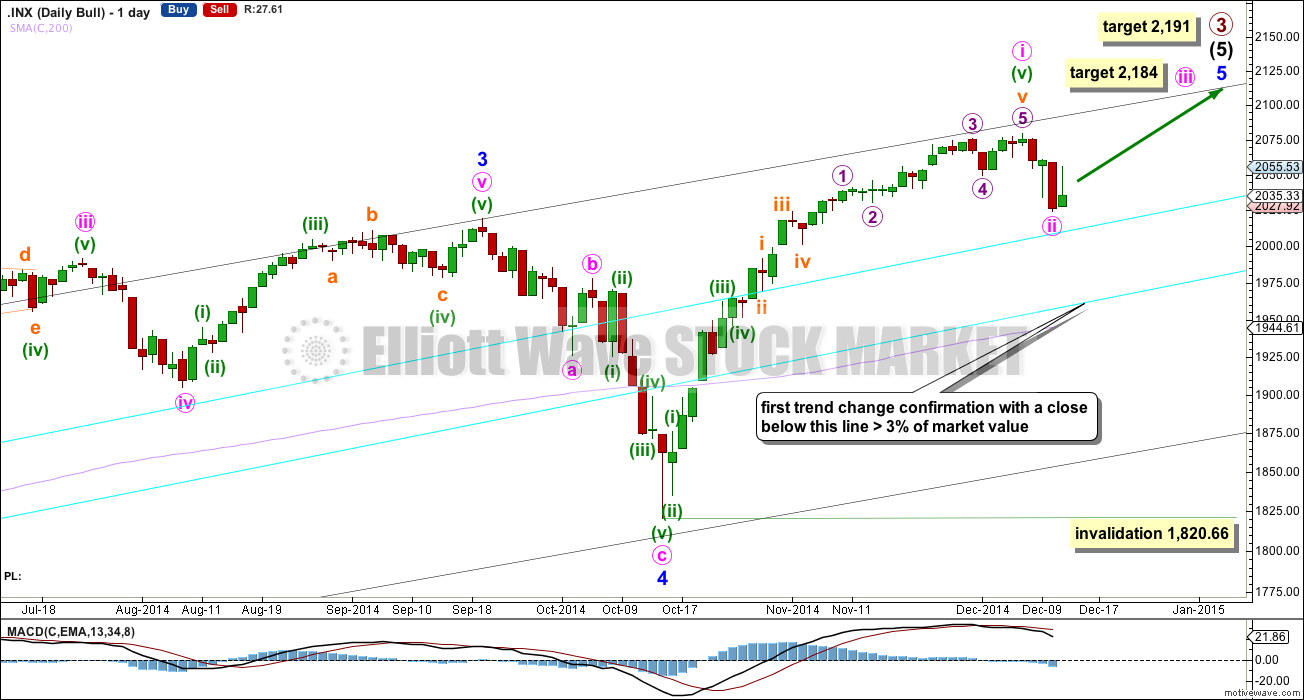
Upwards movement from the low at 666.79 subdivides as a complete 5-3-5. For the bull wave count this is seen as primary waves 1-2-3.
Within intermediate wave (5) minor wave 2 is an expanded flat and minor wave 4 is a zigzag. Minor wave 3 is 14.29 points longer than 1.618 the length of minor wave 1.
At intermediate degree there is also a very close relationship between intermediate waves (3) and (1): intermediate wave (3) is just 0.76 points less than 2.618 the length of intermediate wave (1).
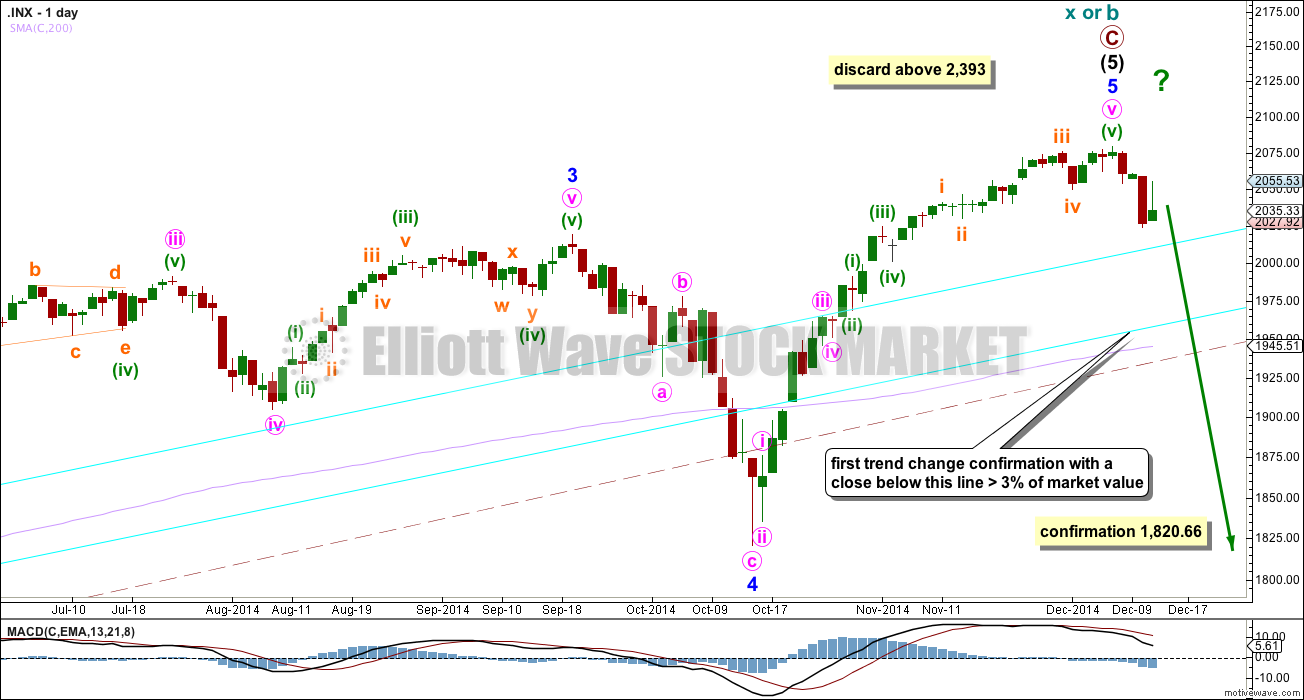
The aqua blue trend lines are traditional technical analysis trend lines. These lines are long held, repeatedly tested, and shallow enough to be highly technically significant. When the lower of these double trend lines is breached by a close of 3% or more of market value that should indicate a trend change. It does not indicate what degree the trend change should be though.
There is still triple technical divergence between MACD and price at the weekly chart level.
I would expect the final top to form a slow curving structure, like a double head and shoulders or a rounding top. At the high volume should be low. Once the high is in place the new downwards trend may begin with slow movement, and deep second wave corrections. These would form two right hand shoulders, or the right hand side of a rounding top. When the neckline is formed, and eventually broken I would not expect to see an increase in volume, but I would expect to see an increase in momentum.
Because we should assume the trend remains the same until proven otherwise, while price remains above both aqua blue trend lines I will assume this downwards movement is a smaller correction within the upwards trend. I have moved the degree of labelling within minor wave 5 all down one degree. This downwards movement may be a small second wave correction. Minute wave ii may find strong support at the upper aqua blue trend line, or maybe the lower trend line. These trend lines may force this second wave correction to be more shallow than otherwise. Minute wave ii may not move beyond the start of minute wave i below 1,820.66.
At 2,191 primary wave 3 would reach 1.618 the length of primary wave 1. This would expect that minor wave 5 is either an ending contracting diagonal (minute wave i would be seen as a zigzag, which is possible) or within minor wave 5 minute wave iii will be shorter than minute wave i, and minute wave v will be shorter still. Both these scenarios are possible. Or the target is wrong. At 2,184 minute wave iii would reach 0.618 the length of minute wave i.
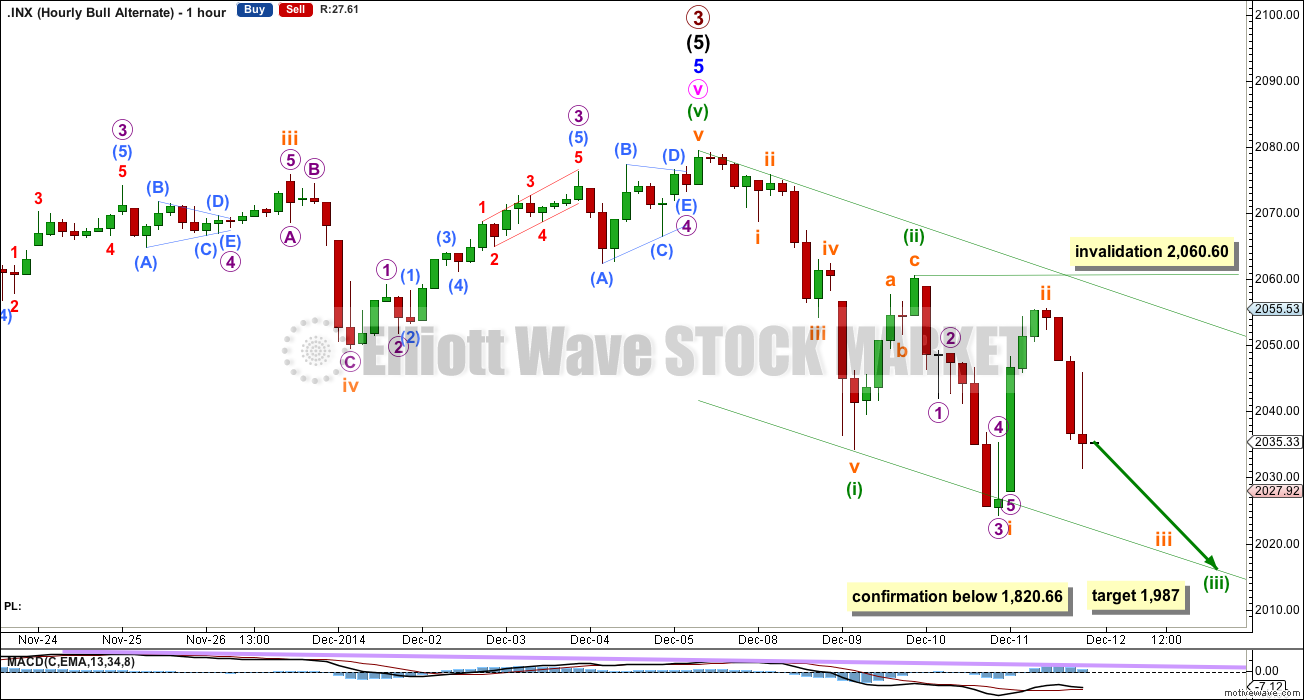
Main Hourly Wave Count
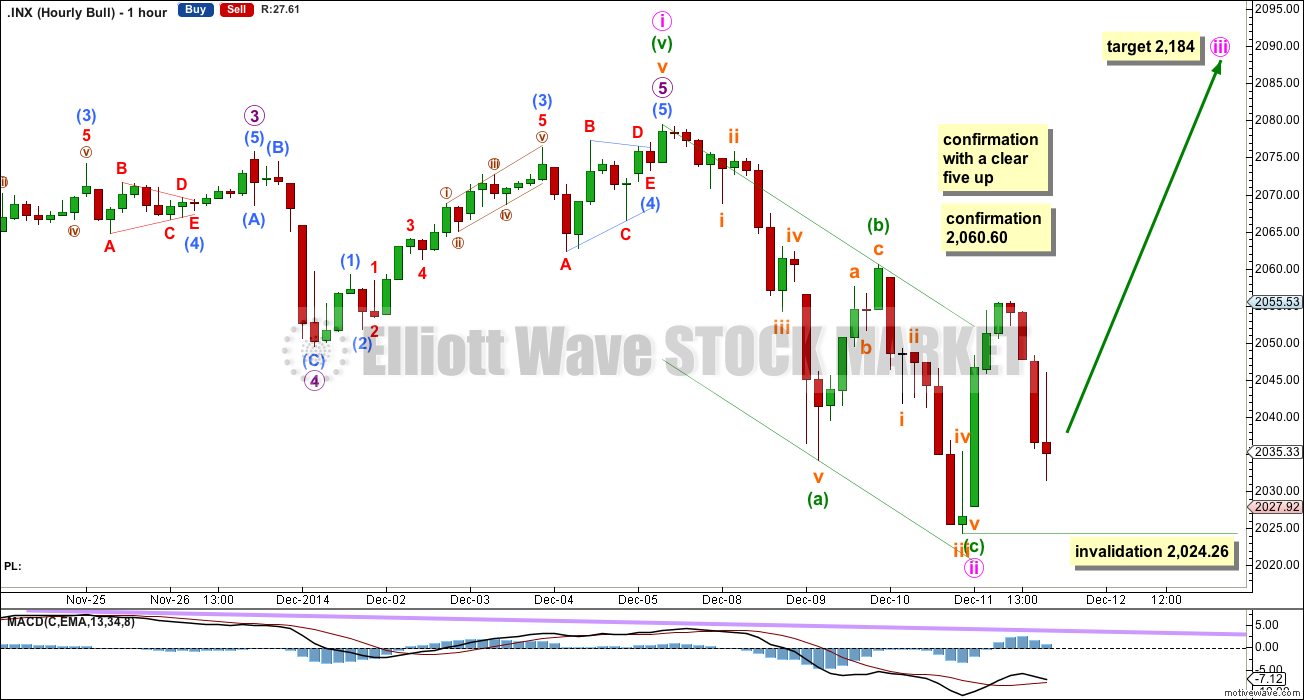
Minute wave ii may be a complete zigzag. The final fifth wave may have been truncated. There is no Fibonacci ratio between minuette waves (a) and (c).
A new high above 2,060.60 would invalidate the bearish alternate below and provide confidence that the upwards trend remains intact. A clear five up on the hourly chart would provide confidence that minute wave ii is over and minute wave iii is underway.
Within minute wave iii no second wave correction may move beyond the start of its first wave. I will leave the invalidation point at the price low of 2,024.26 to allow for the possibility that my analysis of the movement around this low is wrong.
Alternate Bullish Hourly Wave Count
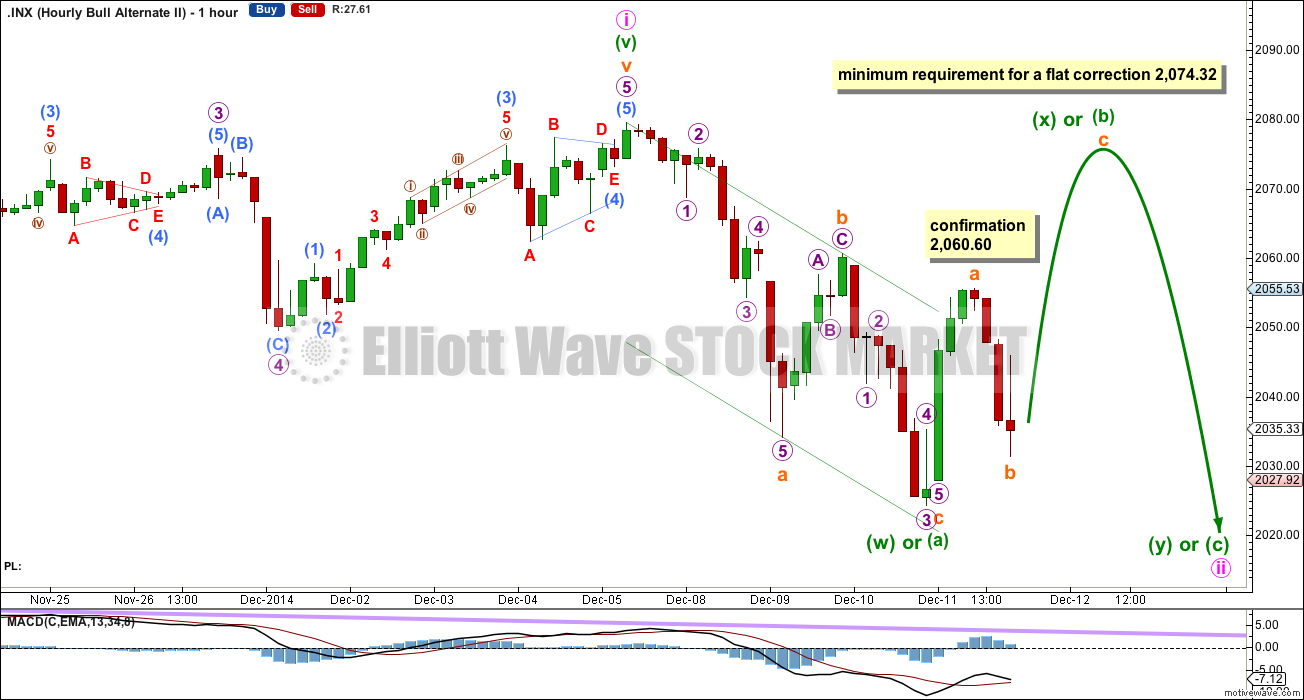
By simply moving the degree of labelling within minute wave ii down one degree, it is possible that it is not over. It may be continuing as an A-B-C flat correction, or a W-X-Y double zigzag or double combination.
If minute wave ii is not over then the next movement upwards should be a clear three wave structure. Only a five up would invalidate this alternate.
If minute wave ii is a flat correction then within it minuette wave (b) must subdivide as a three and it must reach a minimum 90% length of minuette wave (a) at 2,074.32. Minuette wave (b) may make a new high beyond the start of minuette wave (a) at 2,079.47 as in an expanded flat.
If minute wave ii is a double flat or double combination then minuette wave (x) upwards must subdivide as a three. It too may make a new high beyond the start of minuette wave (w) at 2,079.47.
This alternate expects to see more sideways movement to complete minute wave ii for a few more days, or downwards movement if it is a double zigzag for a few more days.
A new low tomorrow would not invalidate this alternate, because subminuette wave b may move beyond the start of subminuette wave a as in an expanded flat correction.
Alternate Hourly Wave Count
To have confidence in a trend change at primary degree (or for the bear count at cycle degree) I now want to see the following things (probably in this order):
1. A clear five down on the daily chart.
2. A breach of the lower aqua blue trend line by a close of more than 3% of market value.
3. A new low below 1,820.66.
Following that it should be the structure which shows which wave count is correct: bull or bear.
So far there may be two overlapping first and second waves downwards. This indicates a strong increase in downwards momentum should happen in the next 24 hours.
At 1,987 minuette wave (iii) would reach 1.618 the length of minuette wave (i).
Any movement below 1,820.66 would confirm the end of primary wave 3 (for the bull count) or cycle wave b (for the bear wave count).
Bear Wave Count
This bear wave count differs from the bull wave count at the monthly chart level and at super cycle wave degree. To see the historic picture go here.
The subdivisions within primary waves A-B-C are seen in absolutely exactly the same way as primary waves 1-2-3 for the bull wave count.
At cycle degree wave b is over the maximum common length of 138% the length of cycle wave a, at 164% the length of cycle wave a. At 2,393 cycle wave b would be twice the length of cycle wave a and at that point this bear wave count should be discarded.
At this point in time it is again possible that the market has just turned and is beginning a big crash. This wave count would be confirmed if we see a clear breach of the lower maroon – – – channel on the weekly chart. If we see a full weekly candlestick below this trend line and not touching it then this bear wave count would be my main wave count. A new low below 1,370.58 would provide price confirmation of a market crash, but we should have confidence in this wave count well before that point by looking carefully at structure.
While we have no confirmation of this wave count we should assume the trend remains the same, upwards. This wave count requires confirmation before I have confidence in it.
This analysis is published about 09:39 p.m. EST.
Lara
Hi
Is the alternate (bear to 1987-1820) confirmed below 2024 ?
No.
It is confirmed below 1,820.66. That is not a target, its a confirmation point.
But the bull wave count has a big trend change confirmed also below 1,820.66. Below this price point we know that the trend change would be substantial; either primary degree for the bull count or cycle degree for the bear count.
To see the difference between the two counts look at the historic analysis.
Hi Lara
Could we not just have had an expanding leading diagonal in wave 1?
Which wave 1 and which time frame please? Otherwise I’m totally guessing at what you mean…