
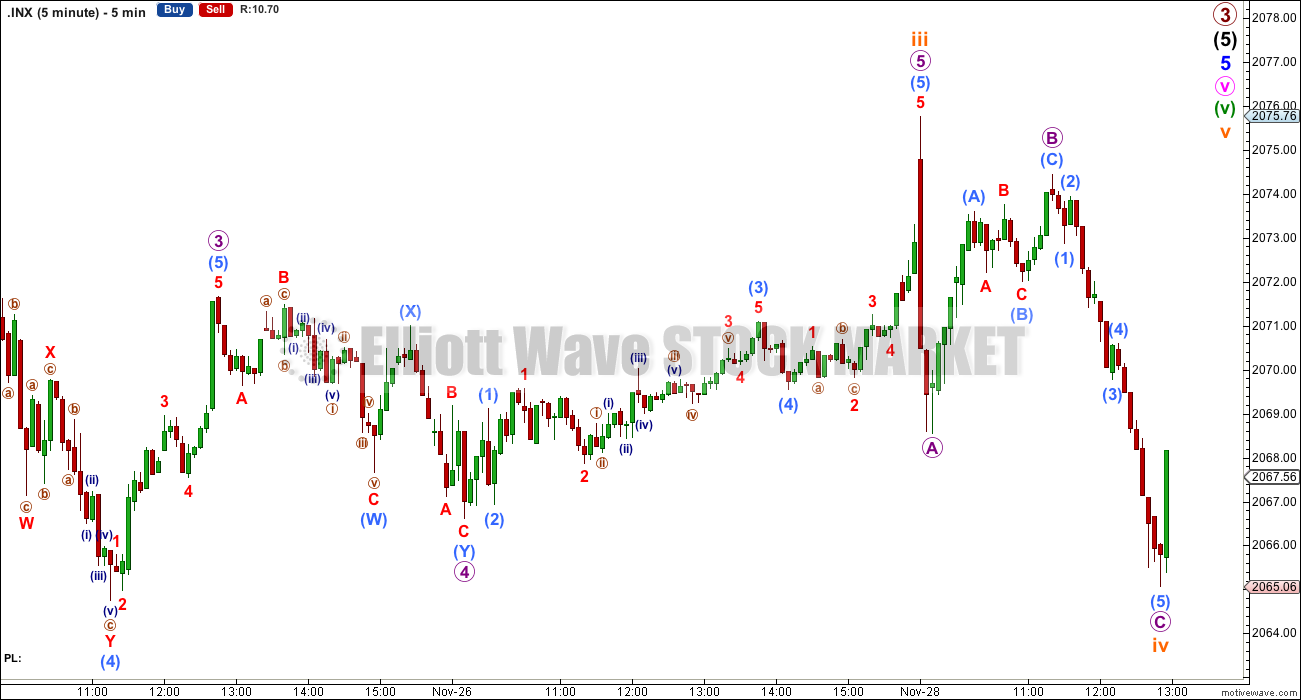
Upwards movement was expected to a short term target at 2,077. Price did begin Friday’s session with upwards movement to a new high, but fell 1.24 points short of the target. Thereafter, it turned lower for a small fourth wave correction which was expected.
Summary: One final small fifth wave is now all that is required to complete this structure at primary (bull count) or cycle degree (bear count). The target is at 2,079.
Click on charts to enlarge.
Bull Wave Count
I will favour neither the bull or bear wave count. Both are viable and both expect this current upwards impulse may again be close to completion.
To see a weekly chart with subdivisions and how to draw trend lines and channels click here.
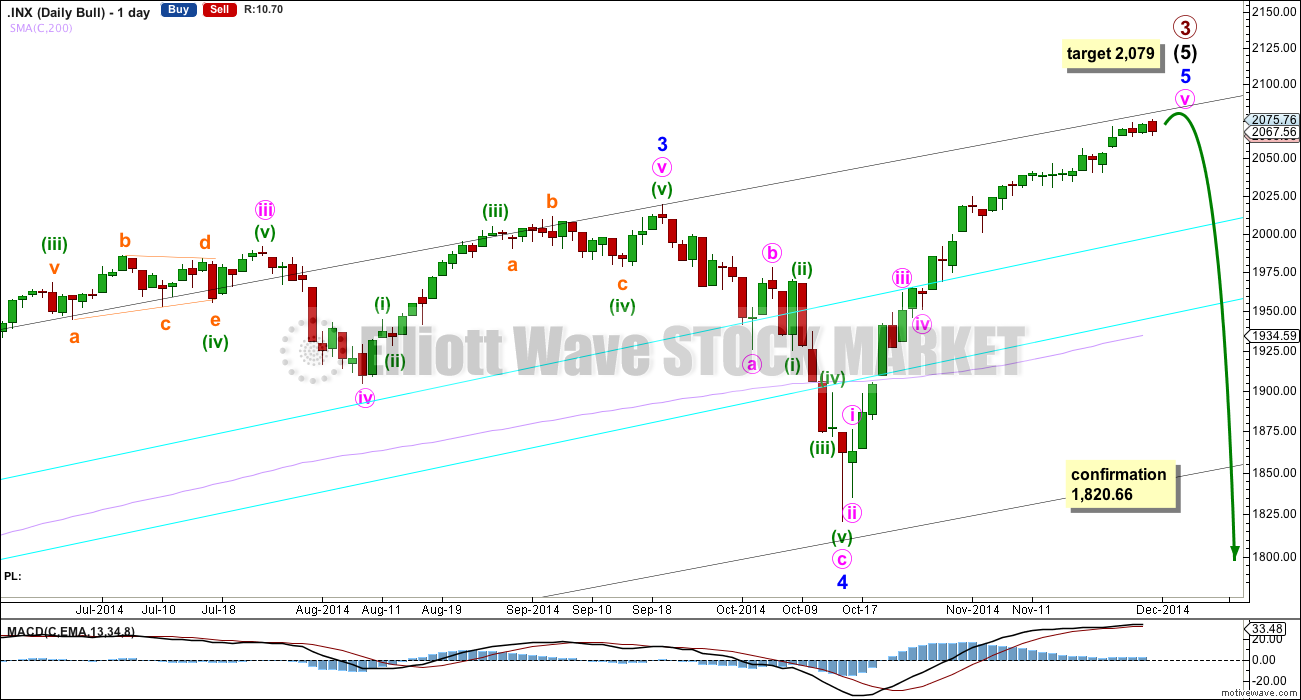
Upwards movement from the low at 666.79 subdivides as an almost complete 5-3-5. For the bull wave count this is seen as primary waves 1-2-3.
Within intermediate wave (5) minor wave 2 is an expanded flat and minor wave 4 is a zigzag. Minor wave 3 is 14.29 points longer than 1.618 the length of minor wave 1.
At intermediate degree there is also a very close relationship between intermediate waves (3) and (1): intermediate wave (3) is just 0.76 points less than 2.618 the length of intermediate wave (1).
The aqua blue trend lines are traditional technical analysis trend lines. These lines are long held, repeatedly tested, and shallow enough to be highly technically significant. When the lower of these double trend lines is breached by a close of 3% or more of market value that should indicate a trend change. It does not indicate what degree the trend change should be though.
There is triple technical divergence between MACD and price at the weekly chart level.
There is now a slight technical divergence between price and MACD at the daily chart level for the last several days.
I would expect the final top to form a slow curving structure, like a double head and shoulders or a rounding top. At the high volume should be low. Once the high is in place the new downwards trend may begin with slow movement, and deep second wave corrections. These would form two right hand shoulders, or the right hand side of a rounding top. When the neckline is formed, and eventually broken I would not expect to see an increase in volume, but I would expect to see an increase in momentum.
Movement below 1,820.66 could not be a second wave correction within minor wave 5, and so at that stage the final fifth wave would have to be over. A trend change at primary (bull count) or cycle degree (bear count) would be confirmed.
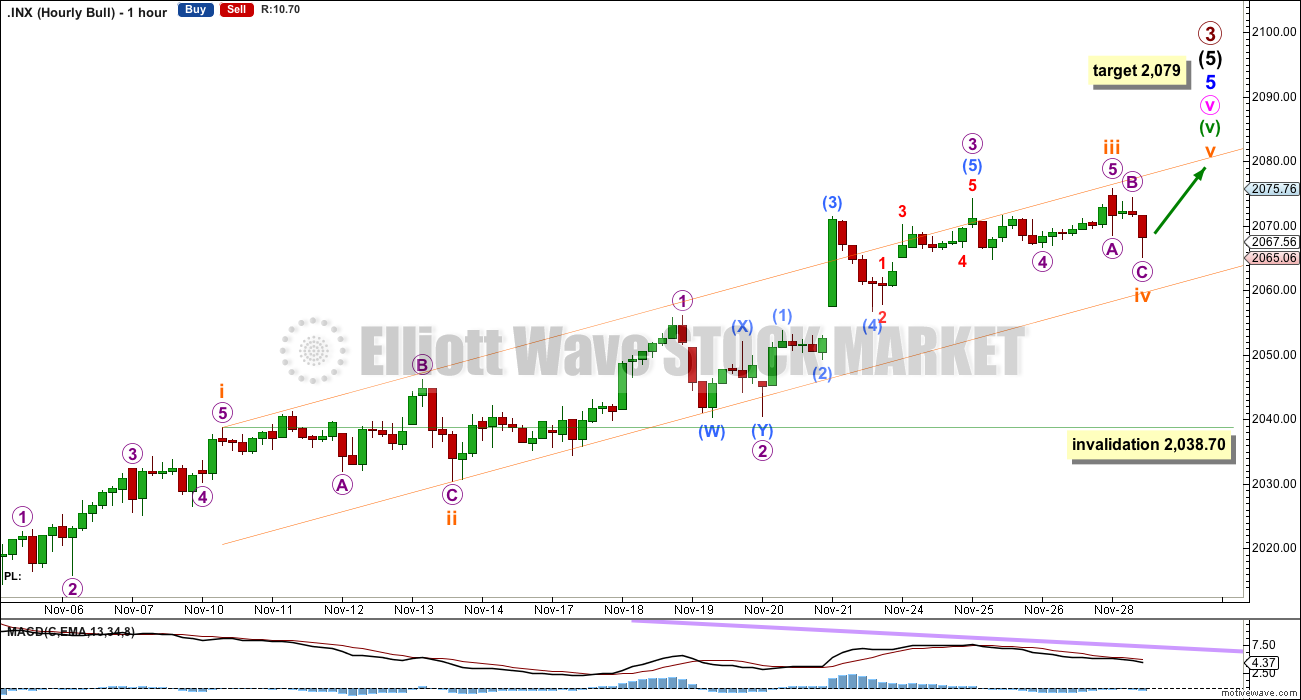
This hourly chart focusses only on the end of this upwards movement within minute wave v. Within minute wave v there is no Fibonacci ratio between minuette waves (i) and (iii) (now off to the left of this chart) and so I would expect to see a Fibonacci ratio between minuette wave (v) and either (iii) or (i). Minuette wave (v) is a long extension: it has passed equality with minuette (i); it has passed equality with minuette (iii); and it has passed 1.618 the length of minuette wave (i). The next target to calculate is 1.618 the length of minuette wave (iii) at 2,079.
Within the long extension of minuette wave (v) subminuette wave iii has no Fibonacci ratio to subminuette wave i. I will expect to see a Fibonacci ratio for subminuette wave v to either of subminuette waves iii or i. At 2,079 subminuette wave v would reach 0.382 the length of subminuette wave i.
The target at 2,079 is now calculated at two wave degrees and so it has a higher probability.
Ratios within subminuette wave iii are: there is no Fibonacci ratio between micro waves 3 and 1, and micro wave 5 is just 0.02 longer than 0.382 the length of micro wave 1. We may be just about to see the same Fibonacci ratio exhibited one degree higher between subminuette waves v and i.
Now that subminuette wave iii is complete draw a channel about it using Elliott’s first technique: draw the first trend line from the highs labelled subminuette waves i to iii, then place a parallel copy on the low labelled subminuette wave ii. If subminuette wave iv continues further (as it may) then it should find support at the lower edge of this channel.
Subminuette wave iv may not move into subminuette wave i price territory below 2,038.70.
Bear Wave Count
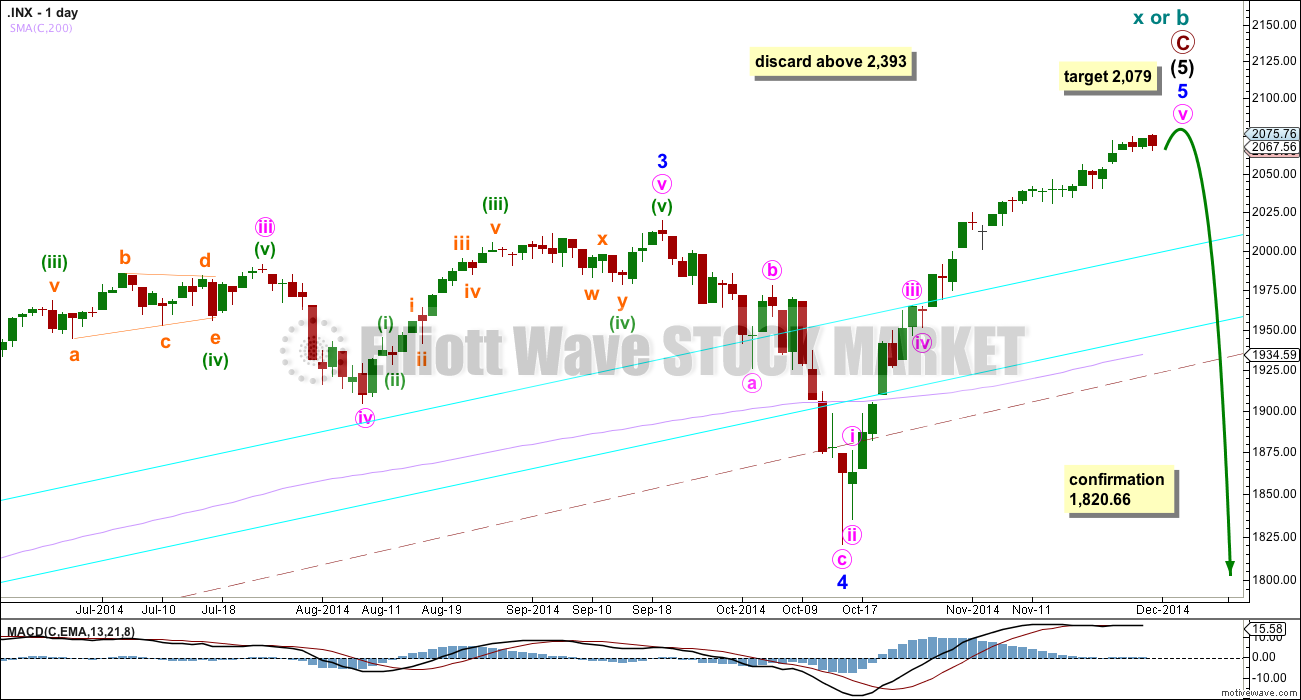
This bear wave count differs from the bull wave count at the monthly chart level and at super cycle wave degree. To see the historic picture go here.
The subdivisions within primary waves A-B-C are seen in absolutely exactly the same way as primary waves 1-2-3 for the bull wave count.
For both wave counts when minor wave 5 may be a complete structure on the hourly and five minute charts, I have an alternate wave count which moves the degree of labelling within it all down one degree. A completion of a five wave impulse up within minor wave 5 may be either minor wave 5 in its entirety, or it may only be minute wave i within minor wave 5.
At cycle degree wave b is over the maximum common length of 138% the length of cycle wave a, at 161% the length of cycle wave a. At 2,393 cycle wave b would be twice the length of cycle wave a and at that point this bear wave count should be discarded.
This analysis is published about 04:03 p.m. EST.