
Upwards movement continues as expected with a new high, and the main hourly Elliott wave count had expected it was possible we could see another one to three red candlesticks on up to the target.
Summary: The structure is still incomplete. I expect price to keep rising. The next likely target is at 2,079. We may see a small red candlestick for the completion of a small fourth wave correction tomorrow. The invalidation point is at 2,056.06.
Click on charts to enlarge.
Bull Wave Count
I will favour neither the bull or bear wave count. Both are viable and both expect this current upwards impulse may again be close to completion.
To see a weekly chart with subdivisions and how to draw trend lines and channels click here.
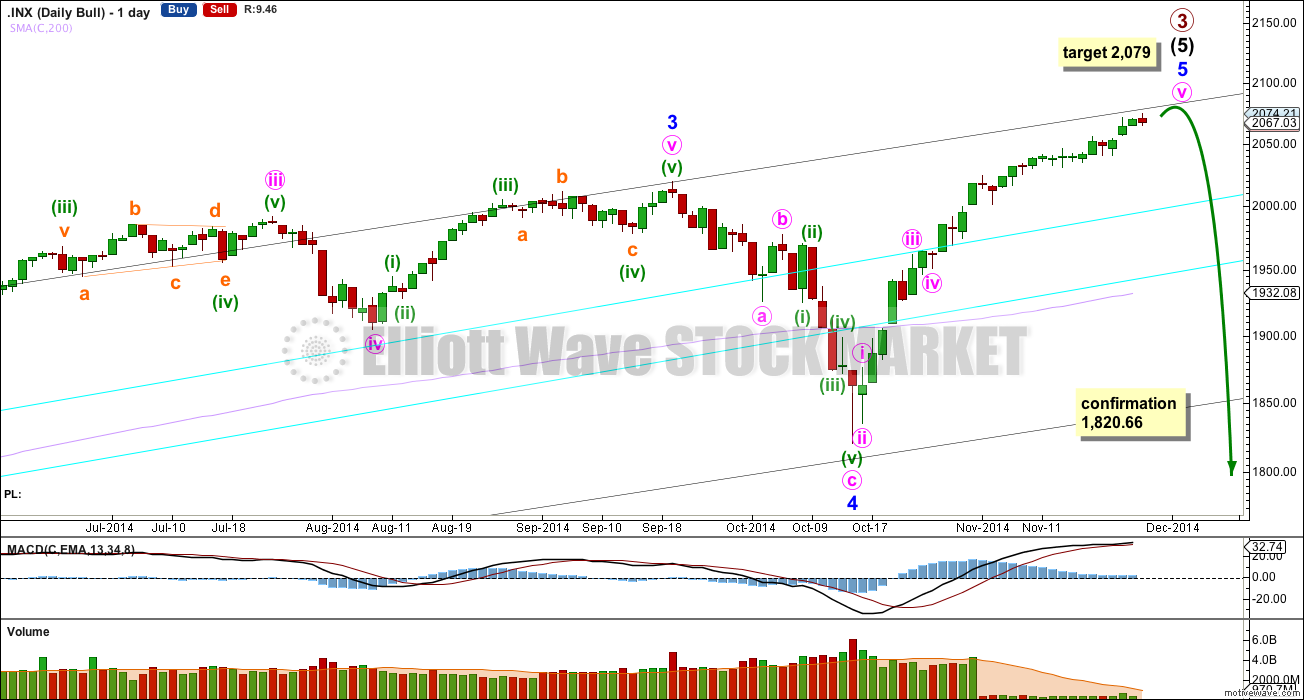
Upwards movement from the low at 666.79 subdivides as an almost complete 5-3-5. For the bull wave count this is seen as primary waves 1-2-3.
Within intermediate wave (5) minor wave 2 is an expanded flat and minor wave 4 is a zigzag. Minor wave 3 is 14.29 points longer than 1.618 the length of minor wave 1.
At intermediate degree there is also a very close relationship between intermediate waves (3) and (1): intermediate wave (3) is just 0.76 points less than 2.618 the length of intermediate wave (1).
The aqua blue trend lines are traditional technical analysis trend lines. These lines are long held, repeatedly tested, and shallow enough to be highly technically significant. When the lower of these double trend lines is breached by a close of 3% or more of market value that should indicate a trend change. It does not indicate what degree the trend change should be though.
There is triple technical divergence between MACD and price at the weekly chart level.
There is now no longer technical divergence between price and MACD at the daily chart level.
I would expect the final top to form a slow curving structure, like a double head and shoulders or a rounding top. At the high volume should be low, although at this stage I do not trust the volume data from this google / yahoo data feed is accurate. Once the high is in place the new downwards trend may begin with slow movement, and deep second wave corrections. These would form two right hand shoulders, or the right hand side of a rounding top. When the neckline is formed, and eventually broken I would not expect to see an increase in volume, but I would expect to see an increase in momentum.
Movement below 1,820.66 could not be a second wave correction within minor wave 5, and so at that stage the final fifth wave would have to be over. A trend change at primary (bull count) or cycle degree (bear count) would be confirmed.
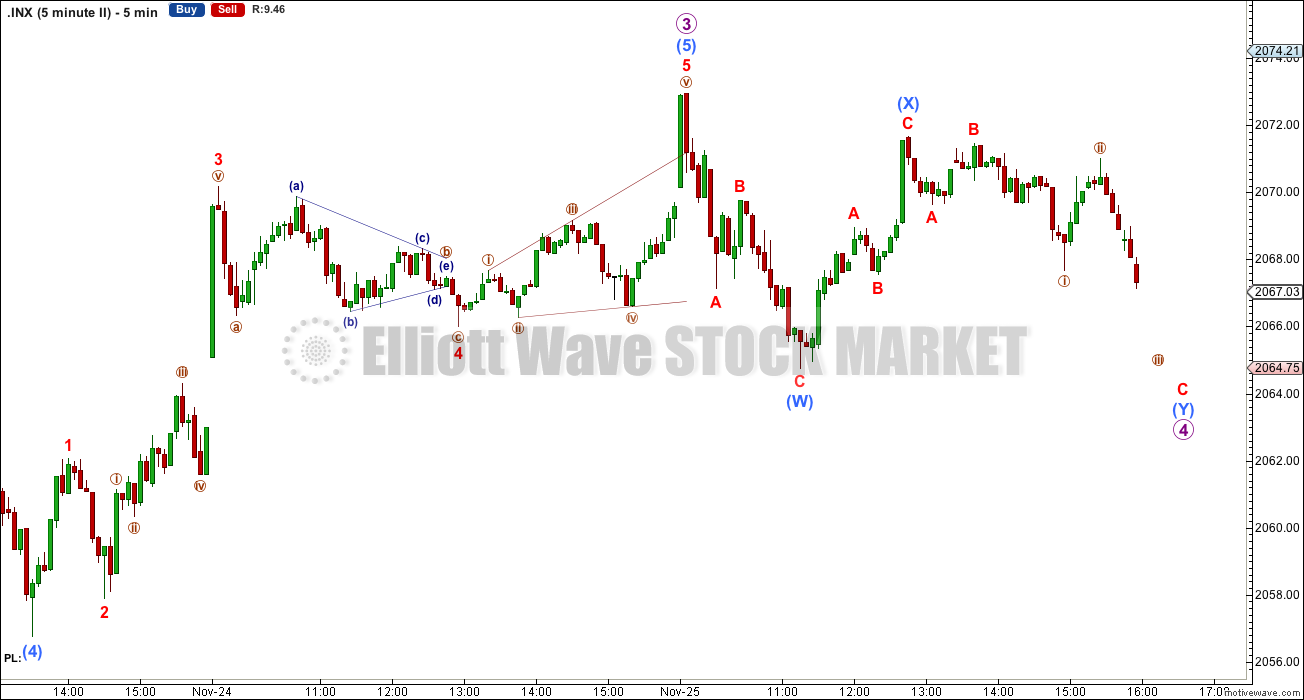
I am aware that there is more than one way to label this upwards wave of minor wave 5. At this stage all of the various options I see expect this structure is very close to completion. Because the alternate wave count yesterday has the same target and still requires upwards movement, I will revert to publishing only one wave count for minor wave 5. I don’t see that presenting alternates with the same target and direction adds enough to the analysis to warrant the time spent on them.
This labelling fits all subdivisions on the five minute chart. Minute wave ii is a deep zigzag, minute wave iii is just 0.38 points longer than 2.618 the length of minute wave i and it contains the strongest upwards momentum. Minute wave iv is a running contracting triangle, so there is perfect alternation between minute waves ii and iv. Mostly for this reason I prefer this labelling.
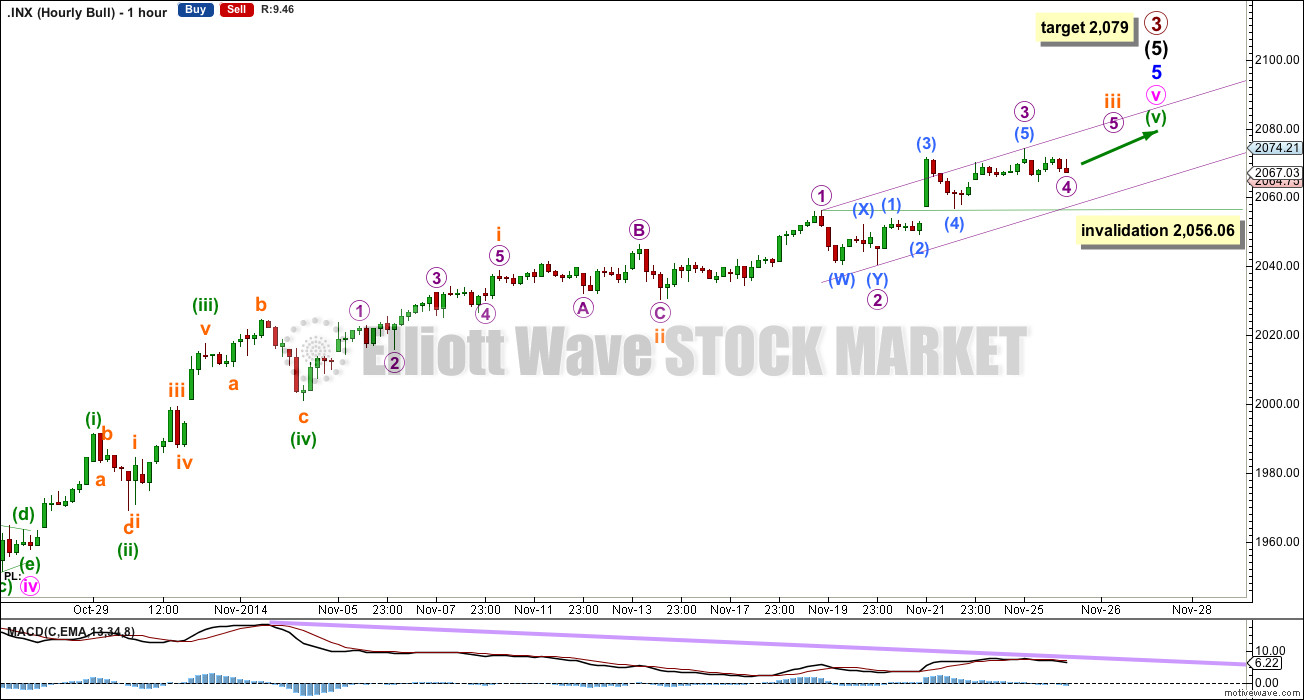
Because there is already a close Fibonacci ratio between first and third waves at minute, minor and intermediate degree, the target is best calculated at minuette wave degree. There is no Fibonacci ratio between minuette waves (i) and (iii). At 2,079 minuette wave (v) would reach 1.618 the length of minuette wave (iii).
Minute wave v is extending. Within it, minuette wave (v) is extending. There is one more small fourth wave correction to come for subminuette wave iv which may show up on the daily chart as one or more red candlesticks.
Within subminuette wave iii I have adjusted the wave count slightly. Micro wave 4 may not move into micro wave 1 price territory below 2,056.06.
I have drawn a channel about subminuette wave iii: draw the first trend line from the high labelled micro wave 1 to the high labelled micro wave 3, then place a parallel copy on the low labelled micro wave 2. Expect micro wave 4 to move a little lower, and it should find strong support at the lower edge of this channel (if it gets that low).
We may see another red candlestick for tomorrow’s session. When micro wave 4 is over then upwards movement towards the target should resume.
Divergence between MACD and price persists strongly at the hourly chart level. This supports the target and the idea that upwards movement is close to complete.
Bear Wave Count
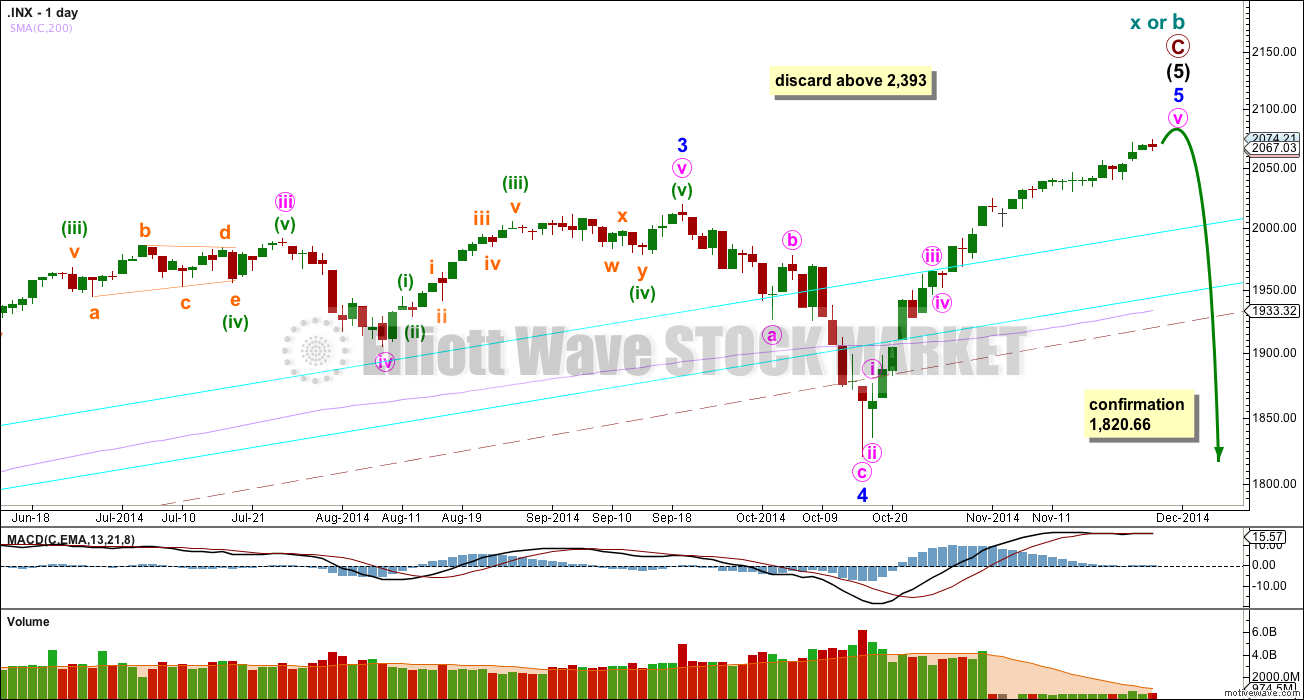
This bear wave count differs from the bull wave count at the monthly chart level and at super cycle wave degree. To see the historic picture go here.
The subdivisions within primary waves A-B-C are seen in absolutely exactly the same way as primary waves 1-2-3 for the bull wave count.
For both wave counts now that minor wave 5 may be a complete structure on the hourly and five minute charts, I have an alternate wave count which moves the degree of labelling within it all down one degree. A completion of a five wave impulse up within minor wave 5 may be either minor wave 5 in its entirety, or it may only be minute wave i within minor wave 5.
At cycle degree wave b is over the maximum common length of 138% the length of cycle wave a, at 161% the length of cycle wave a. At 2,393 cycle wave b would be twice the length of cycle wave a and at that point this bear wave count should be discarded.
This analysis is published about 08:48 p.m. EST.
Hi Lara, what do you think of this wave count? Is it possible? Probable? Thank you for your answer.
That looks pretty good. My only slight cause for concern would be the length of (b) to (a) within that fourth wave triangle, it is 3.1X the length of (a). Thats longer than 2X so it has a low probability.