
Upwards movement continues as expected.
Summary: The structure is still incomplete. I expect price to keep rising. The next likely target is at 2,079.
Click on charts to enlarge.
Bull Wave Count
I will favour neither the bull or bear wave count. Both are viable and both expect this current upwards impulse may again be close to completion.
To see a weekly chart with subdivisions and how to draw trend lines and channels click here.
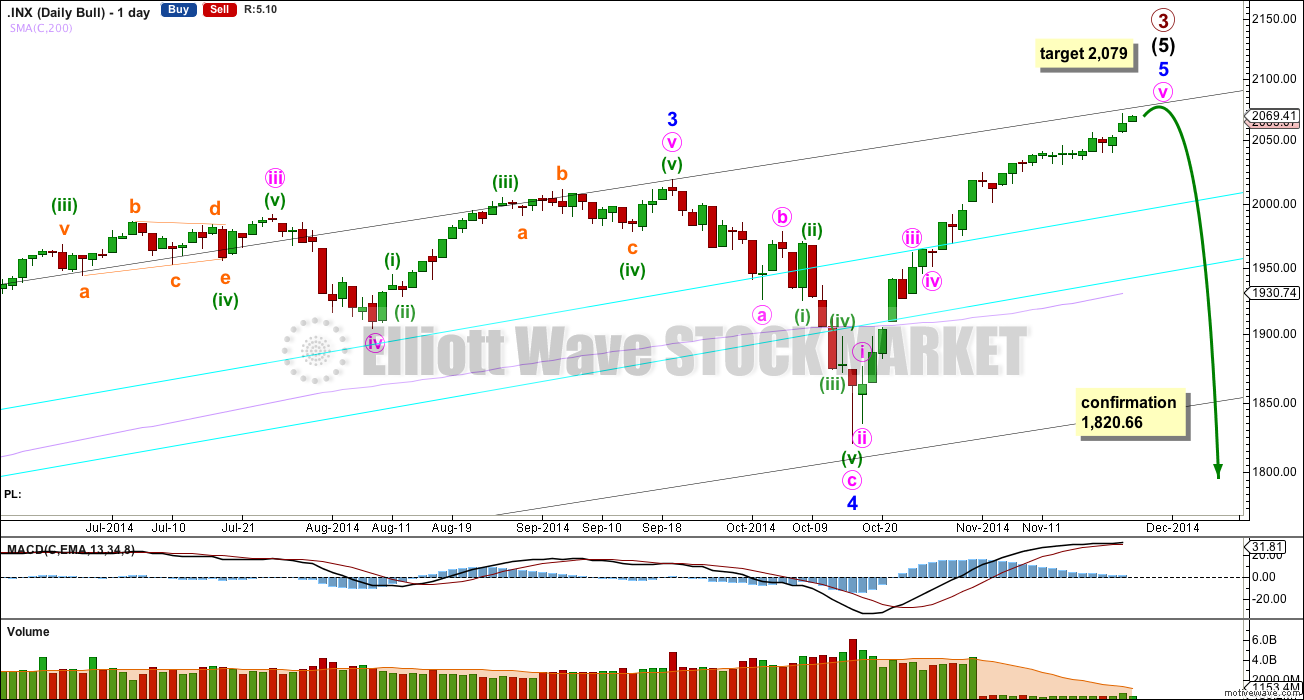
Upwards movement from the low at 666.79 subdivides as an almost complete 5-3-5. For the bull wave count this is seen as primary waves 1-2-3.
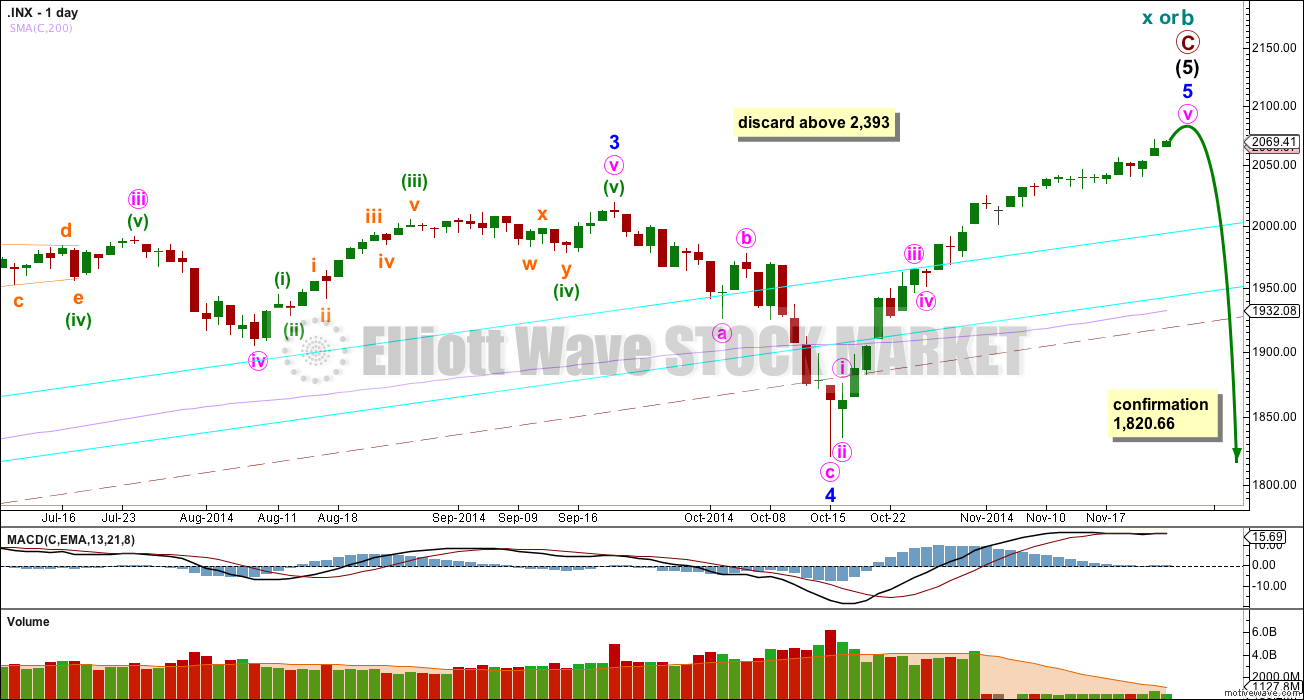
Within intermediate wave (5) minor wave 2 is an expanded flat and minor wave 4 is a zigzag. Minor wave 3 is 14.29 points longer than 1.618 the length of minor wave 1.
At intermediate degree there is also a very close relationship between intermediate waves (3) and (1): intermediate wave (3) is just 0.76 points less than 2.618 the length of intermediate wave (1).
The aqua blue trend lines are traditional technical analysis trend lines. These lines are long held, repeatedly tested, and shallow enough to be highly technically significant. When the lower of these double trend lines is breached by a close of 3% or more of market value that should indicate a trend change. It does not indicate what degree the trend change should be though.
There is triple technical divergence between MACD and price at the weekly chart level.
There is now no longer technical divergence between price and MACD at the daily chart level.
I would expect the final top to form a slow curving structure, like a double head and shoulders or a rounding top. At the high volume should be low, although at this stage I do not trust the volume data from this google / yahoo data feed is accurate. Once the high is in place the new downwards trend may begin with slow movement, and deep second wave corrections. These would form two right hand shoulders, or the right hand side of a rounding top. When the neckline is formed, and eventually broken I would not expect to see an increase in volume, but I would expect to see an increase in momentum.
Movement below 1,820.66 could not be a second wave correction within minor wave 5, and so at that stage the final fifth wave would have to be over. A trend change at primary (bull count) or cycle degree (bear count) would be confirmed.
Main Hourly Wave Count
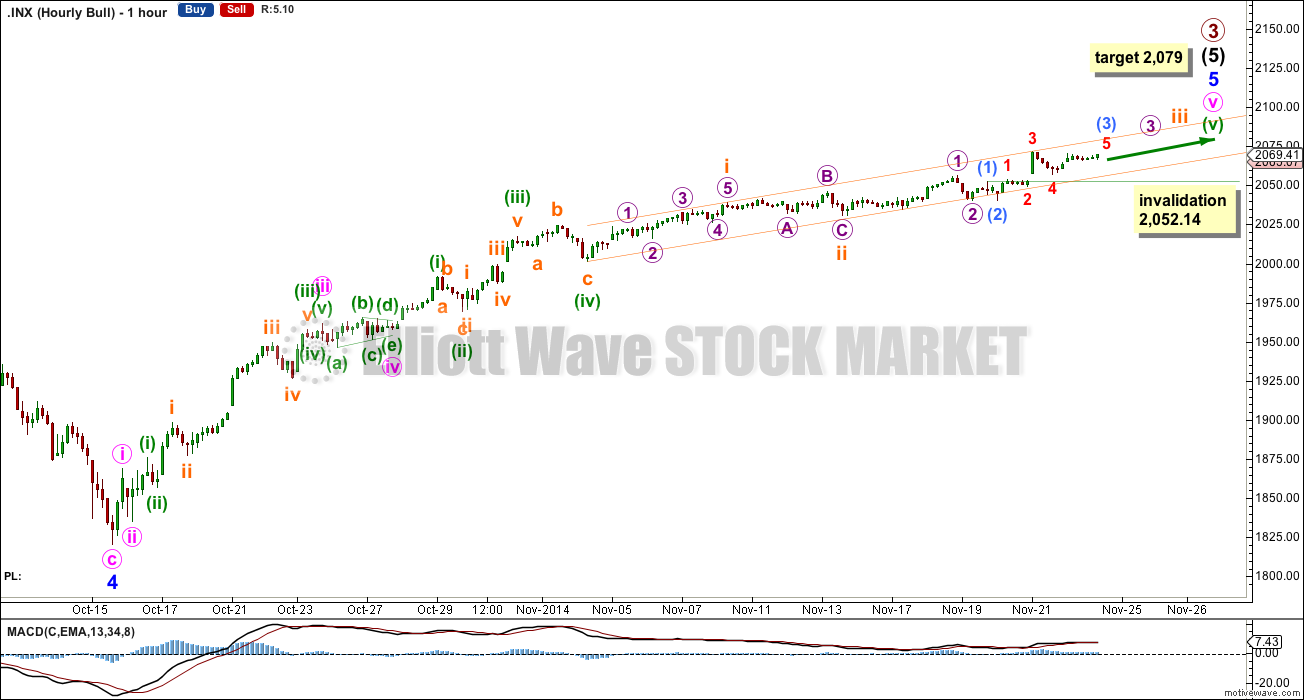
Within minor wave 5 minute wave iii is just 0.38 points longer than 2.618 the length of minute wave i and includes the strongest upwards momentum so far. Minute wave ii is a deep zigzag and minute wave iv is a shallow running contracting triangle. I am confident that this part of the wave count is correct, or at least the labelling of minute waves iii and iv here have the best fit.
Minute wave v begins at 1,957.79 as labelled.
Within minute wave v so far there is no Fibonacci ratio between minuette waves (i) and (iii). This makes it more likely we shall see a Fibonacci ratio between minuette wave (v) and either of (i) or (iii). Minuette wave (v) is unfolding as a long complicated extension.
Minuette wave (v) has now passed equality with minuette wave (i), equality with minuette wave (iii) and now 1.618 the length of minuette wave (i). The next likely relationship for it may be at 2,079 where it reaches 1.618 the length of minuette wave (iii). However, at this stage it is looking like this target may again be too low, and may not allow enough room for the rest of this structure to unfold. When subminuette waves iii and iv within this extending fifth wave are complete I can add to the target calculation at a second wave degree, so towards the end it may widen to a small zone or it may change. If it changes it will probably move higher.
Within minuette wave (v) subminuette wave iii is incomplete, and may not exhibit a Fibonacci ratio to subminuette wave i. The strongest upwards middle of this third wave passed as expected on Friday.
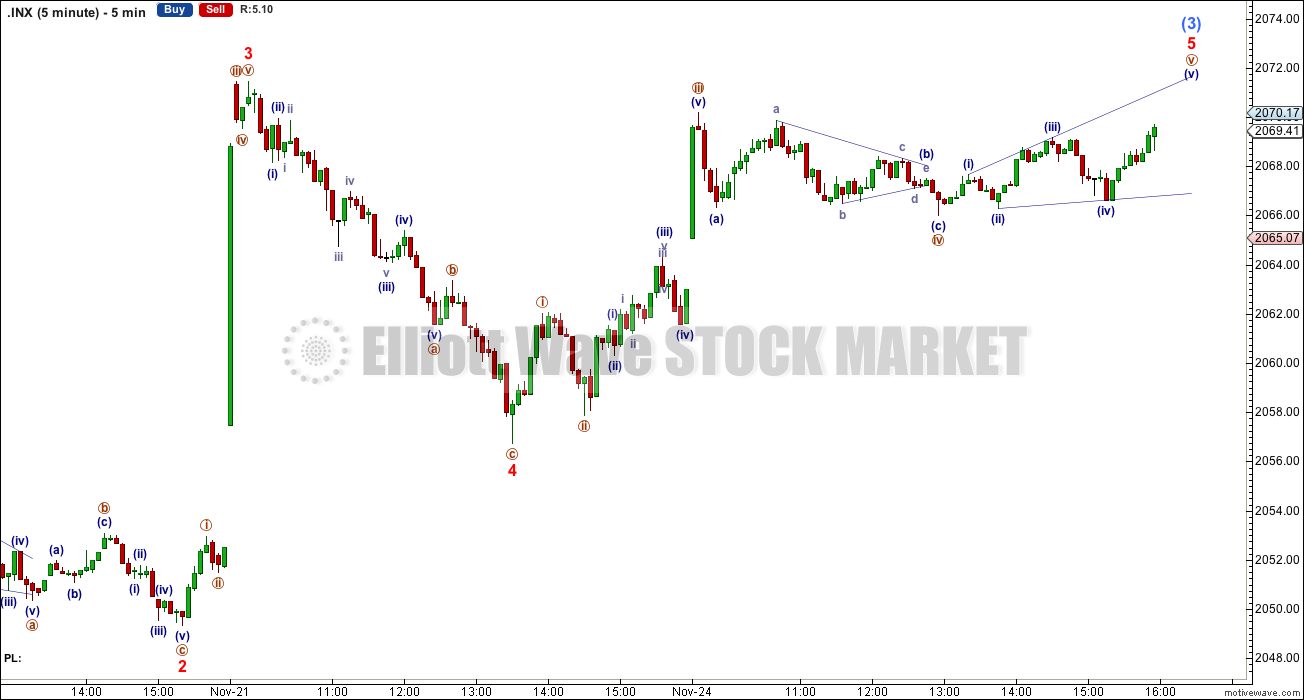
On the five minute chart it still looks like sub micro wave (3) is incomplete. When it is done then sub micro wave (4) may not move into sub micro wave (1) price territory below 2,052.14.
Overall I expect a continuation of upwards movement towards the final target. We may still see the odd down day or two, but price may continue to find support and resistance about the best fit channel drawn here.
Micro wave 4 and subminuette wave iv may unfold as red candlesticks on the daily chart.
Alternate Hourly Wave Count
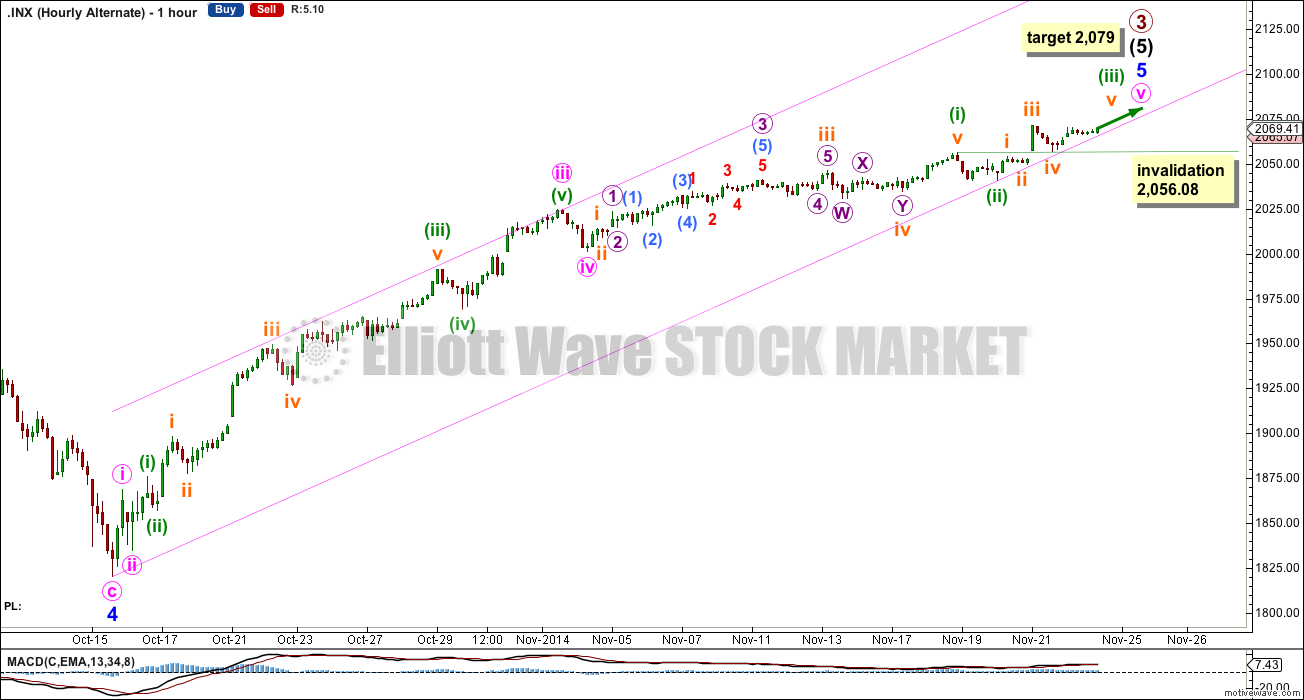
This alternate sees minute waves iii and iv in different places. Here minute wave iii has no Fibonacci ratio to minute wave i. There is no alternation in structure between minute waves ii and iv, but minute wave ii is deep while minute wave iv is shallow.
At 2,079 minute wave v would reach 1.618 the length of minute wave i.
This wave count differs little from the main wave count, but it may expect to see a quicker end to upwards movement.
The channel here is a best fit. It may continue to show where corrections find support on the way up.
Minuette wave (iv) may not move into minuette wave (i) price territory below 2,056.08.
Bear Wave Count
This bear wave count differs from the bull wave count at the monthly chart level and at super cycle wave degree. To see the historic picture go here.
The subdivisions within primary waves A-B-C are seen in absolutely exactly the same way as primary waves 1-2-3 for the bull wave count.
For both wave counts now that minor wave 5 may be a complete structure on the hourly and five minute charts, I have an alternate wave count which moves the degree of labelling within it all down one degree. A completion of a five wave impulse up within minor wave 5 may be either minor wave 5 in its entirety, or it may only be minute wave i within minor wave 5.
At cycle degree wave b is over the maximum common length of 138% the length of cycle wave a, at 161% the length of cycle wave a. At 2,393 cycle wave b would be twice the length of cycle wave a and at that point this bear wave count should be discarded.
This analysis is published about 08:43 p.m. EST.
Hi Lara, what do you think of this wave count? Is it possible? I’m hoping, I should say praying for the market to go down soon. I shorted the S&P 500 using ES futures at 2,040 a few weeks ago and now I´m in the house of pain. Thank you for your answer.
Ah… the house of pain. Not good.
It looks like a pretty good wave count. Is that from Daneric? If so you may trust it, he knows what he’s doing.
My only point would be the noting of the gaps; many of them look like breakaway or runaway gaps, and so we should not expect them to be “closed” soon. They may be closed at some stage, but not all gaps must be closed quickly.
The runaway gaps can be used for measurement.