
Downwards movement was expected, but both hourly Elliott wave counts were invalidated with movement above 1,991.40.
Summary: The upwards structure is again incomplete. The target for more upwards movement to end is 2,012. If we see a new high above 2,019.26 the main bear wave count will be invalidated and the alternate confirmed. The bull wave count would remain the same as it allows for a new high.
Click on charts to enlarge.
Bearish Wave Count
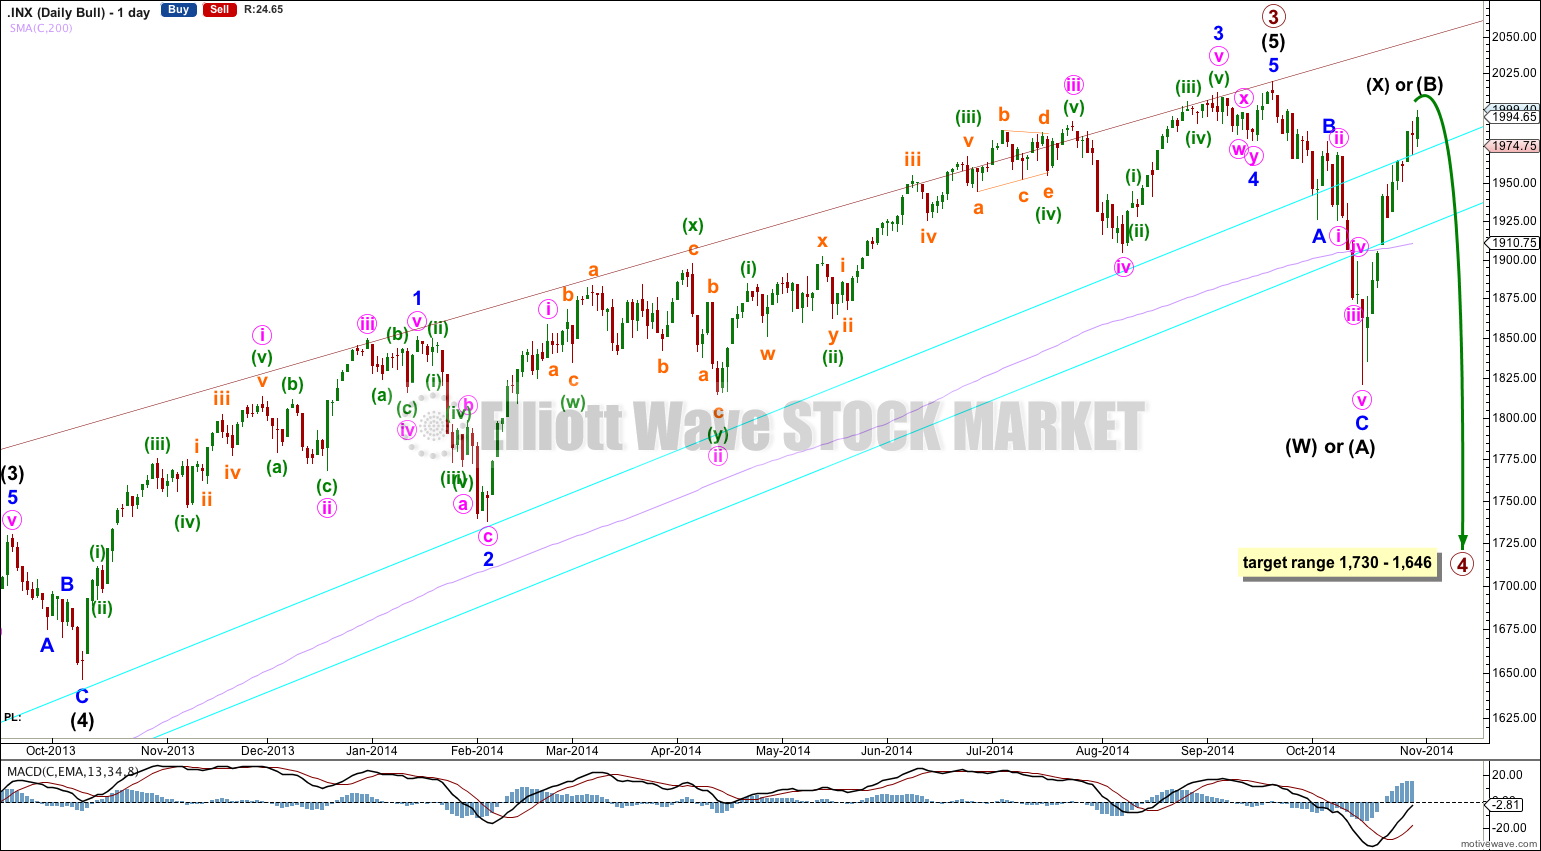
The weekly charts show how to draw the double aqua blue trend lines. The lower trend line began back in 2011 has repeatedly been tested and is reasonably shallow which is highly technically significant. It has now been breached by more than 3% of market value indicating a trend change.
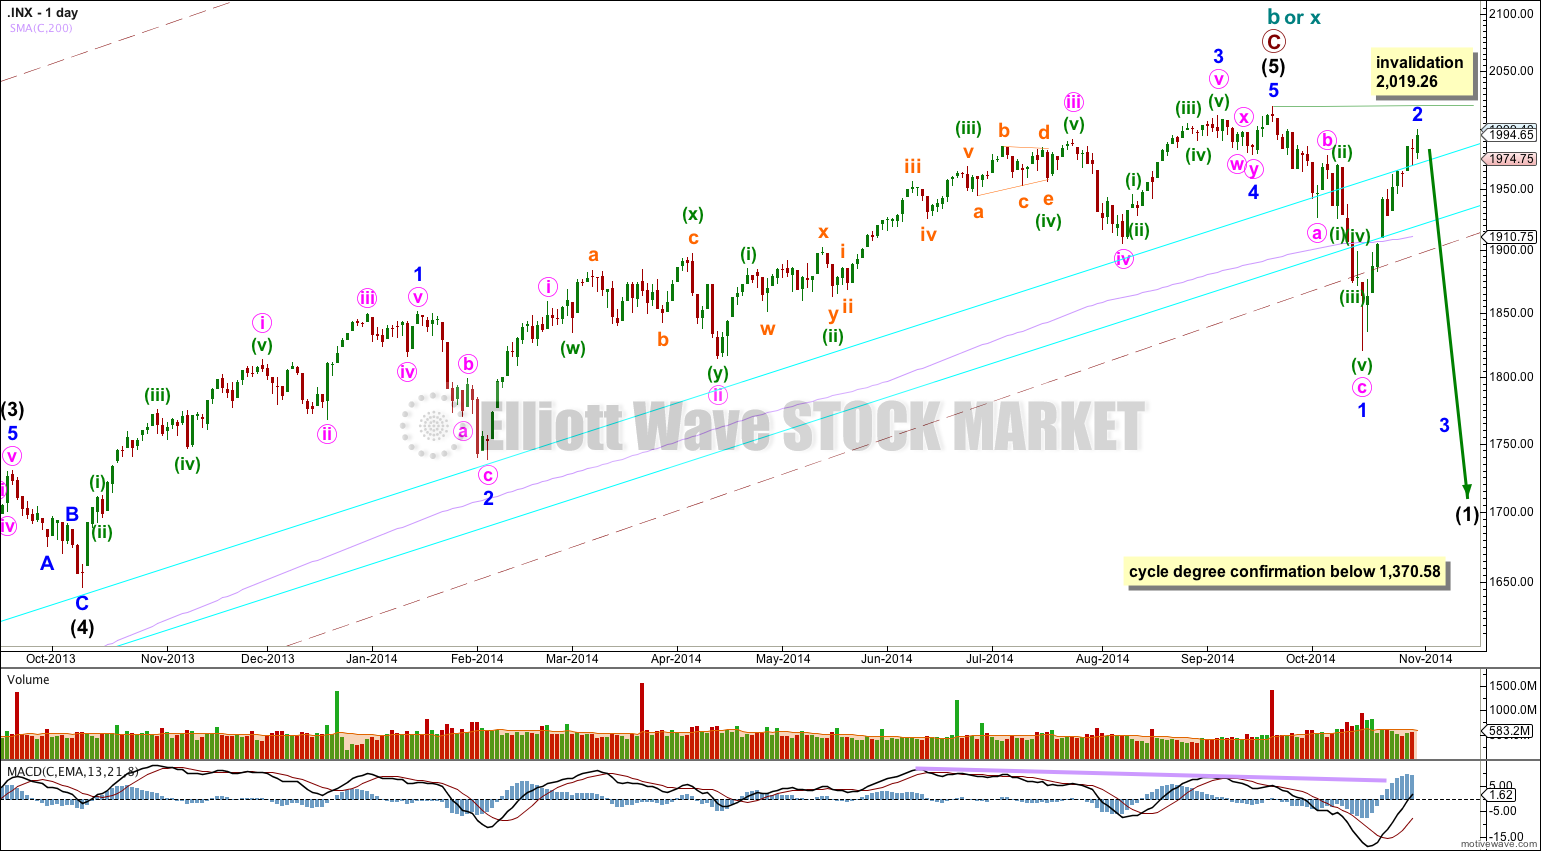
Because there is such a close Fibonacci ratio between intermediate waves (3) and (1) and intermediate wave (3) lasted 455 days, I am confident this labeling is correct. Also, intermediate wave (3) has the strongest upwards momentum within primary wave C. Therefore, the only piece of this wave count of which I am not confident is the structure within intermediate wave (5). Is it complete or not? This is why I have an alternate bearish wave count for you.
There is technical divergence between price and MACD at the weekly and daily chart levels. This indicates a trend change, but it does not indicate what degree the trend change should be.
For the first time in five years the lower edge of the maroon – – – channel about cycle wave b (or x) was breached. This is significant.
The bear wave count sees a huge super cycle wave (II) incomplete as either an expanded flat correction, a combination, or a double flat.
To have full confidence in this bearish wave count, and to discard the bullish wave count, I want to see three things happen:
1. A clear five down on the daily chart, with completion of intermediate wave (1).
2. Confirmation from NASDAQ with a new swing low for that market below 3,414,11.
3. A new low below 1,370.58 (although using structure as a guide the bull wave count would probably be discarded well before this point).
When we have those three things I will have full confidence in this wave count at cycle and super cycle degree, at the monthly chart level.
This wave count differs from the alternate bear count below in the labeling of the subdivisions within intermediate wave (5). Here, there is no Fibonacci ratio between minor waves 3 and 1, and minor wave 5 is 0.89 points longer than 0.146 the length of minor wave 3. Minor wave 2 is a single zigzag lasting 14 days, and minor wave 4 is a double combination lasting 7 days.
This wave count sees intermediate wave (1) as a leading diagonal because within it minor wave 1 down subdivides best as a three wave zigzag. However, it is also possible to see minor wave 1 on the hourly chart as a five wave impulse. This movement is a little ambiguous. When minor wave 4 arrives its depth will determine which structure intermediate wave (1) is: an overlap into minor wave 1 price territory will indicate a diagonal and no overlap will indicate an impulse. When minor wave 4 arrives I will have these two alternate structures on separate charts. For now I will keep the number of charts manageable.
The trend channels about this upwards movement are not working at all. The channel about this upwards zigzag is breached, but price continues higher.
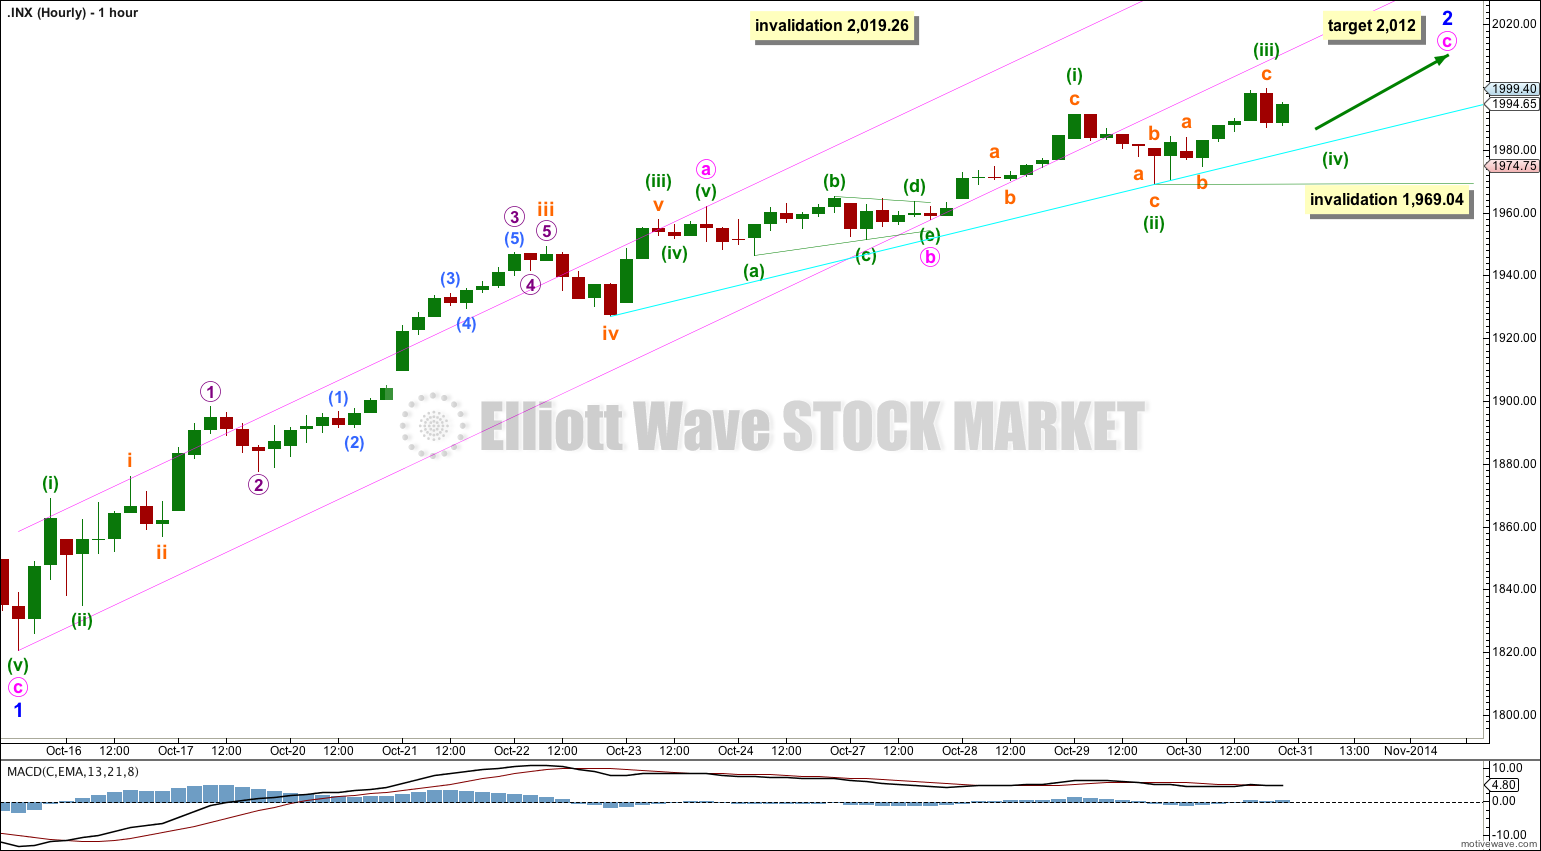
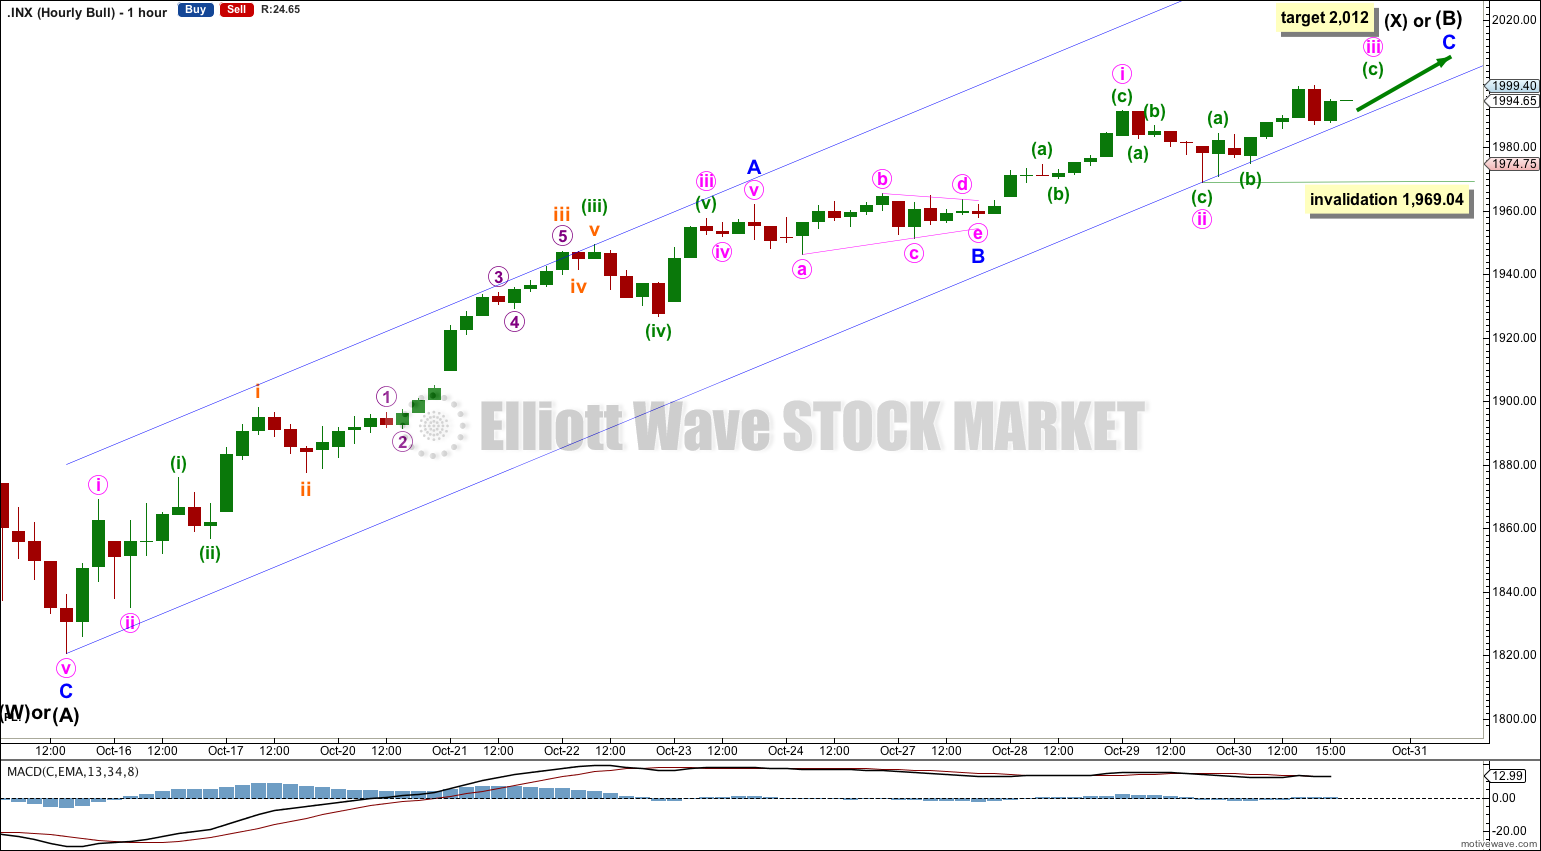
I am adjusting this wave count at the hourly chart level to be the same as that for the bull wave count. Minute waves a, b and c have better proportions. At 2,012 minute wave c would reach 0.382 the length of minute wave a.
Ratios within minute wave a are: minuette wave (iii) is 3.92 points short of 2.618 the length of minuette wave (i), and minuette wave (v)is 0.91 points longer than 0.090 the length of minuette wave (iii).
Within minuette wave (iii) there are no adequate Fibonacci ratios between subminuette waves i, iii and v.
Within subminuette wave iii ratios are: micro wave 3 is 2.79 points longer than 1.618 the length of micro wave 1, and micro wave 5 has no Fibonacci ratio to micro waves 3 or 1.
Ratios within micro wave 3 are: there is no Fibonacci ratio between submicro waves (3) and (1), and submicro wave (5) is 1.22 points short of equality in length with submicro wave (1).
For this main bear wave count minor wave 2 may not move beyond the start of minor wave 1 above 2,019.26.
The lower aqua blue trend line may show where upwards movement finds support, and a breach of this line may be an early indicator of a trend change.
Minute wave c may be unfolding as an ending diagonal. Within an ending diagonal all the sub waves must be zigzags. The fourth wave should overlap back into first wave price territory. Minuette wave (i) fits best as a zigzag on the five minute chart, and looks like a zigzag on the hourly chart. Minuette wave (ii) is .67 of minuette wave (i), just within the normal length of .66 to .81 for a second wave of a diagonal.
The structure for minuette wave (iii) is an incomplete zigzag. When it is done then minuette wave (iv) should move back down into minuette wave (i) price territory but it may not move beyond the end of minuette wave (ii) below 1,969.04.
When we know the length of minuette wave (iii) then we should know if the diagonal is expanding or contracting, and so how long minuette wave (iv) should be. Contracting diagonals are more common.
Overall this structure should continue with choppy overlapping generally trending upwards movement for another one to three days. Momentum is diverging from price and should continue to do so.
Ending diagonals are terminal structures (equivalent to wedges in traditional technical analysis). If this structure unfolds as expected it would support the expectation of an upcoming trend change at minor degree.

Alternate Bearish Wave Count
This idea works for both bull and bear wave counts.
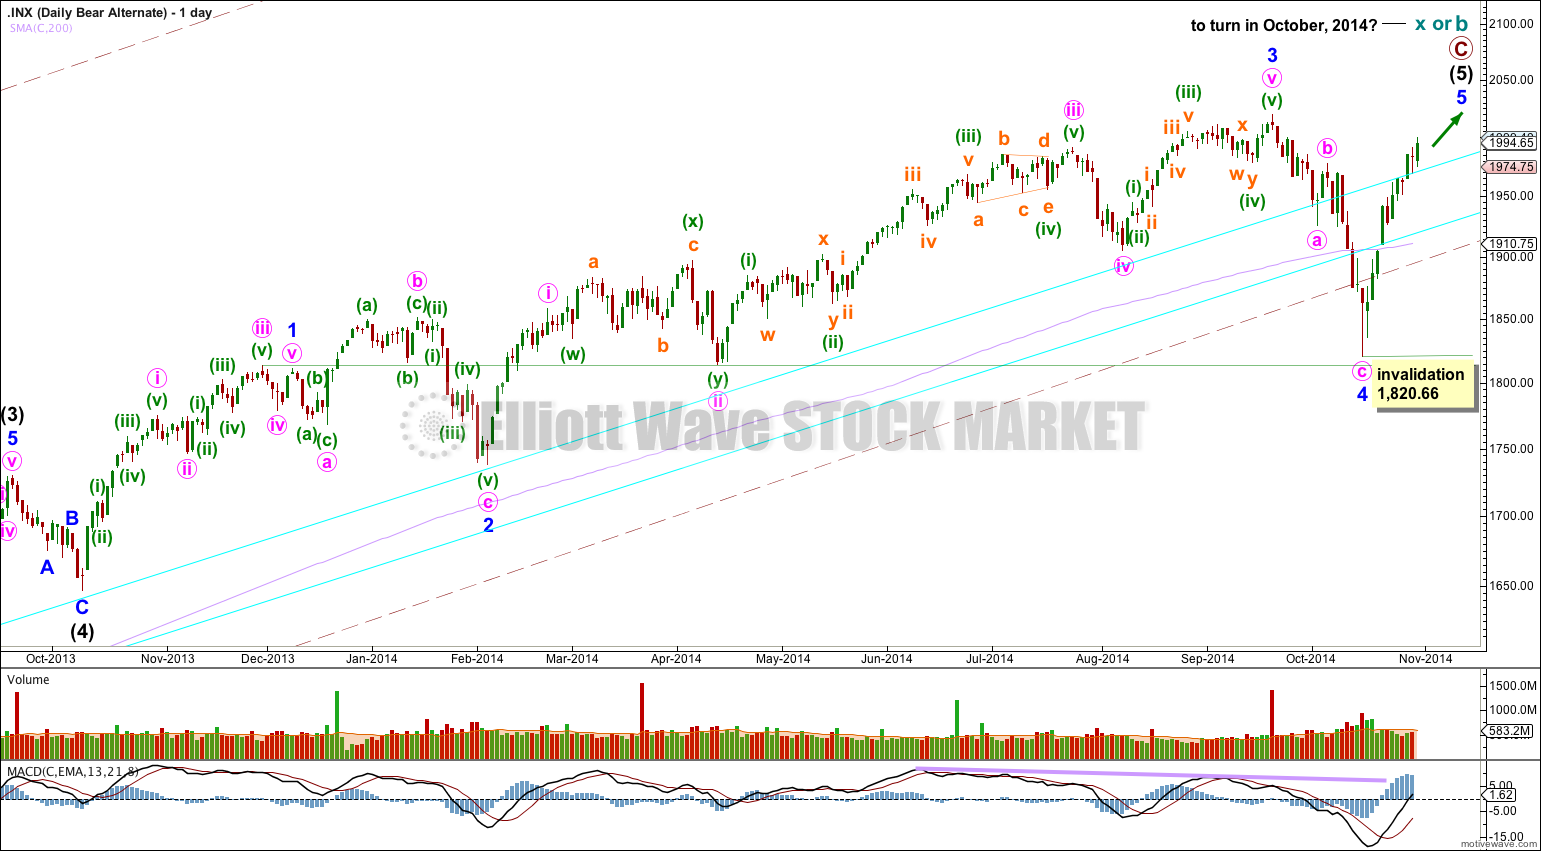
I am confident that I have the labeling of intermediate waves (3) and (4) correct. Intermediate wave (3) lasted 455 days and is just 0.76 short of 2.618 the length of intermediate wave (1). Intermediate wave (3) has the strongest upwards momentum within primary wave C.
With this wave count minor wave 3 is 14.29 points longer than 1.618 the length of minor wave 1. Minor wave 2 is an expanded flat lasting 39 days and minor wave 4 is a zigzag lasting 18 days, and the proportions between minor waves 2 and 4 are better.
The problem within this wave count is at the end of minor wave 3: within it minute wave v looks like a three wave structure and not a five because minuette waves (ii) and (iv) are grossly disproportionate. There is another problem with this wave count: a clear breach of the lower edge of the maroon channel is most likely an indication that there has been a trend change prior, not that there is a trend change to come.
Because there is a Fibonacci ratio between minor waves 3 and 1 I would not expect to see a Fibonacci ratio for minor wave 5 to either of 3 or 1. If minor wave 5 only reached equality with minor wave 1 it would be truncated. Minor wave 5 is most likely to make a new high above minor wave 3 at 2,019.26, but it does not have to. It only needs to subdivide as a five wave structure.
This alternate wave count would be confirmed with a new high above 2,019.26. This wave count expects two or three more days of upwards movement to a slight new high, before a trend change is likely. I would expect minor wave 5 to be relatively short and brief, only a little longer than minor wave 1.
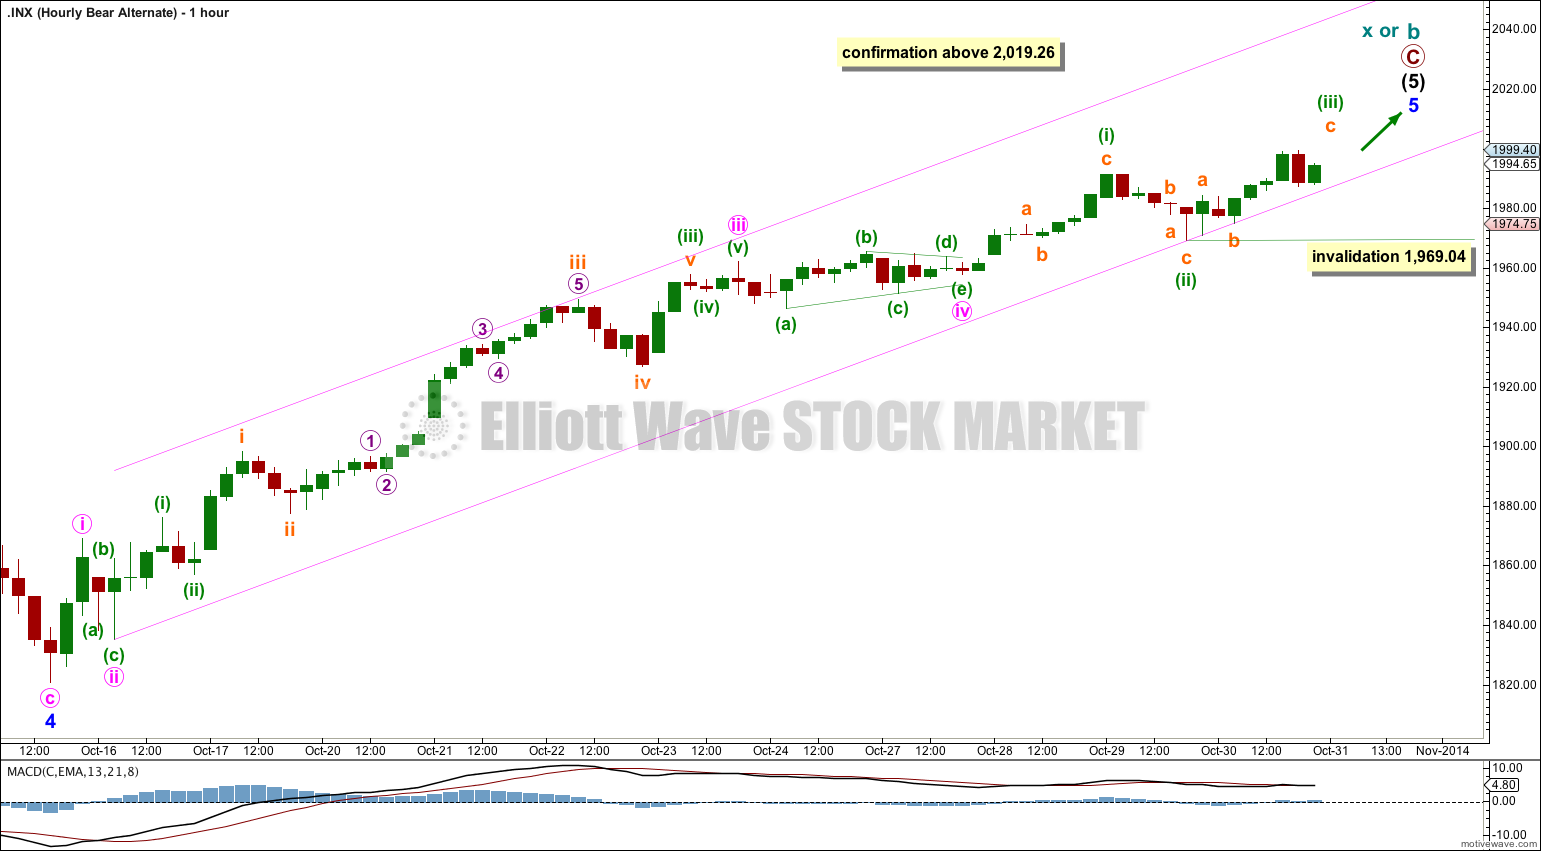
So far it is also possible to see this upwards movement as an incomplete five wave impulse. The subdivisions have a better fit and the Fibonacci ratios are better too.
Minute wave iii is just 0.38 points longer than 2.618 the length of minute wave i. I would not expect to see a Fibonacci ratio for minute wave v to either of i or iii.
Ratios within minute wave iii are: minuette wave (iii) is 6.51 points short of 2.618 the length of minuette wave (i), and minuette wave (v) is 0.46 longer than 0.236 the length of minuette wave (i).
Ratios within minuette wave (iii) are: subminuette wave iii is 4.92 points longer than 1.618 the length of subminuette wave i, and subminuette wave v has no adequate Fibonacci ratio to either of subminuette waves iii or i.
Ratios within subminuette wave iii are: there is no Fibonacci ratio between micro waves 3 and 1, and micro wave 5 is just 0.91 points short of equality in length with micro wave 1.
The channel drawn here is a best fit. This alternate wave count still expects that an ending diagonal is unfolding, momentum should continue to show divergence with price as it slows, and more upwards movement should continue for a few days. This alternate expects upwards movement to end slightly above 2,019.26.
Bullish Wave Count
This bullish wave count differs from the bearish wave count at the monthly chart level and at super cycle wave degree. To see the historic picture go here.
Upwards movement for intermediate wave (X) has now reached 1,999.40 and so the minimum requirement of 90% for a B wave of a flat correction is now met. Primary wave 4 may be unfolding as a triangle, flat or combination. All these structures would see it show alternation with the zigzag of primary wave 2.
Primary wave 2 was a 41% zigzag correction. I would expect primary wave 4 to be shallow. It may end within the price territory of the fourth wave of one lesser degree, below 1,730 and above 1,646.
Primary wave 2 lasted a Fibonacci 13 weeks. Zigzags tend to be more brief structures. I would expect primary wave 4 to last at least 13 weeks, and it may last up to a Fibonacci 21 weeks. Combinations and triangles particularly both tend to be more time consuming structures than zigzags. This would give it a 1.618 duration to primary wave 2. So far primary wave 4 is only in its sixth week, so this wave count would reasonably expect it to continue for at least another seven weeks.
It is too early to label primary wave 4 as over because it has lasted only 4 weeks and would be a zigzag so have no structural alternation with the zigzag of primary wave 2.
At this stage I am now more confident in my degree of labelling within primary wave 4. It fits nicely if the first two intermediate degree waves are now complete.
The upwards zigzag is here labeled in exactly the same way as the upwards zigzag for the main bear hourly wave count. The ratios and targets are the same.
For this bull wave count there is no upper invalidation point. Expanded flats, running triangles and combinations may all have new price extremes beyond the start of the first wave within the correction.
This analysis is published about 05:59 p.m. EST.