
A little upwards movement was expected, but the first target at 1,999 has not been met.
Note: Unfortunately, my desktop and laptop died in the last 24 hours (maybe it was that lightning strike?). So I am using a borrowed laptop, but it does not yet have the recording and editing software for recording and editing the video analysis. I am sorry but there can be no video today, and I expect normal service will resume tomorrow. Therefore, I will make this text analysis very thorough. Thank you.
Summary: Overall this is the point in time at which the bear wave count now begins to diverge from the bull wave count in terms of structure, but not direction. Both expect downwards movement, but the bear wave count expects a third wave to 1,670. The bull wave count expects downwards movement as a much shorter zigzag or a bigger flat correction, and to only end about 1,820.66 or above.
Click on charts to enlarge.
Bearish Wave Count
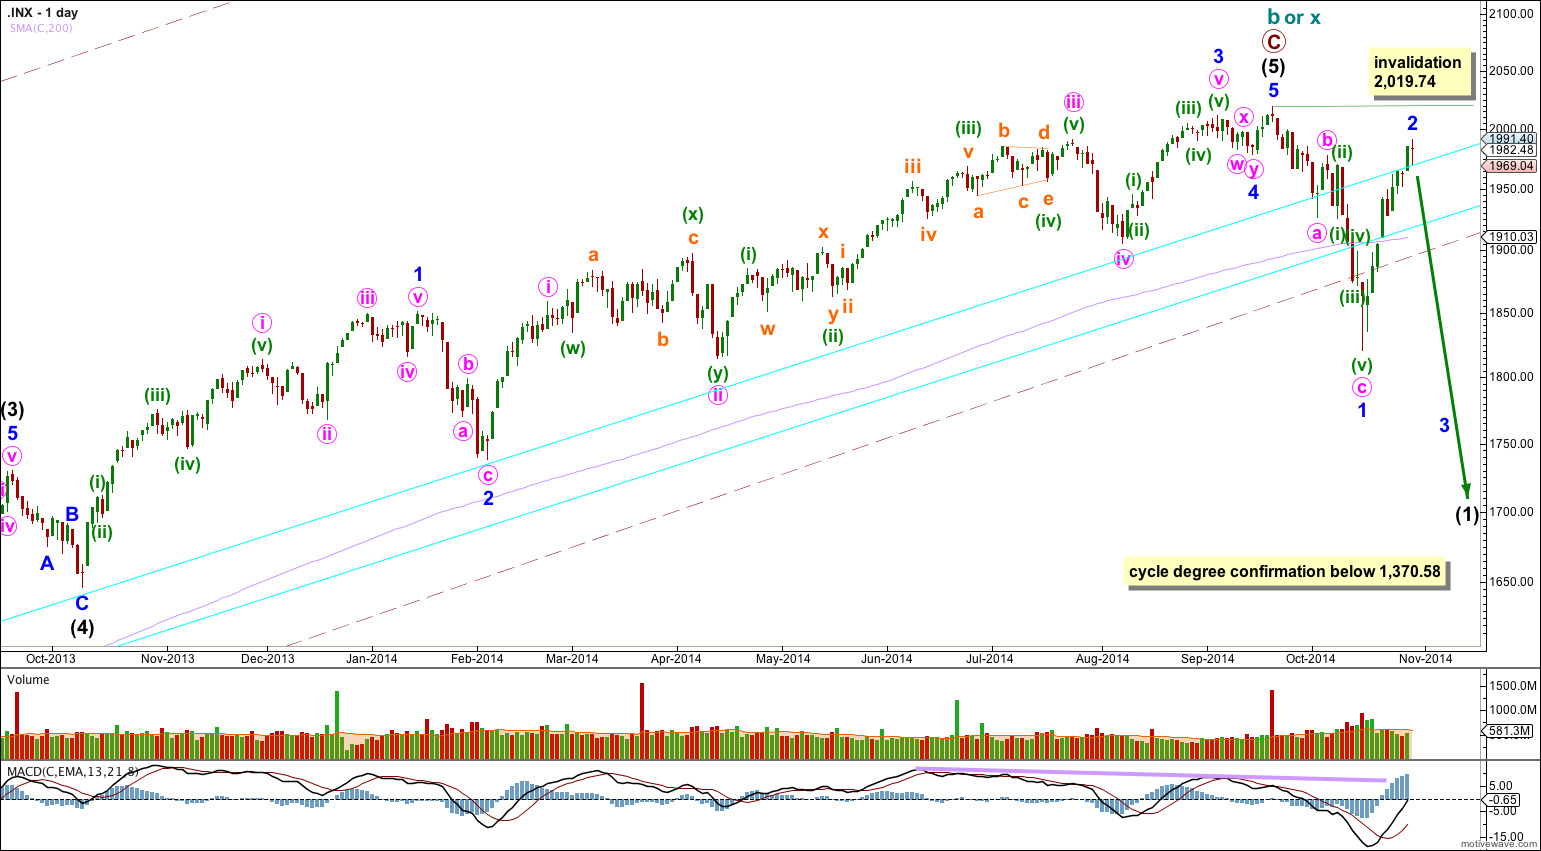
The weekly charts show how to draw the double aqua blue trend lines. The lower trend line began back in 2011 has repeatedly been tested and is reasonably shallow which is highly technically significant. It has now been breached by more than 3% of market value indicating a trend change.
Because there is such a close Fibonacci ratio between intermediate waves (3) and (1) and intermediate wave (3) lasted 455 days, I am confident this labeling is correct. Also, intermediate wave (3) has the strongest upwards momentum within primary wave C. Therefore, the only piece of this wave count of which I am not confident is the structure within intermediate wave (5). Is it complete or not? This is why I have an alternate bearish wave count for you.
There is technical divergence between price and MACD at the weekly and daily chart levels. This indicates a trend change, but it does not indicate what degree the trend change should be.
For the first time in five years the lower edge of the maroon – – – channel about cycle wave b (or x) was breached. This is significant.
The bear wave count sees a huge super cycle wave (II) incomplete as either an expanded flat correction, a combination, or a double flat.
To have full confidence in this bearish wave count, and to discard the bullish wave count, I want to see three things happen:
1. A clear five down on the daily chart, with completion of intermediate wave (1).
2. Confirmation from NASDAQ with a new swing low for that market below 3,414,11.
3. A new low below 1,370.58 (although using structure as a guide the bull wave count would probably be discarded before this point).
When we have those three things I will have full confidence in this wave count at cycle and super cycle degree, at the monthly chart level.
This wave count differs from the alternate bear count below in the labeling of the subdivisions within intermediate wave (5). Here, there is no Fibonacci ratio between minor waves 3 and 1, and minor wave 5 is 0.89 points longer than 0.146 the length of minor wave 3. Minor wave 2 is a single zigzag lasting 14 days, and minor wave 4 is a double combination lasting 7 days.
This wave count sees intermediate wave (1) as a leading diagonal because within it minor wave 1 down subdivides best as a three wave zigzag. However, it is also possible to see minor wave 1 on the hourly chart as a five wave impulse. This movement is a little ambiguous. When minor wave 4 arrives its depth will determine which structure intermediate wave (1) is: an overlap into minor wave 1 price territory will indicate a diagonal and no overlap will indicate an impulse. When minor wave 4 arrives I will have these two alternate structures on separate charts. For now I will keep the number of charts manageable.
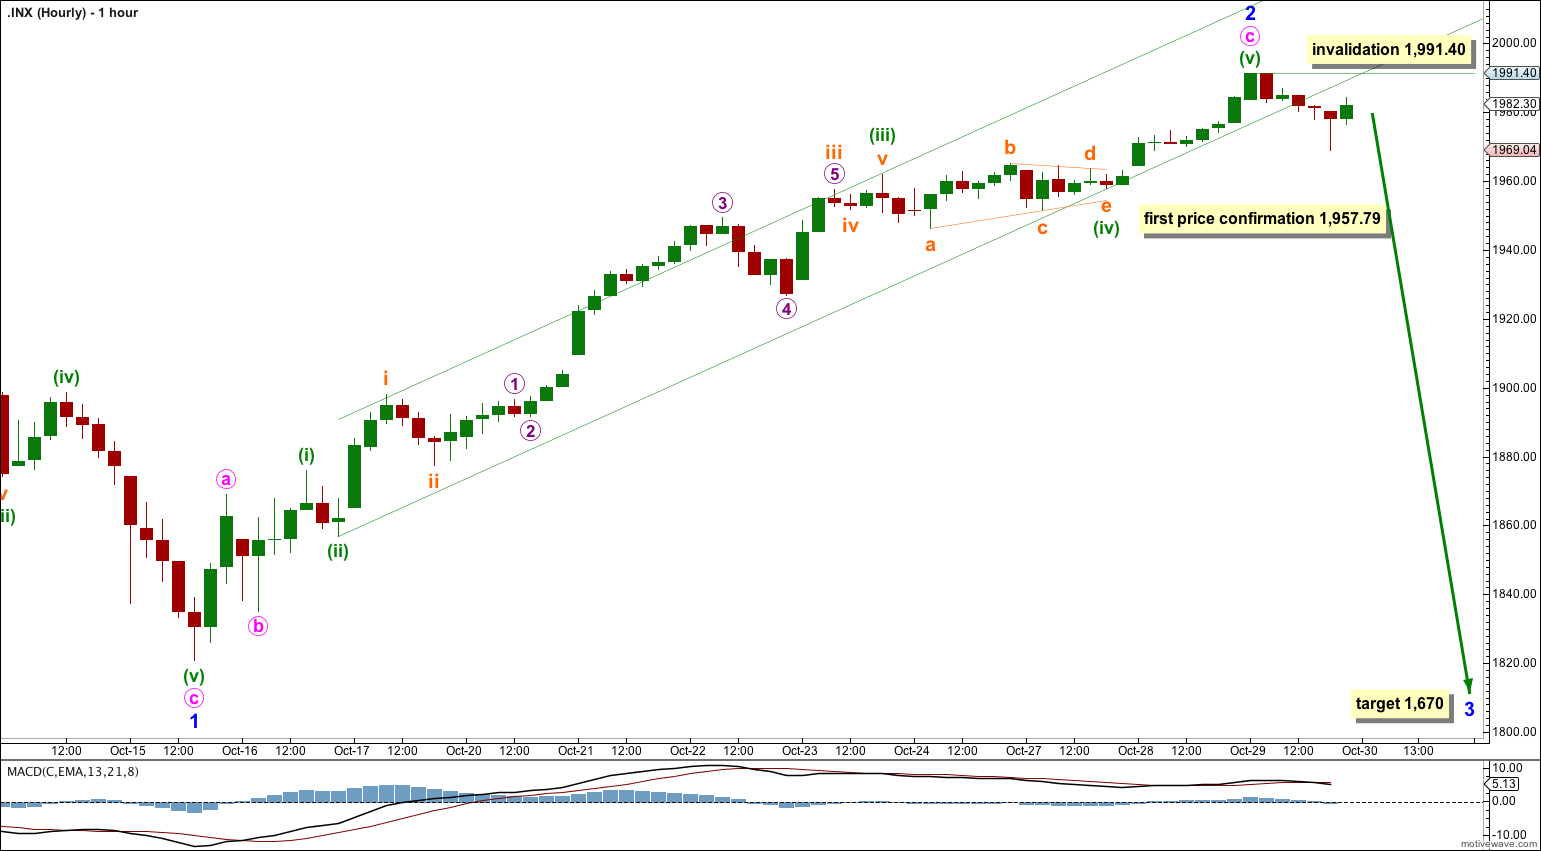
The trend channel about minor wave 2 is clearly breached with downwards movement which subdivides perfectly as a five wave impulse on the five minute chart.
Minor wave 2 is a very deep 0.86 correction of minor wave 1; a little deeper than the maximum common length of 0.81 for a second wave within a diagonal, but entirely valid.
Within minute wave c minuette wave (iii) is 2.21 points short of 2.618 the length of minuette wave (i), and now minuette wave (v) has no Fibonacci ratio to either of minuette waves (iii) or (i).
At 1,670 minor wave 3 would reach 1.618 the length of minor wave 1. Minor wave 3 must make a new low below the end of minor wave 1 at 1,820.66.
Movement below 1,957.79 would provide confidence in this minor degree trend change. At that point downwards movement could not be a second wave correction within the final wave up, and so the whole structure would be more likely to be complete.
Within minor wave 3 no second wave correction may move beyond the start of its first wave above 1,991.40.

Alternate Bearish Wave Count
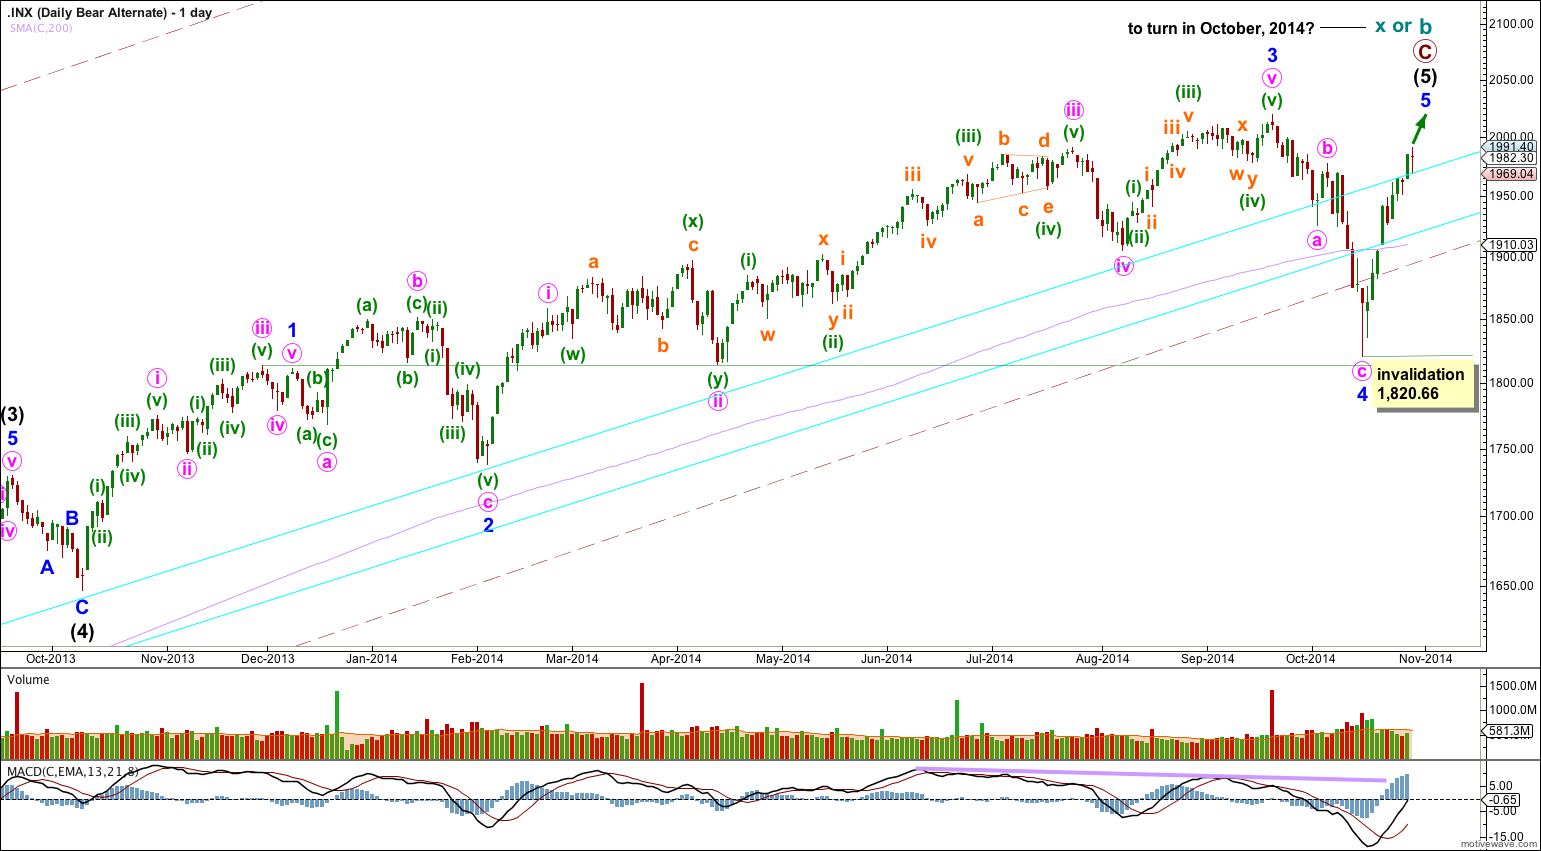
This idea works for both bull and bear wave counts.
I am confident that I have the labeling of intermediate waves (3) and (4) correct. Intermediate wave (3) lasted 455 days and is just 0.76 short of 2.618 the length of intermediate wave (1). Intermediate wave (3) has the strongest upwards momentum within primary wave C.
With this wave count minor wave 3 is 14.29 points longer than 1.618 the length of minor wave 1. Minor wave 2 is an expanded flat lasting 39 days and minor wave 4 is a zigzag lasting 18 days, and the proportions between minor waves 2 and 4 are better.
The problem within this wave count is at the end of minor wave 3: within it minute wave v looks like a three wave structure and not a five because minuette waves (ii) and (iv) are grossly disproportionate. There is another problem with this wave count: a clear breach of the lower edge of the maroon channel is most likely an indication that there has been a trend change prior, not that there is a trend change to come.
Because there is a Fibonacci ratio between minor waves 3 and 1 I would not expect to see a Fibonacci ratio for minor wave 5 to either of 3 or 1. If minor wave 5 only reached equality with minor wave 1 it would be truncated. Minor wave 5 is most likely to make a new high above minor wave 3 at 2,019.26, but it does not have to. It only needs to subdivide as a five wave structure.
This alternate wave count now diverges even more strongly from the main bearish wave count, but it would only be confirmed with a new high above 2,019.26. This wave count expects maybe two more days of upwards movement to a slight new high, before a trend change is likely. I would expect minor wave 5 to be relatively short and brief, only a little longer than minor wave 1.
Bullish Wave Count
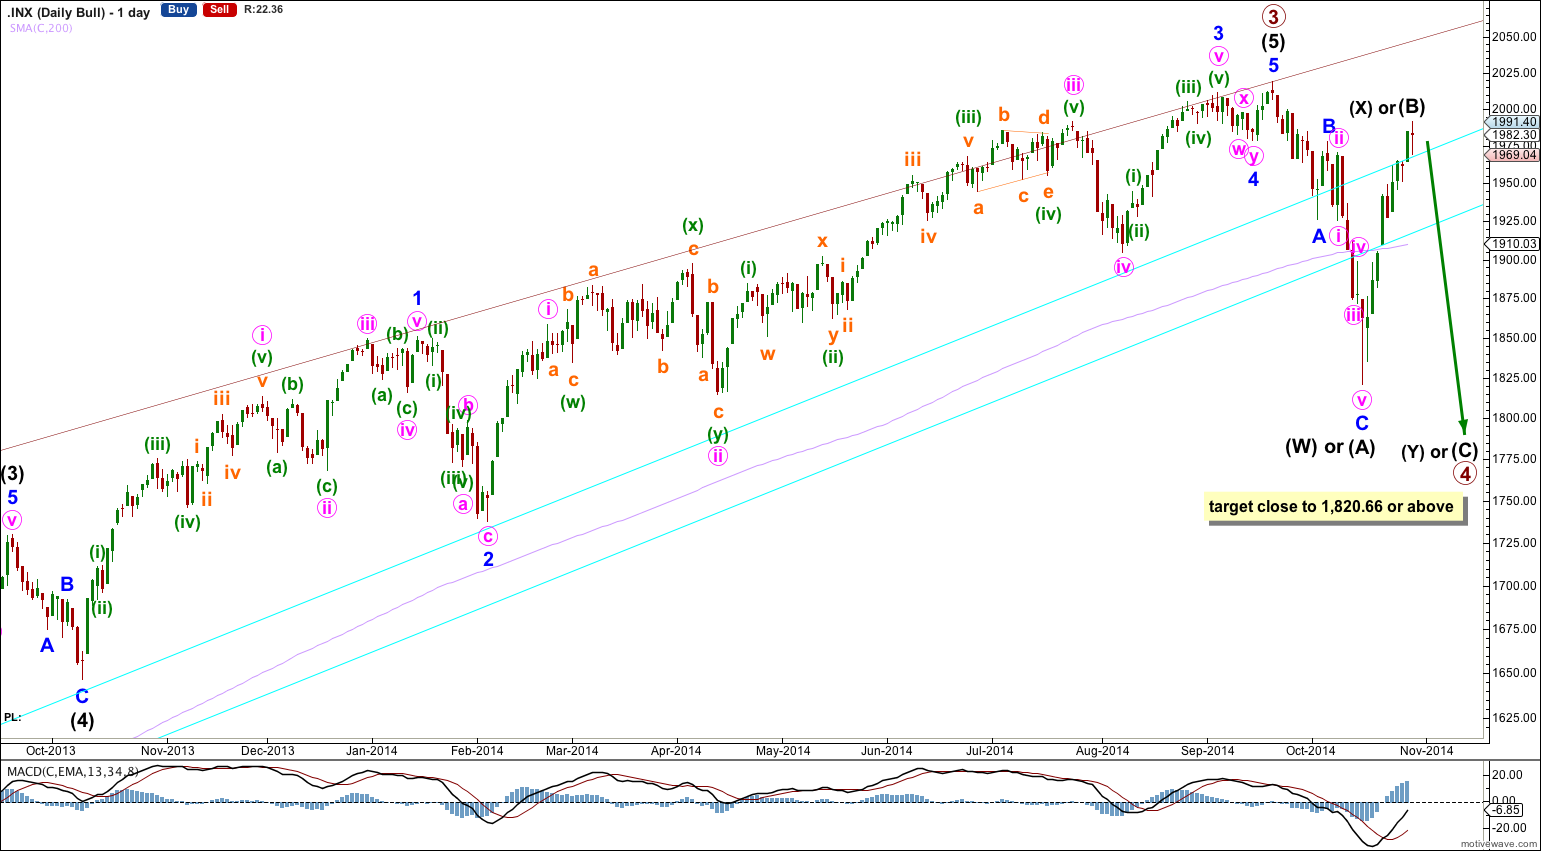
This bullish wave count differs from the bearish wave count at the monthly chart level and at super cycle wave degree. To see the historic picture go here.
Upwards movement for intermediate wave (X) did not reach 1,999.40 and so the minimum requirement for a B wave of a flat correction may not be met. This indicates that primary wave 4 may be unfolding as a double combination, with the first structure a completed zigzag labeled intermediate wave (W). Primary wave 4 may also be a triangle; the first two waves for intermediate waves (A) and (B) of a contracting triangle would be complete.
Primary wave 2 was a 41% zigzag correction. I would expect primary wave 4 to show alternation in structure and so a combination or triangle would do that.
Primary wave 2 lasted a Fibonacci 13 weeks. Zigzags tend to be more brief structures. I would expect primary wave 4 to last at least 13 weeks, and it may last up to a Fibonacci 21 weeks. Combinations and triangles particularly both tend to be more time consuming structures than zigzags. This would give it a 1.618 duration to primary wave 2. So far primary wave 4 is only in its sixth week, so this wave count would reasonably expect it to continue for at least another seven weeks.
It is too early to label primary wave 4 as over because it has lasted only 4 weeks and would be a zigzag so have no structural alternation with the zigzag of primary wave 2.
At this stage I am now more confident in my degree of labelling within primary wave 4. It fits nicely if the first two intermediate degree waves are now complete.
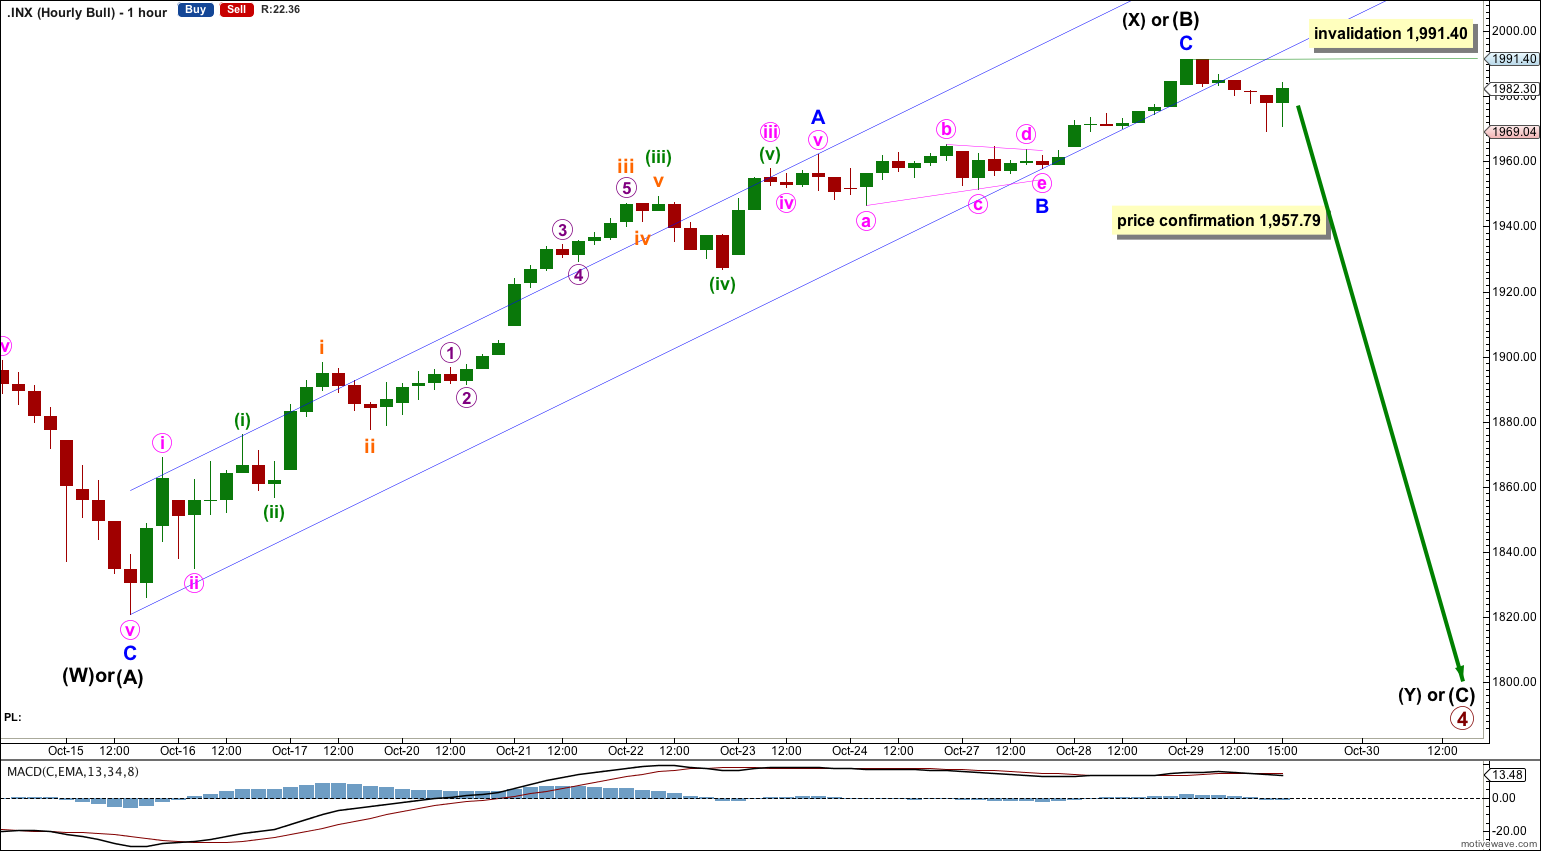
This is another way to see upwards movement as a zigzag. The recent triangle may have been minor wave B rather than a fourth wave.
A breach of the channel about this upwards movement indicates a trend change. Within this labelling of the zigzag minor wave C is just 0.27 longer than 0.236 the length of minor wave A.
If primary wave 4 is a combination then intermediate wave (Y) is most likely to be a flat correction subdividing 3-3-5. It may also be a triangle. Intermediate wave (Y) would most likely end close to the same point as intermediate wave (W) at 1,820.66 because the purpose of double combinations is to take up time and move price sideways, so the second structure in a double normally ends close to the same level as the first.
If primary wave 4 is a contracting triangle then intermediate wave (C) is most likely to be a single or double zigzag. The single zigzag or the first zigzag within a double zigzag would subdivide 5-3-5. Intermediate wave (C) of a contracting triangle may not move beyond the end of intermediate wave (A) at 1,820.66.
Primary wave 4 may also be an expanding triangle, but the rarity of those structures (I have only ever seen three in close to six years of analysis) means that possibility is so unlikely it should only be considered it if proves itself to be true.
This analysis is published about 05:04 p.m. EST.