
A little more upwards movement was expected, but price is moving sideways.
Summary: A fourth or B wave triangle is almost complete. One final upwards wave should follow to either 1,975 or 2,012. The lower target looks more likely as the upper aqua blue line looks like it is providing strong resistance.
Click on charts to enlarge.
Bearish Wave Count
The weekly charts show how to draw the double aqua blue trend lines. The lower trend line began back in 2011 has repeatedly been tested and is reasonably shallow which is highly technically significant. It has now been breached by more than 3% of market value indicating a trend change.
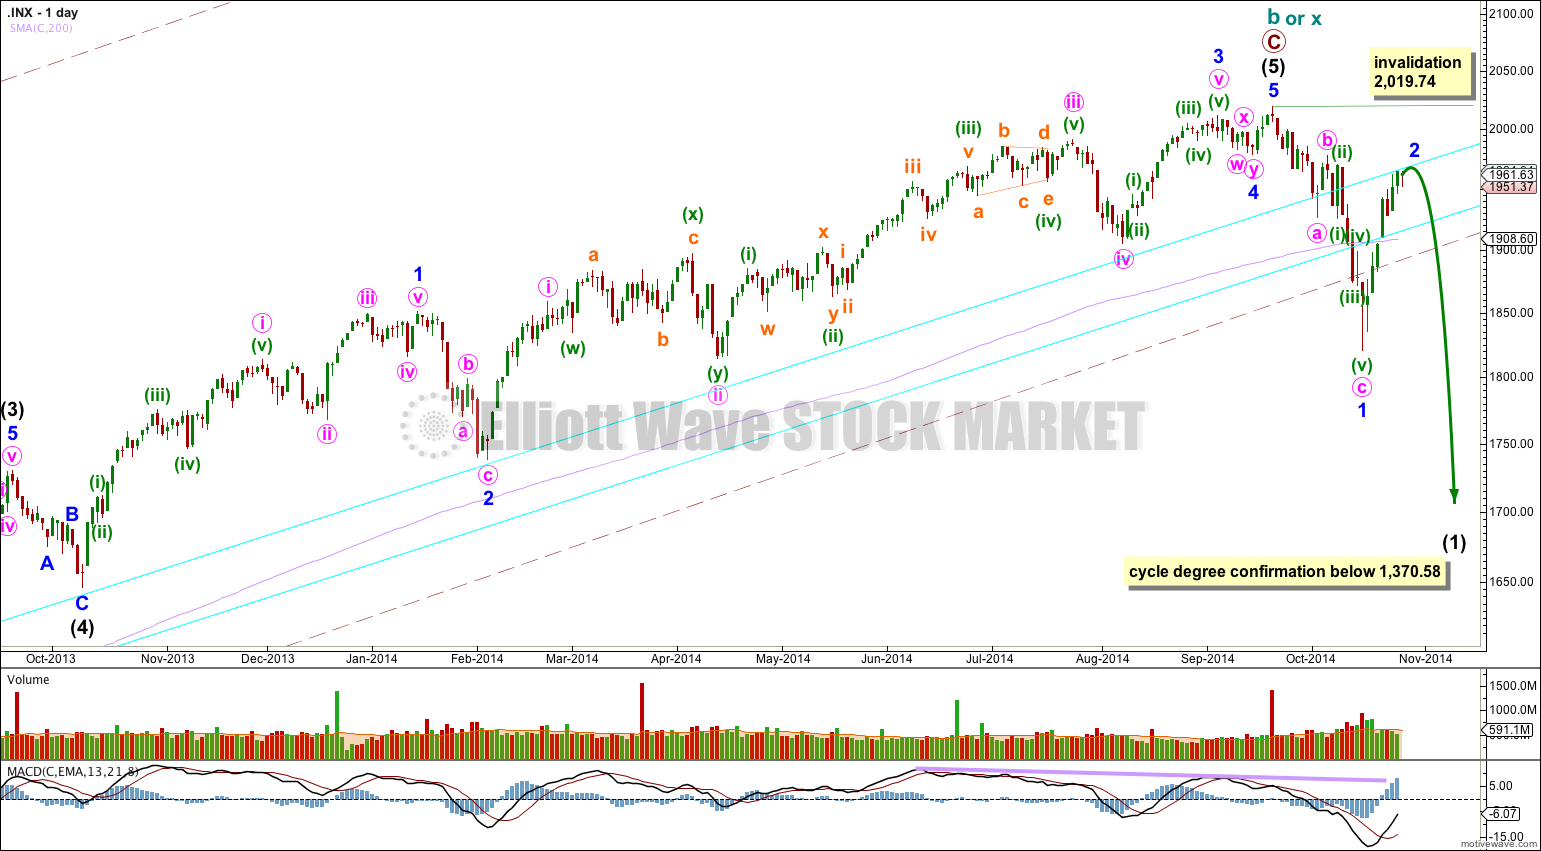
Because there is such a close Fibonacci ratio between intermediate waves (3) and (1) and intermediate wave (3) lasted 455 days, I am confident this labeling is correct. Also, intermediate wave (3) has the strongest upwards momentum within primary wave C. Therefore, the only piece of this wave count of which I am not confident is the structure within intermediate wave (5). Is it complete or not? This is why I have an alternate bearish wave count for you.
There is technical divergence between price and MACD at the weekly and daily chart levels. This indicates a trend change, but it does not indicate what degree the trend change should be.
For the first time in five years the lower edge of the maroon – – – channel about cycle wave b (or x) was breached. This is significant.
The bear wave count sees a huge super cycle wave (II) incomplete as either an expanded flat correction, a combination, or a double flat.
If cycle wave b or x is now over then the first downwards wave for intermediate wave (1) is now most likely unfolding as a leading diagonal.
To have full confidence in this bearish wave count, and to discard the bullish wave count, I want to see three things happen:
1. A clear five down on the daily chart, with completion of intermediate wave (1).
2. Confirmation from NASDAQ with a new swing low for that market below 3,414,11.
3. A new low below 1,370.58 (although using structure as a guide the bull wave count would probably be discarded before this point).
When we have those three things I will have full confidence in this wave count.
This wave count differs from the alternate bear count below in the labeling of the subdivisions within intermediate wave (5). Here, there is no Fibonacci ratio between minor waves 3 and 1, and minor wave 5 is 0.89 points longer than 0.146 the length of minor wave 3. Minor wave 2 is a single zigzag lasting 14 days, and minor wave 4 is a double combination lasting 7 days.
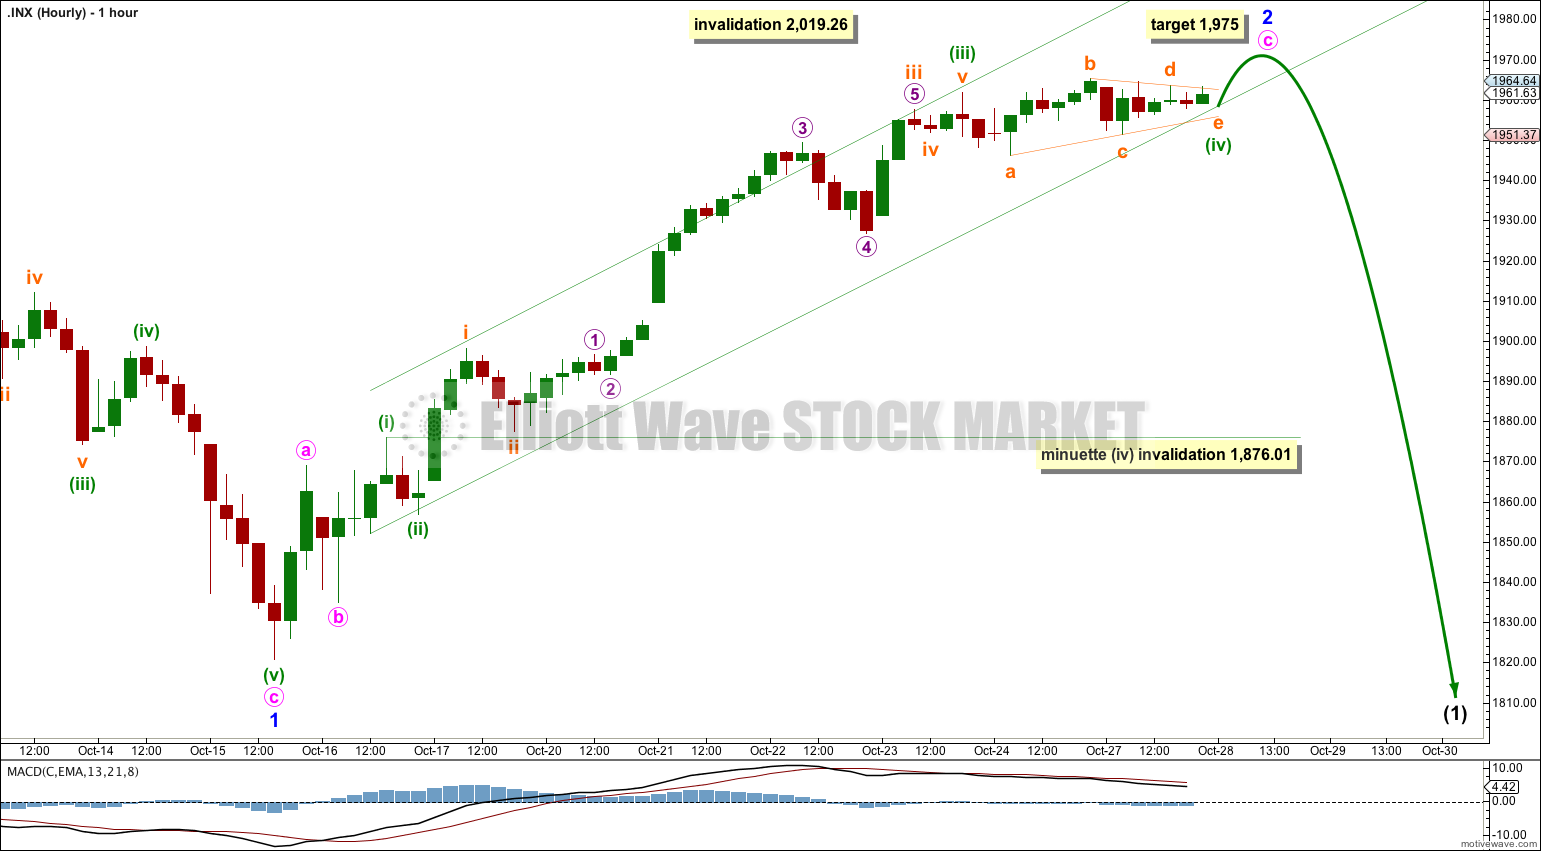
The channel on last analysis hourly chart was breached by sideways movement. There is still more than one way to see this upwards movement. Sideways movement is either a fourth wave triangle as for this bear wave count, or a B wave triangle as for the bullish hourly chart. Both ideas fit for both wave counts, as both wave counts are seeing upwards movement as a zigzag.
Minute wave c is a little longer than 2.618 the length of minute wave a. They may not exhibit a Fibonacci ratio to each other.
Within minute wave c minuette wave (iii) is 2.21 short of 2.618 the length of minuette wave (i).
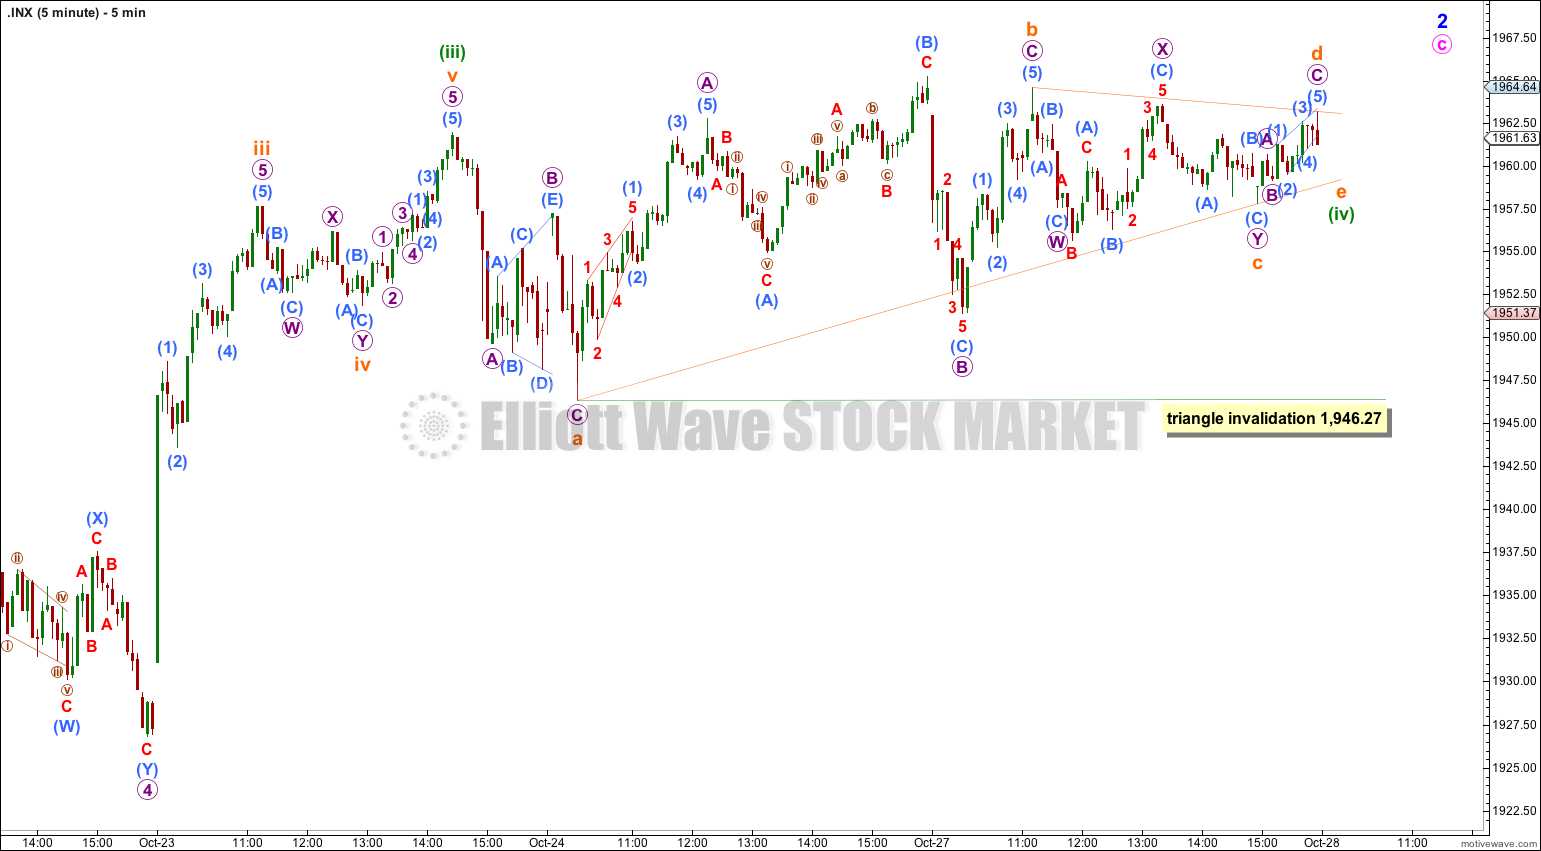
Ratios within minuette wave (iii) are: there is no Fibonacci ratio between subminuette waves iii and i, and subminuette wave v is 0.38 points longer than 0.236 the length of subminuette wave i.
Ratios within subminuette wave iii are: micro wave 3 has no Fibonacci ratio to micro wave 1, and micro wave 5 is exactly 1.618 the length of micro wave 1.
There is perfect alternation between minuette waves (ii) and (iv): minuette wave (ii) is a 47% zigzag and minuette wave (iv) is so far a much more shallow running triangle.
Minuette wave (iv) is not contained within the channel drawn using Elliott’s first technique. When the triangle is complete redraw the channel using the second technique: draw the first trend line from the ends of minuette waves (ii) to (iv) then place a parallel copy on the end of minuette wave (iii). The fifth wave is most likely to remain in the lower half of that channel. Once there is some upwards movement for a fifth wave then a subsequent clear breach of the channel to the downside should indicate a trend change at minor degree.
The fifth wave following the triangle is likely to be very short and brief. At 1,975 it would reach 0.382 the length of minuette wave (i) (this target is based on estimating where the triangle should end).
I would expect this upwards movement to end tomorrow.
Alternate Bearish Wave Count

This idea works for both bull and bear wave counts.
I am confident that I have the labeling of intermediate waves (3) and (4) correct. Intermediate wave (3) lasted 455 days and is just 0.76 short of 2.618 the length of intermediate wave (1). Intermediate wave (3) has the strongest upwards momentum within primary wave C.
With this wave count minor wave 3 is 14.29 points longer than 1.618 the length of minor wave 1. Minor wave 2 is an expanded flat lasting 39 days and minor wave 4 is a zigzag lasting 18 days, and the proportions between minor waves 2 and 4 are better.
The problem within this wave count is at the end of minor wave 3: within it minute wave v looks like a three wave structure and not a five because minuette waves (ii) and (iv) are grossly disproportionate. There is another problem with this wave count: a clear breach of the lower edge of the maroon channel is most likely an indication that there has been a trend change prior, not that there is a trend change to come.
Because there is a Fibonacci ratio between minor waves 3 and 1 I would not expect to see a Fibonacci ratio for minor wave 5 to either of 3 or 1. If minor wave 5 only reached equality with minor wave 1 it would be truncated. Minor wave 5 is most likely to make a new high above minor wave 3 at 2,019.26, but it does not have to. It only needs to subdivide as a five wave structure.
It is at this point that this alternate wave count now diverges from the main bearish wave count. This alternate would expect to see maybe four more days of upwards movement to a slight new high.
Bullish Wave Count
This bullish wave count differs from the bearish wave count at the monthly chart level and at super cycle wave degree. To see the historic picture go here.
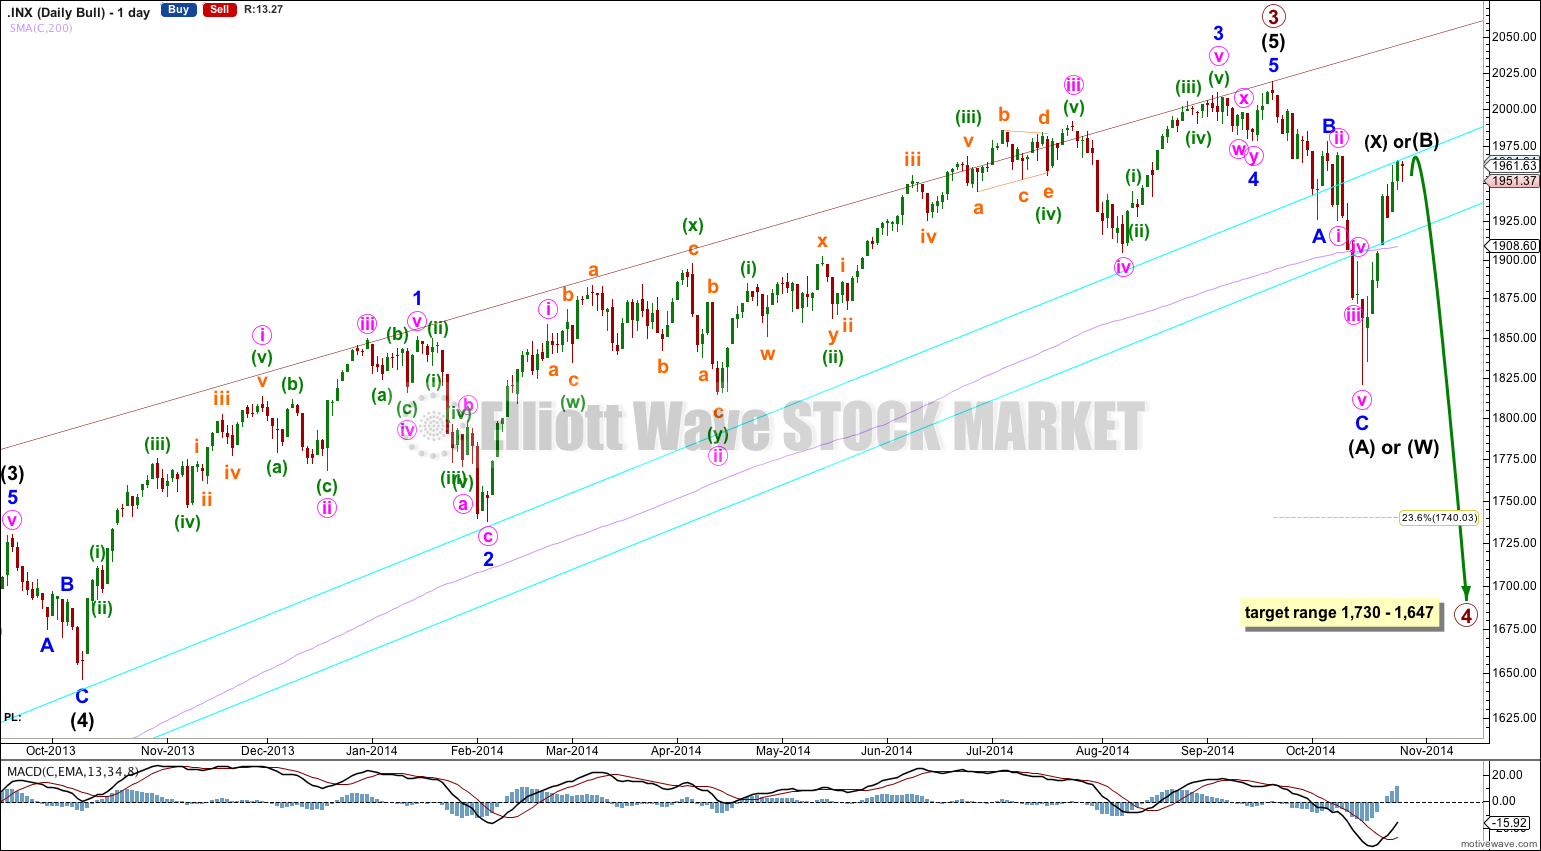
Primary wave 4 may end within the price territory of the fourth wave of one lesser degree. Intermediate wave (4) price territory is from 1,730 to 1,647.
Primary wave 2 was a 41% zigzag correction. I would expect primary wave 4 to show alternation in structure so most likely it will be a flat, combination or triangle. All of these structures may include a new price extreme beyond the start of intermediate wave (A), so they could see a new high.
Primary wave 2 lasted a Fibonacci 13 weeks. Zigzags tend to be more brief structures. I would expect primary wave 4 to last at least 13 weeks, and it may last up to a Fibonacci 21 weeks if it is a more time consuming structure like a combination or triangle. This would give it a 1.618 duration to primary wave 2.
It is too early to label primary wave 4 as over because it has lasted only 4 weeks and would be a zigzag so have no structural alternation with the zigzag of primary wave 2.
However, my degree of labeling for this downwards movement may be one degree too high. If we see a five down complete then I would move the degree of labeling for this bull wave count down one degree within primary wave 4, which could be only minor wave A of a zigzag for intermediate wave (A).
Because primary wave 4 is most likely to be a flat, triangle or combination, the first movement down is most likely to subdivide as a three wave structure.
If intermediate wave (A) is over then primary wave 4 may be a flat or triangle. Intermediate wave (B) may make a new high above the start of intermediate wave (A) at 2,019.26 as in an expanded flat or running triangle.
If primary wave 4 is a combination then the first structure in the double may be a completed zigzag for intermediate wave (W).
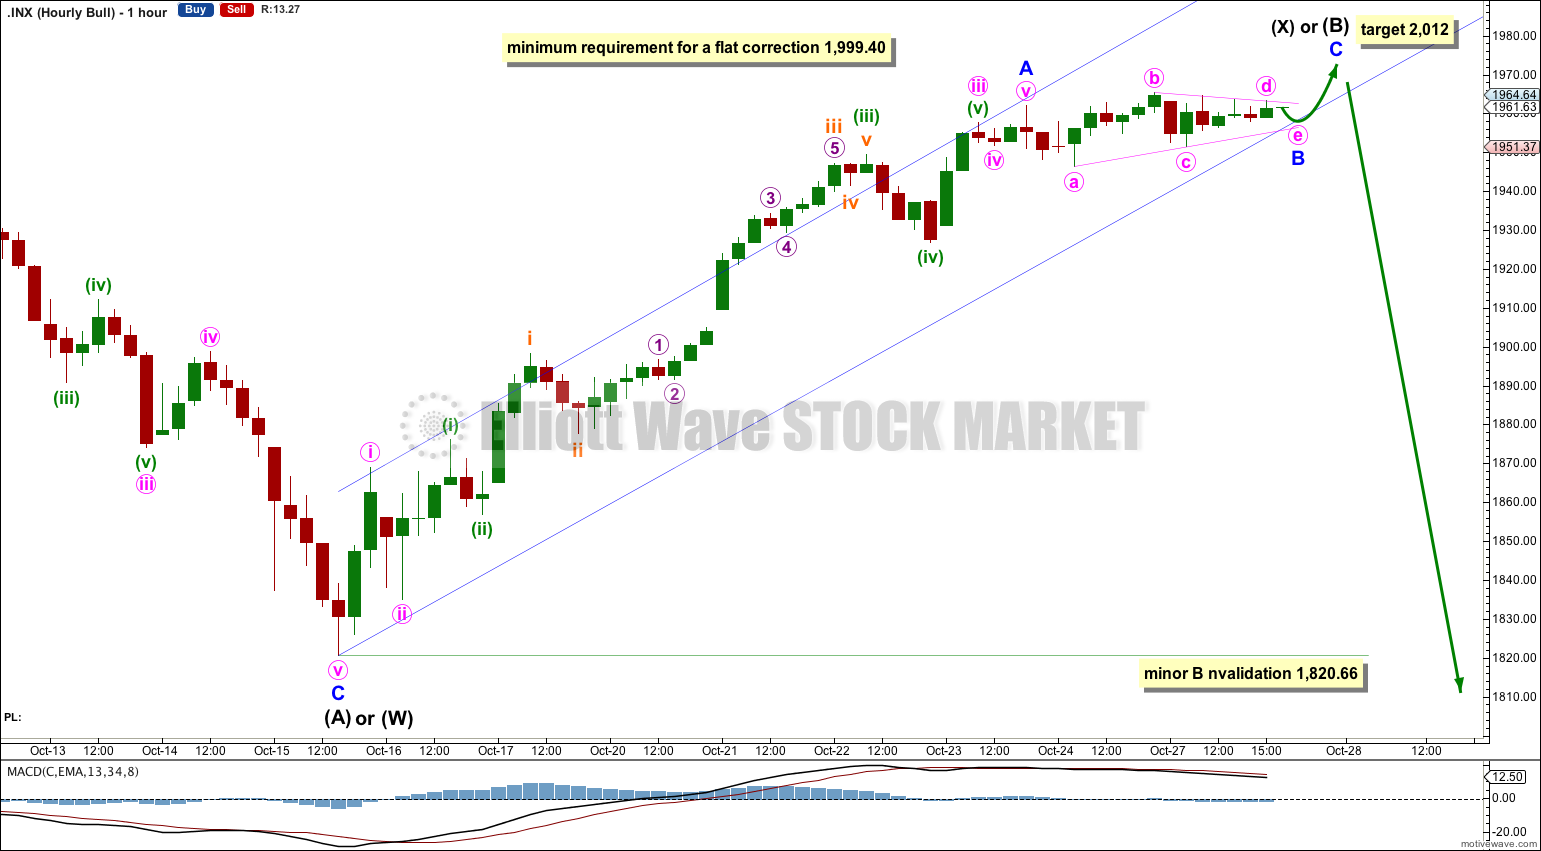
Both bull and bear wave counts see current upwards movement as a three wave zigzag. This hourly chart looks at an alternate labeling of the zigzag with the current incomplete triangle wave B within the zigzag.
Ratios within minor wave A are: minute wave iii is 3.92 points short of 2.618 the length of minute wave i, and minute wave v is 0.91 points short of 0.090 the length of minute wave iii.
Within minute wave iii there are no Fibonacci ratios between minuette waves (i), (iii) and (v).
Ratios within minuette wave (iii) are: subminuette wave iii is 2.79 points longer than 1.618 the length of subminuette wave i, and subminuette wave v has no Fibonacci ratio to either of subminuette waves iii or i.
Ratios within subminuette wave iii are: there is no Fibonacci ratio between micro waves 3 and 1, and micro wave 5 is 1.22 points short of equality with micro wave 1, and 1.5 points longer than 0.382 the length of micro wave 3.
At 2,012 minor wave B would reach 0.382 the length of minor wave A. This target is based on an estimate of where the triangle for minor wave B may end.
When the triangle ends draw a channel about upwards movement using Elliott’s technique for a correction: draw the first trend line from the start of this upwards wave to the end of the triangle, then place a parallel copy on the end of minor wave A. I would expect minor wave C to sit in the lower half of this channel. Once there is some upwards movement for minor wave C then subsequent downwards movement breaching the channel may indicate a trend change.
If upwards movement reaches 1,999.40 or above then primary wave 4 may be unfolding as a flat correction.
This analysis is published about 05:35 p.m. EST.