
Upwards movement was expected. This has been followed by a little downwards movement which still fits within this Elliott wave count perfectly.
Summary: At least one more short upwards wave is required to complete the structure. The target is 1,971.
Click on charts to enlarge.
Bearish Wave Count
The weekly charts show how to draw the double aqua blue trend lines. The lower trend line began back in 2011 has repeatedly been tested and is reasonably shallow which is highly technically significant. It has now been breached by more than 3% of market value indicating a trend change.
Because there is such a close Fibonacci ratio between intermediate waves (3) and (1) and intermediate wave (3) lasted 455 days, I am confident this labeling is correct. Also, intermediate wave (3) has the strongest upwards momentum within primary wave C. Therefore, the only piece of this wave count of which I am not confident is the structure within intermediate wave (5). Is it complete or not? This is why I have an alternate bearish wave count for you.
There is technical divergence between price and MACD at the weekly and daily chart levels. This indicates a trend change, but it does not indicate what degree the trend change should be.
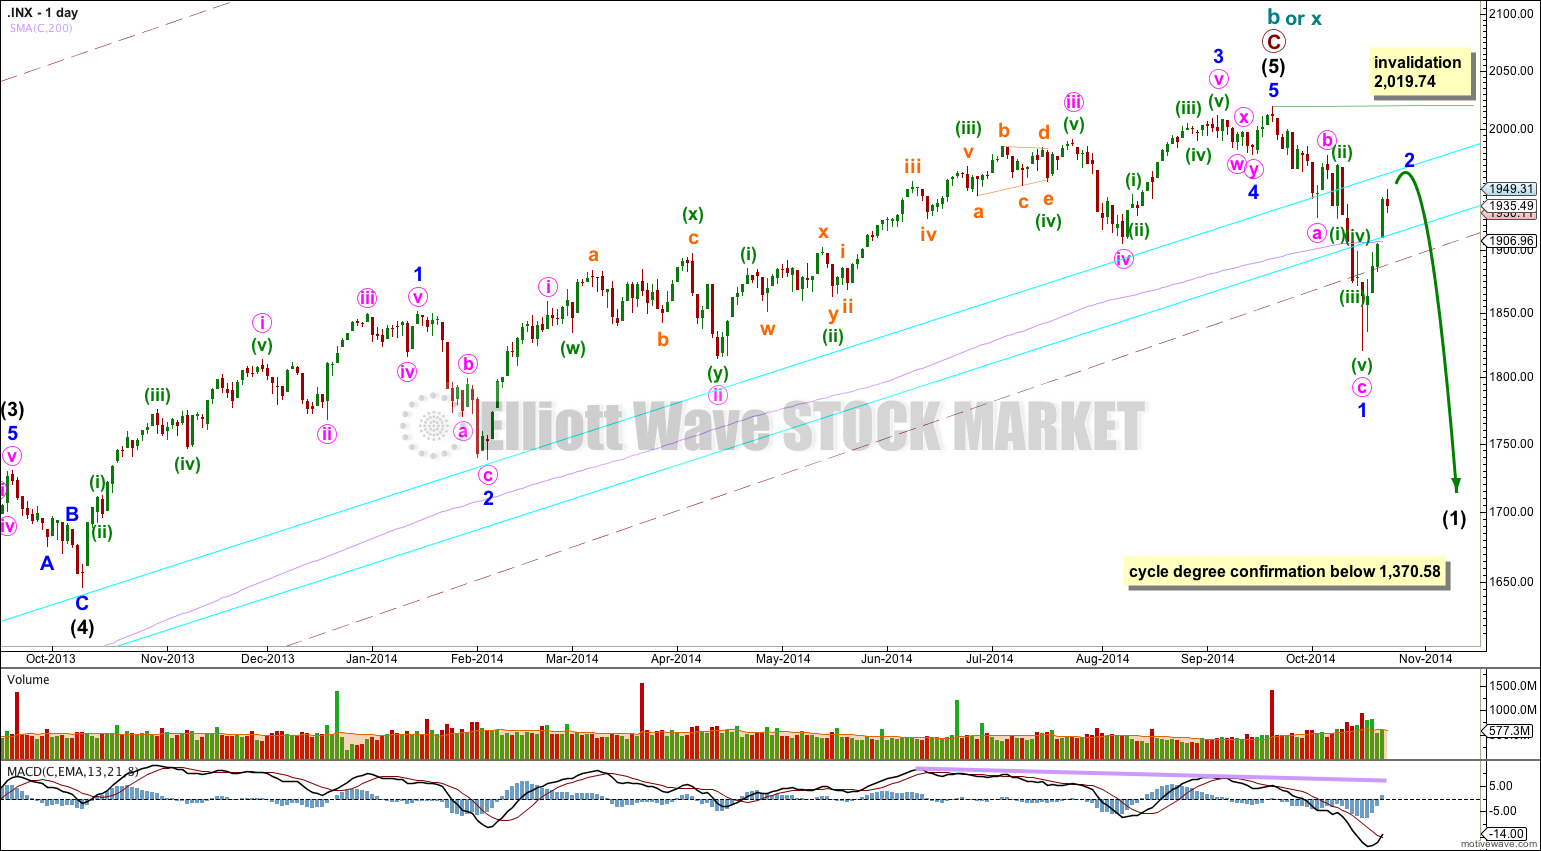
For the first time in five years the lower edge of the maroon – – – channel about cycle wave b (or x) was breached. This is significant.
The bear wave count sees a huge super cycle wave (II) incomplete as either an expanded flat correction, a combination, or a double flat.
If cycle wave b or x is now over then the first downwards wave for intermediate wave (1) is now most likely unfolding as a leading diagonal.
To have full confidence in this bearish wave count, and to discard the bullish wave count, I want to see three things happen:
1. A clear five down on the daily chart, with completion of intermediate wave (1).
2. Confirmation from NASDAQ with a new swing low for that market below 3,414,11.
3. A new low below 1,370.58 (although using structure as a guide the bull wave count would probably be discarded before this point).
When we have those three things I will have full confidence in this wave count.
This wave count differs from the alternate bear count below in the labeling of the subdivisions within intermediate wave (5). Here, there is no Fibonacci ratio between minor waves 3 and 1, and minor wave 5 is 0.89 points longer than 0.146 the length of minor wave 3. Minor wave 2 is a single zigzag lasting 14 days, and minor wave 4 is a double combination lasting 7 days.
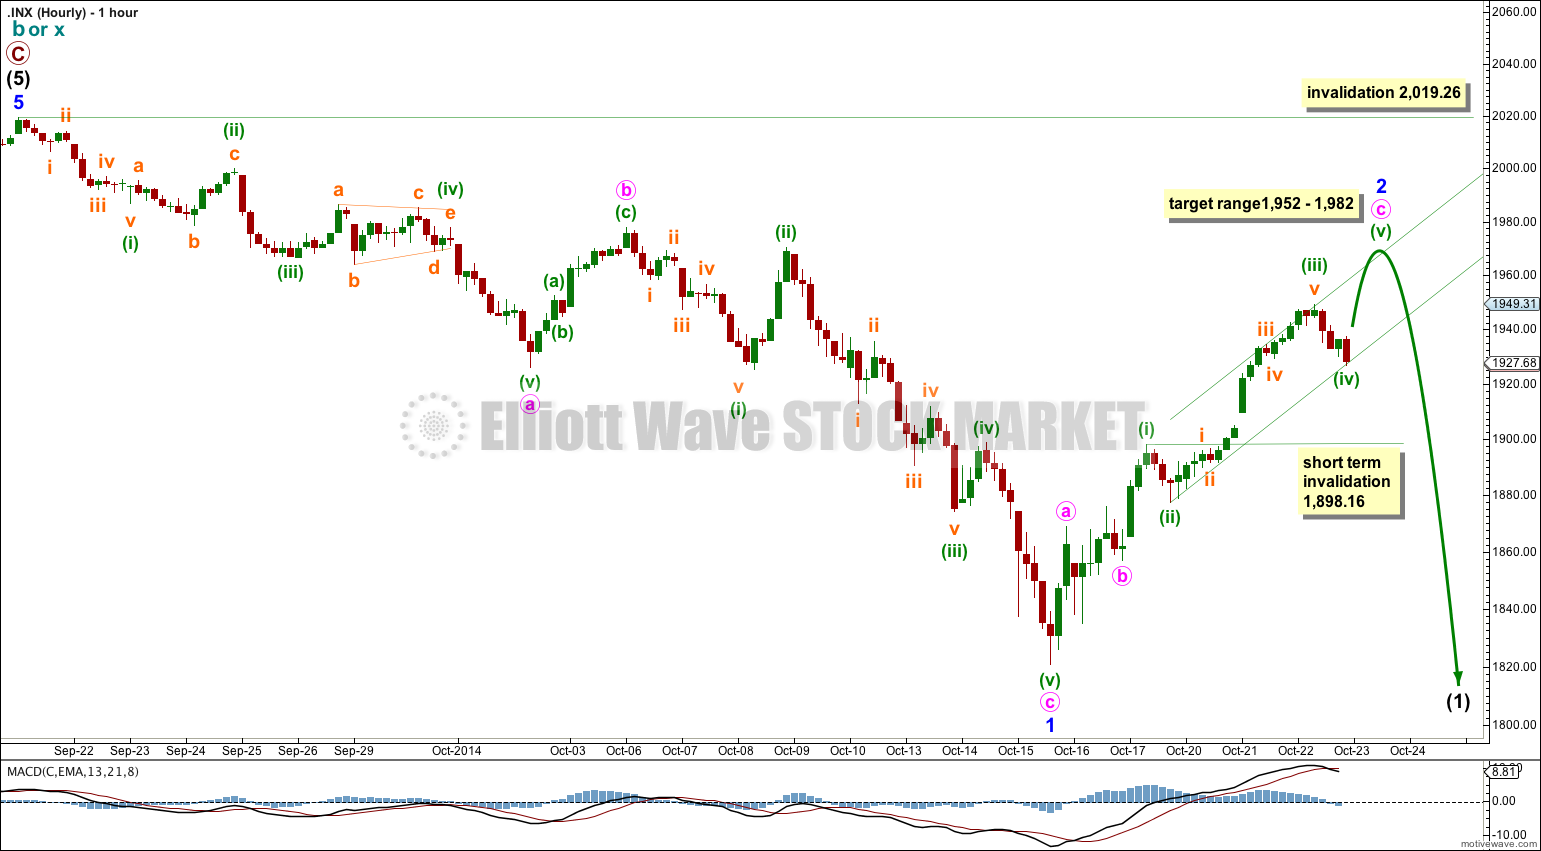
If intermediate wave (1) is unfolding as a leading diagonal then within it minor wave 1 may be a complete zigzag.
Second and fourth waves within diagonals most commonly end between 0.66 to 0.81 the length of the first and third waves. This gives a target range between 1,952 – 1,982. When minuette wave (iv) is complete then I would calculate a target upwards using a ratio of equality between minuette waves (i) and (v). I will expect minuette wave (v) to be 41.31 points in length, and this should see minor wave 2 end within the target range.
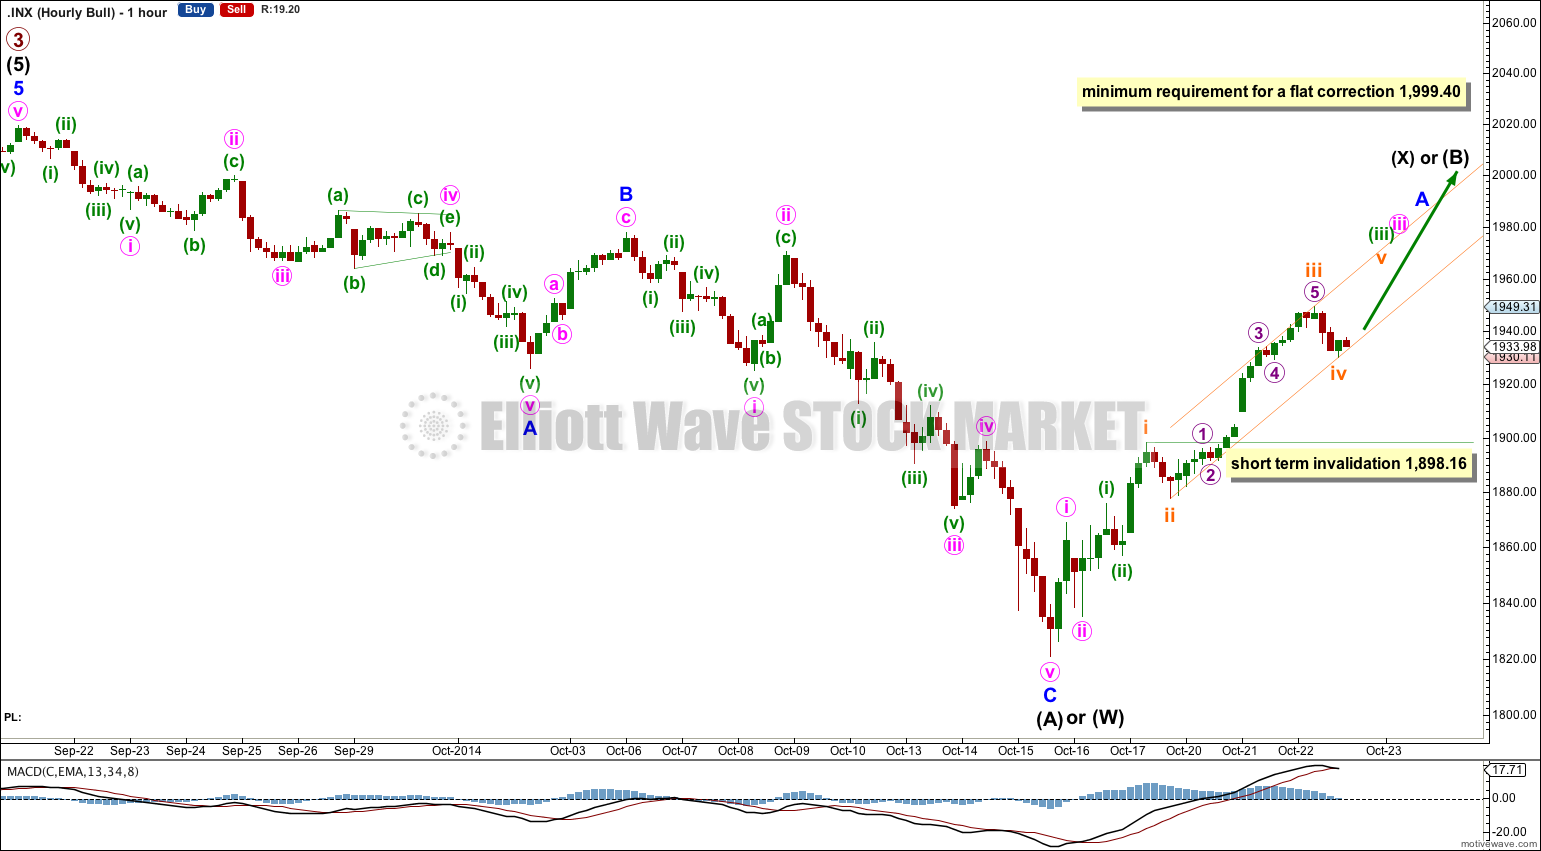
Downwards movement has breached the best fit channel on yesterday’s hourly chart, but the structure is incomplete.
Draw a channel using Elliott’s technique about minute wave c: draw the first trend line from the lows of minuette waves (ii) to (iv), then place a parallel copy on the high of minuette wave (iii). This channel should show where minuette wave (v) ends, about the upper edge. Afterwards it should show when minor wave 2 is over with a clear breach to the downside. As minuette wave (iv) moves lower the channel will have to be redrawn.
Minuette wave (iv) may not move into minuette wave (i) price territory below 1,898.16.
Minor wave 2 may not move beyond the start of minor wave 1 above 2,019.26.
Alternate Bearish Wave Count
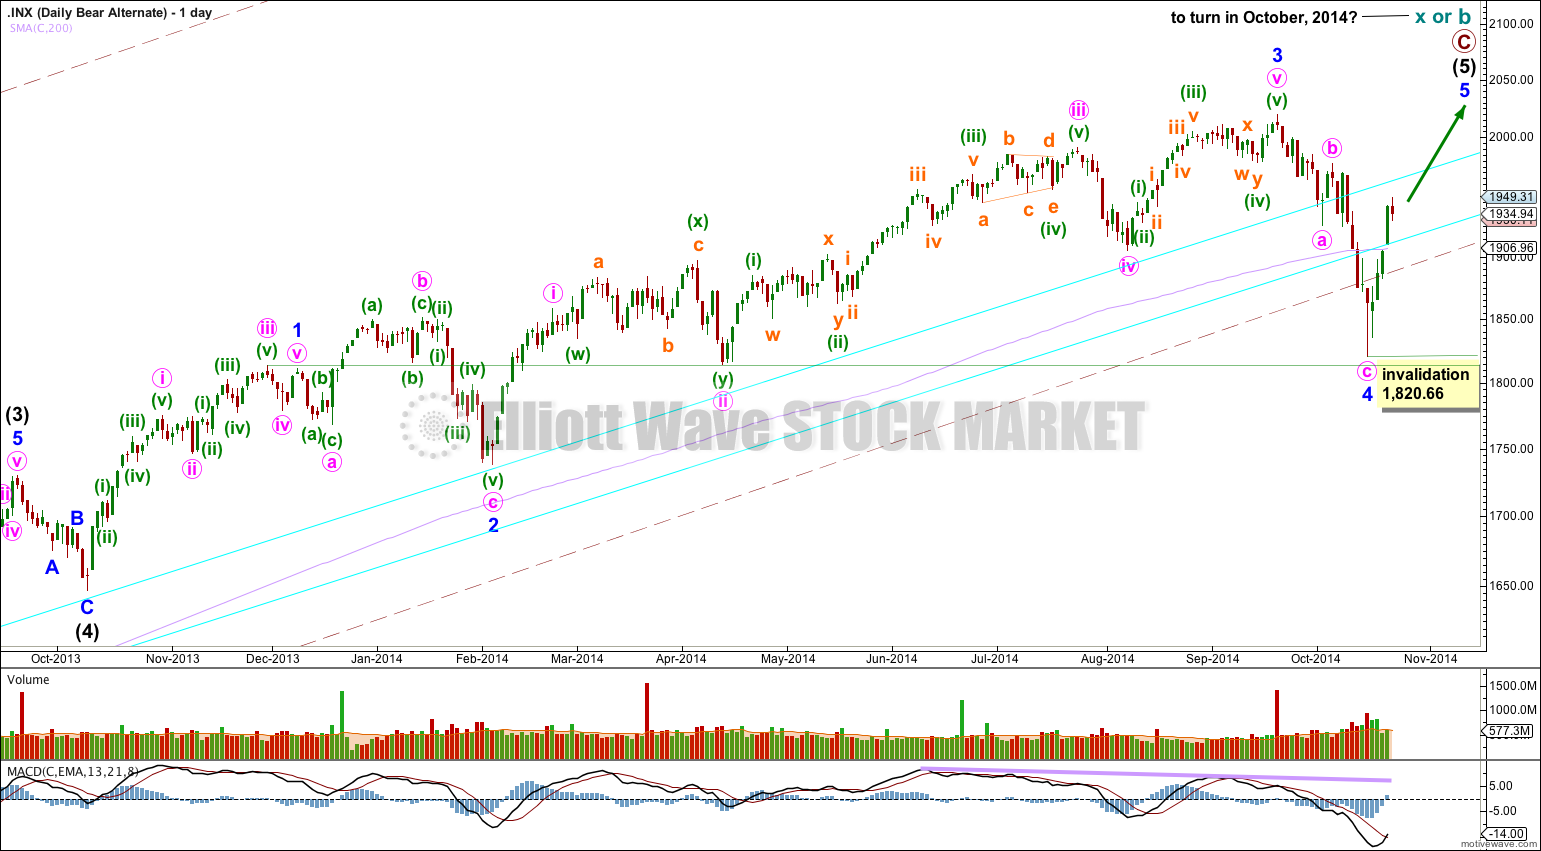
I am confident that I have the labeling of intermediate waves (3) and (4) correct. Intermediate wave (3) lasted 455 days and is just 0.76 short of 2.618 the length of intermediate wave (1). Intermediate wave (3) has the strongest upwards momentum within primary wave C.
With this wave count minor wave 3 is 14.29 points longer than 1.618 the length of minor wave 1. Minor wave 2 is an expanded flat lasting 39 days and minor wave 4 is a zigzag lasting 18 days, and the proportions between minor waves 2 and 4 are better.
The problem within this wave count is at the end of minor wave 3: within it minute wave v looks like a three wave structure and not a five because minuette waves (ii) and (iv) are grossly disproportionate.
Because there is a Fibonacci ratio between minor waves 3 and 1 I would not expect to see a Fibonacci ratio for minor wave 5 to either of 3 or 1. If minor wave 5 only reached equality with minor wave 1 it would be truncated. Minor wave 5 is most likely to make a new high above minor wave 3 at 2,019.26, but it does not have to. It only needs to subdivide as a five wave structure.
This wave count could allow for an end to minor wave 5 during this month, and an RSI failure swing on the monthly chart. If that happens it would have a very typical look.
Bullish Wave Count
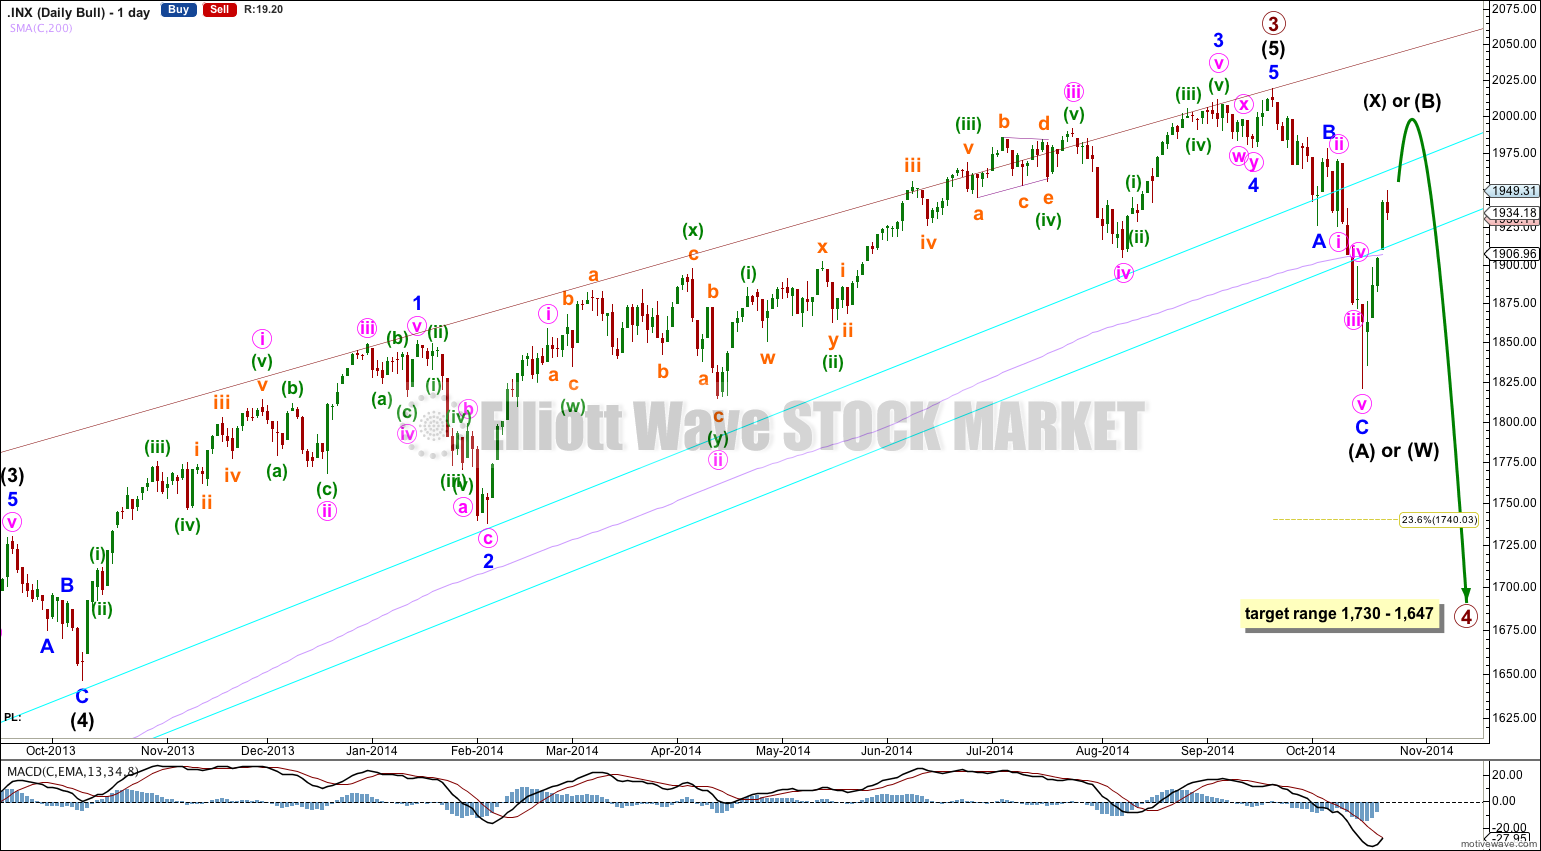
Primary wave 4 may end within the price territory of the fourth wave of one lesser degree. Intermediate wave (4) price territory is from 1,730 to 1,647.
Primary wave 2 was a 41% zigzag correction. I would expect primary wave 4 to show alternation in structure so most likely it will be a flat, combination or triangle. All of these structures may include a new price extreme beyond the start of intermediate wave (A), so they could see a new high.
Primary wave 2 lasted a Fibonacci 13 weeks. Zigzags tend to be more brief structures. I would expect primary wave 4 to last at least 13 weeks, and it may last up to a Fibonacci 21 weeks if it is a more time consuming structure like a combination or triangle.
It is too early to label primary wave 4 as over because it has lasted only 4 weeks and would be a zigzag so have no structural alternation with the zigzag of primary wave 2.
However, my degree of labeling for this downwards movement may be one degree too high. If we see a five down complete then I would move the degree of labeling for this bull wave count down one degree within primary wave 4, which could be only minor wave A of a zigzag for intermediate wave (A).
Because primary wave 4 is most likely to be a flat, triangle or combination, the first movement down is most likely to subdivide as a three wave structure.
If intermediate wave (A) is over then primary wave 4 may be a flat or triangle. Intermediate wave (B) may make a new high above the start of intermediate wave (A) at 2,019.26 as in an expanded flat or running triangle.
If primary wave 4 is a combination then the first structure in the double may be a completed zigzag for intermediate wave (W).
Upwards movement for this bullish wave count must be a three wave structure.
On this bullish wave count I am looking at a different labeling for the upwards zigzag. Minor wave A may be incomplete.
Within minor wave A upwards subminuette wave iv may not move into subminuette wave i price territory below 1,898.16.
If primary wave 4 is a flat correction then within it intermediate wave (B) must reach a minimum 90% length of intermediate wave (A) at 1,999.40.
If primary wave 4 is a double combination then there is no minimum requirement for intermediate wave (X).
This analysis is published about 04:22 p.m. EST.
Hi. Lara
Couldn’t minor wave 3 have started?
The market answered your question while I slept.
No, price moved higher.