
Downwards movement invalidated the last wave count. FTSE may have had a cycle degree trend change, but this requires confirmation. If it is correct it should be confirmed within two weeks.
Click on charts to enlarge.
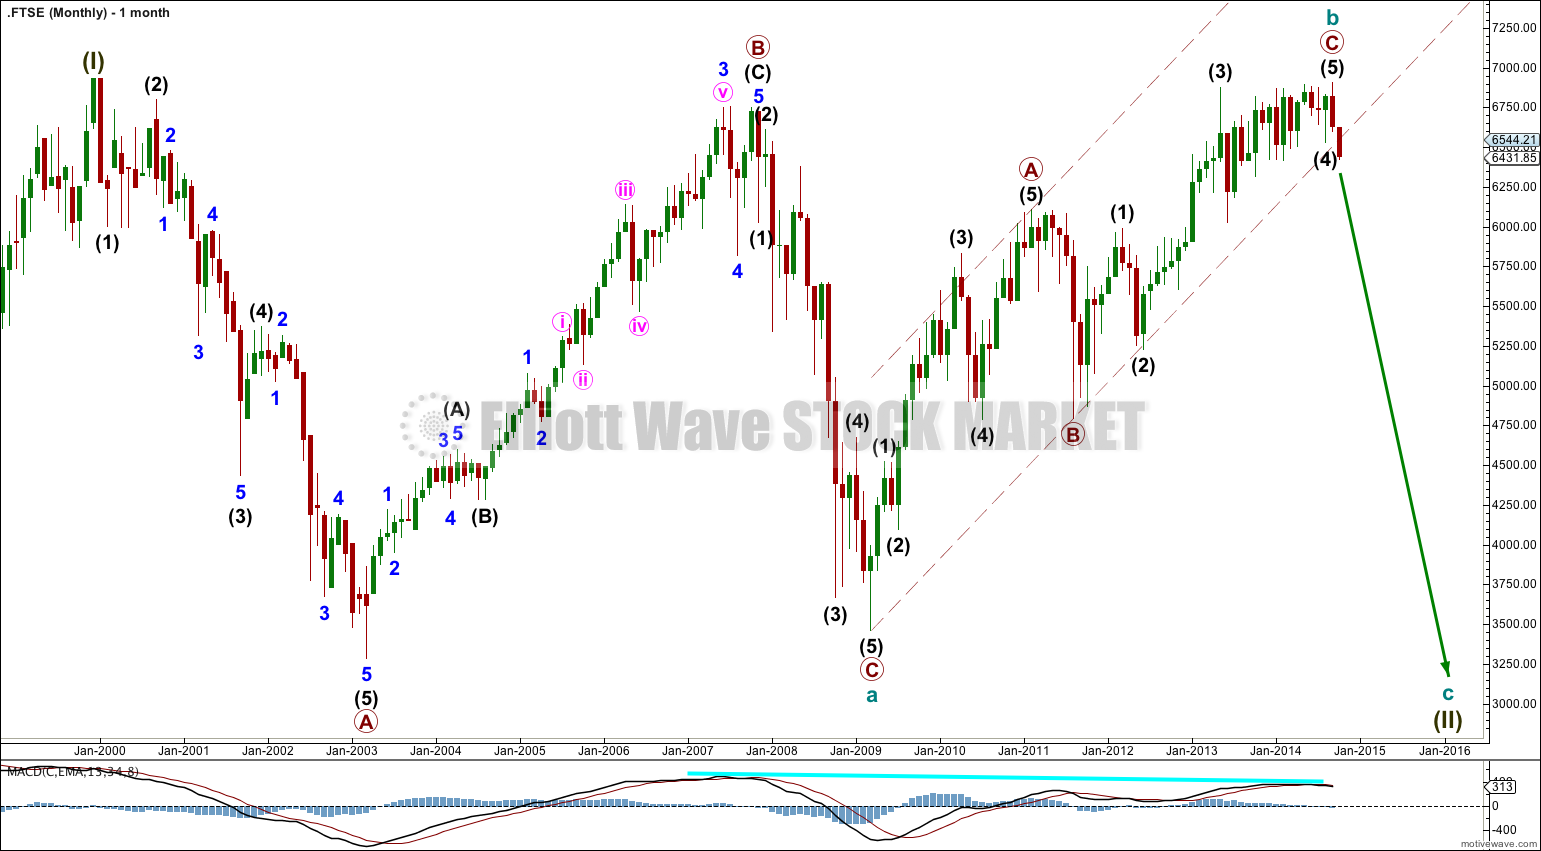
The bigger picture sees FTSE in a huge correction for a super cycle wave (II).
Super cycle wave (II) may be either a regular flat correction (labeled cycle a, b, c) or it may be a double flat or combination (labeled cycle w, x and y).
A regular flat correction would expect a five wave structure downwards for cycle wave c to move at least a little below the end of cycle wave a at 3,460.71 to avoid a truncation. Cycle wave c would be expected to last from one to several years, with a shorter time frame more likely.
A double flat or combination would expect a three wave structure downwards for cycle wave y to end about the same level as cycle wave a at 3,460.71. Cycle wave y would be expected to last from one to several years, with a longer time frame more likely. It could look like a repeat of cycle wave a.
There is divergence at the monthly chart level with MACD which supports this wave count.
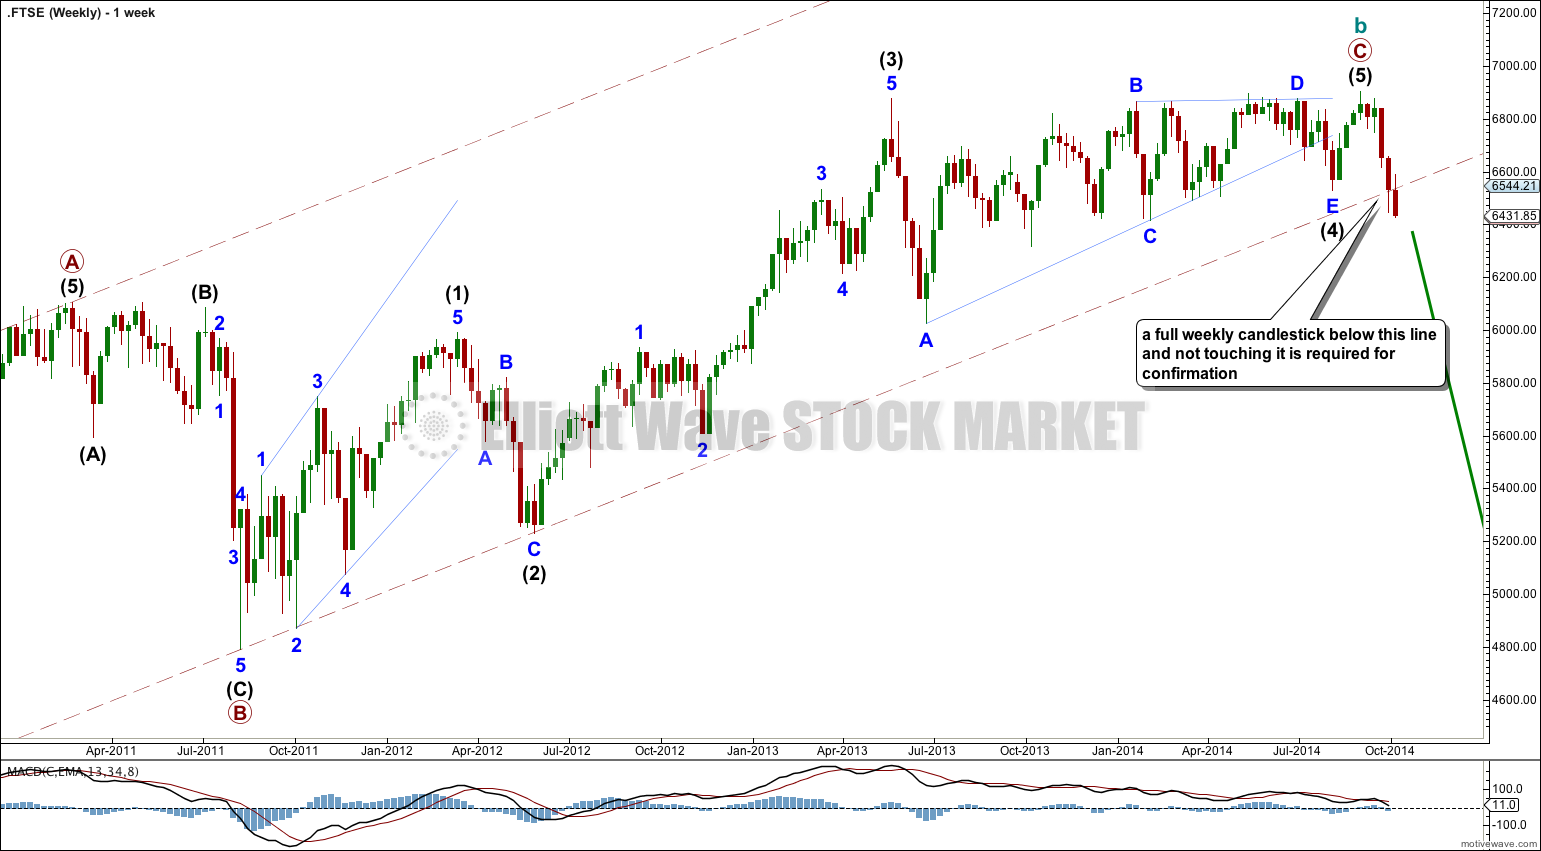
Cycle wave b (or x) subdivides as a zigzag and is complete, but this trend change absolutely requires confirmation before any confidence may be had in this wave count.
Within cycle wave b (or x) there is no Fibonacci ratio between primary waves A and C.
Ratios within primary wave C are: there is no Fibonacci ratio between intermediate waves (3) and (1), and intermediate wave (5) is 12.29 points short of 0.236 the length of intermediate wave (3).
This is a huge trend change at cycle degree. I would only have confidence in this wave count when there is a full weekly candlestick below the lower edge of the maroon – – – channel, and not touching its lower trend line. Only when this confirmation is present will I calculate downwards targets for you.
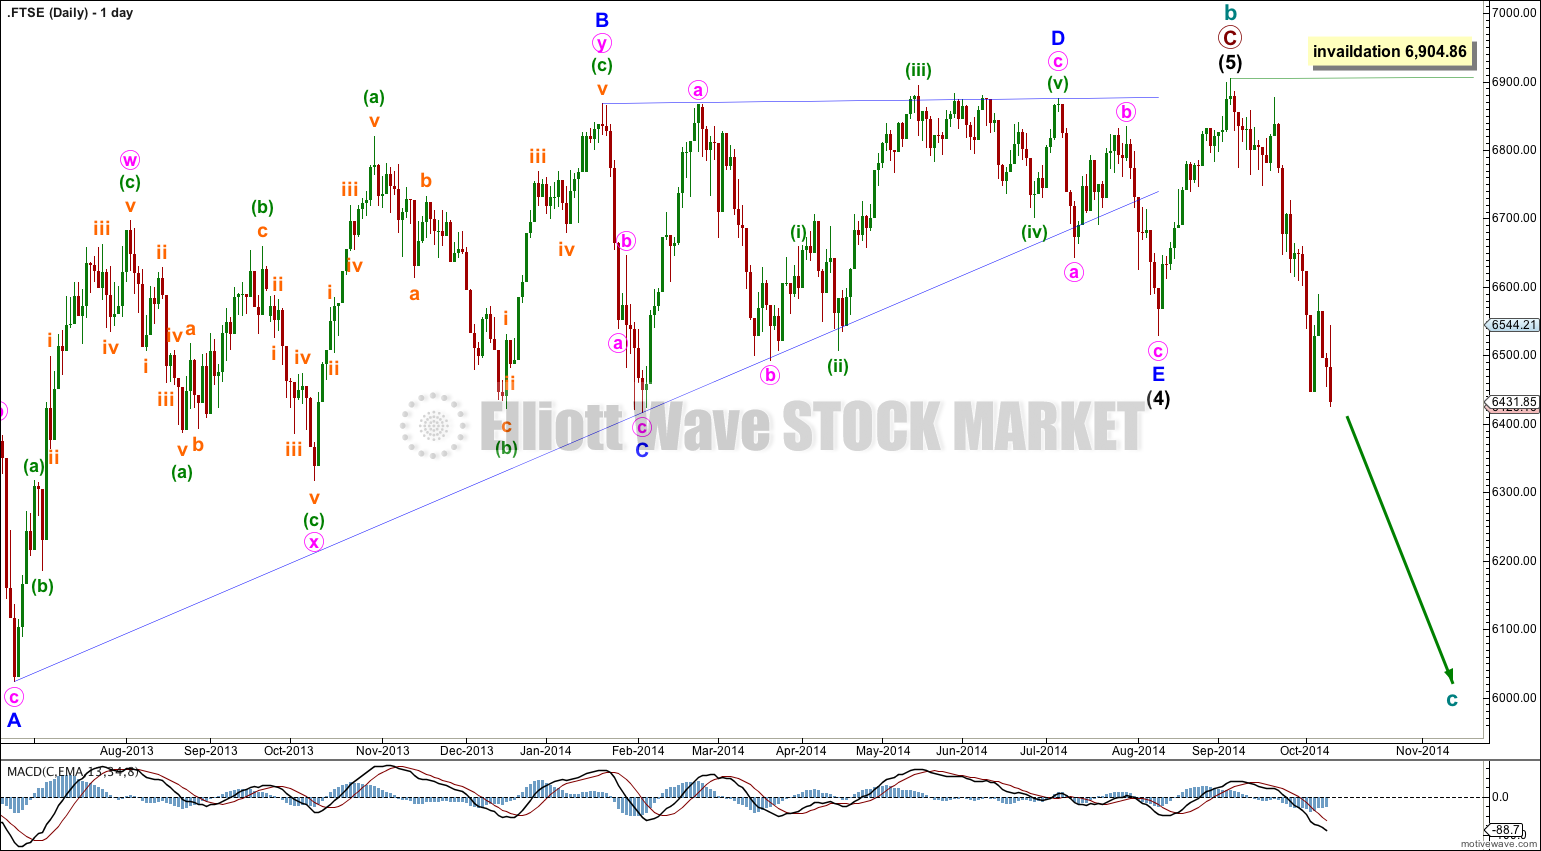
I had expected intermediate wave (5) to continue higher, but it may have ended as a very short brief fifth wave which is common following barrier triangles.
I have adjusted the wave count within intermediate wave (4) to see the barrier triangle ending later. This changes the beginning and so end of intermediate wave (5).
If there has been a trend change then no second wave correction may move beyond the start of its first wave above 6,904.86.