
Downwards movement for Thursday’s session was expected.
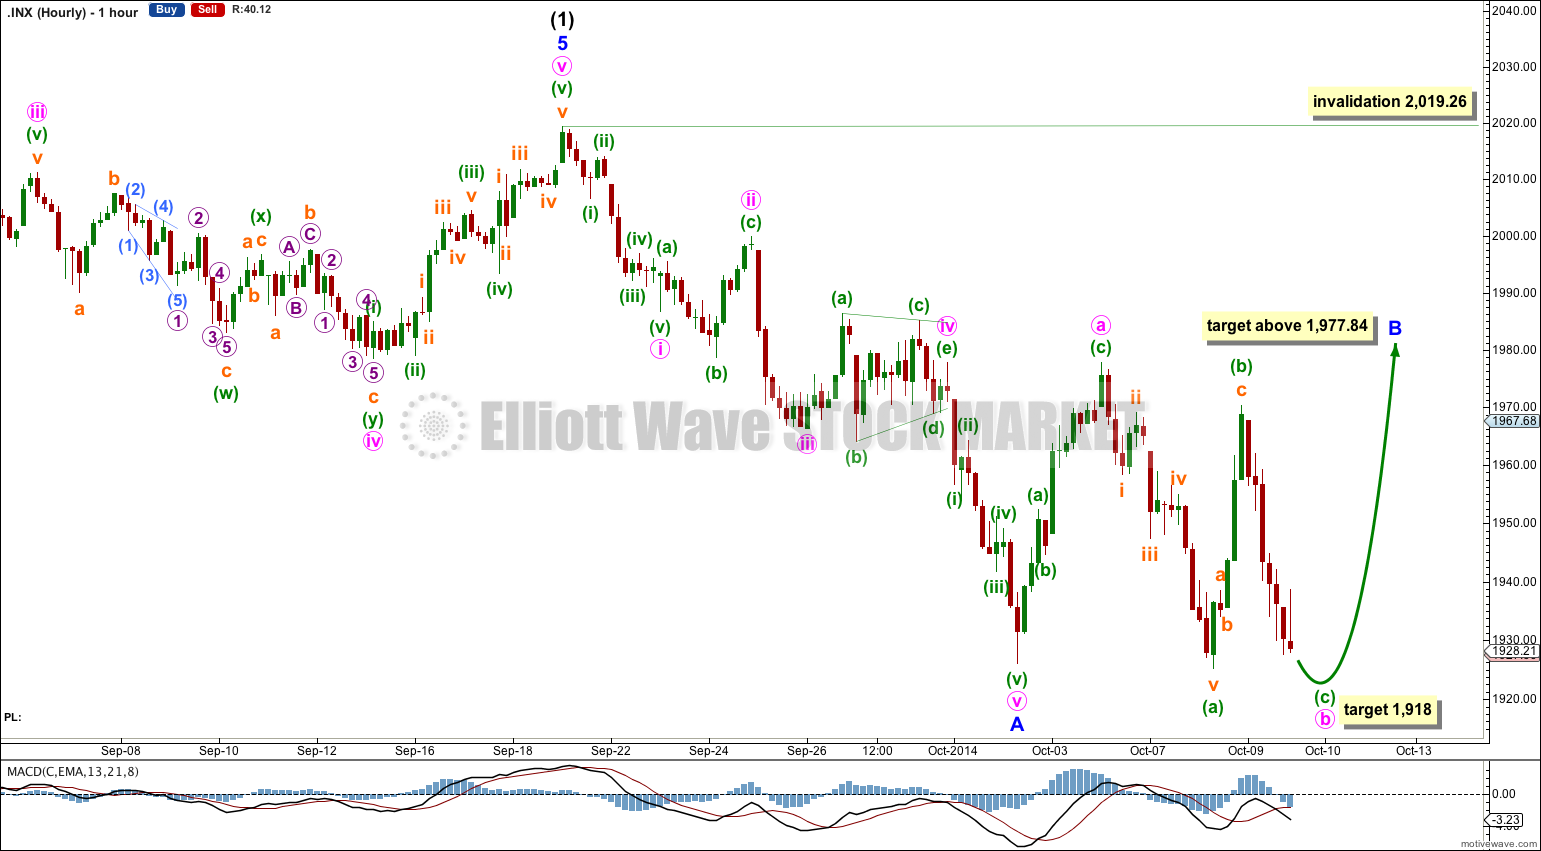
Summary: It is most likely that intermediate wave (1) or cycle wave b (for the bearish wave count) is over. In the short term I expect a little more downwards movement to 1,918, then upwards movement to a new high above 1,977.84.
Click on charts to enlarge.
Bullish Wave Count
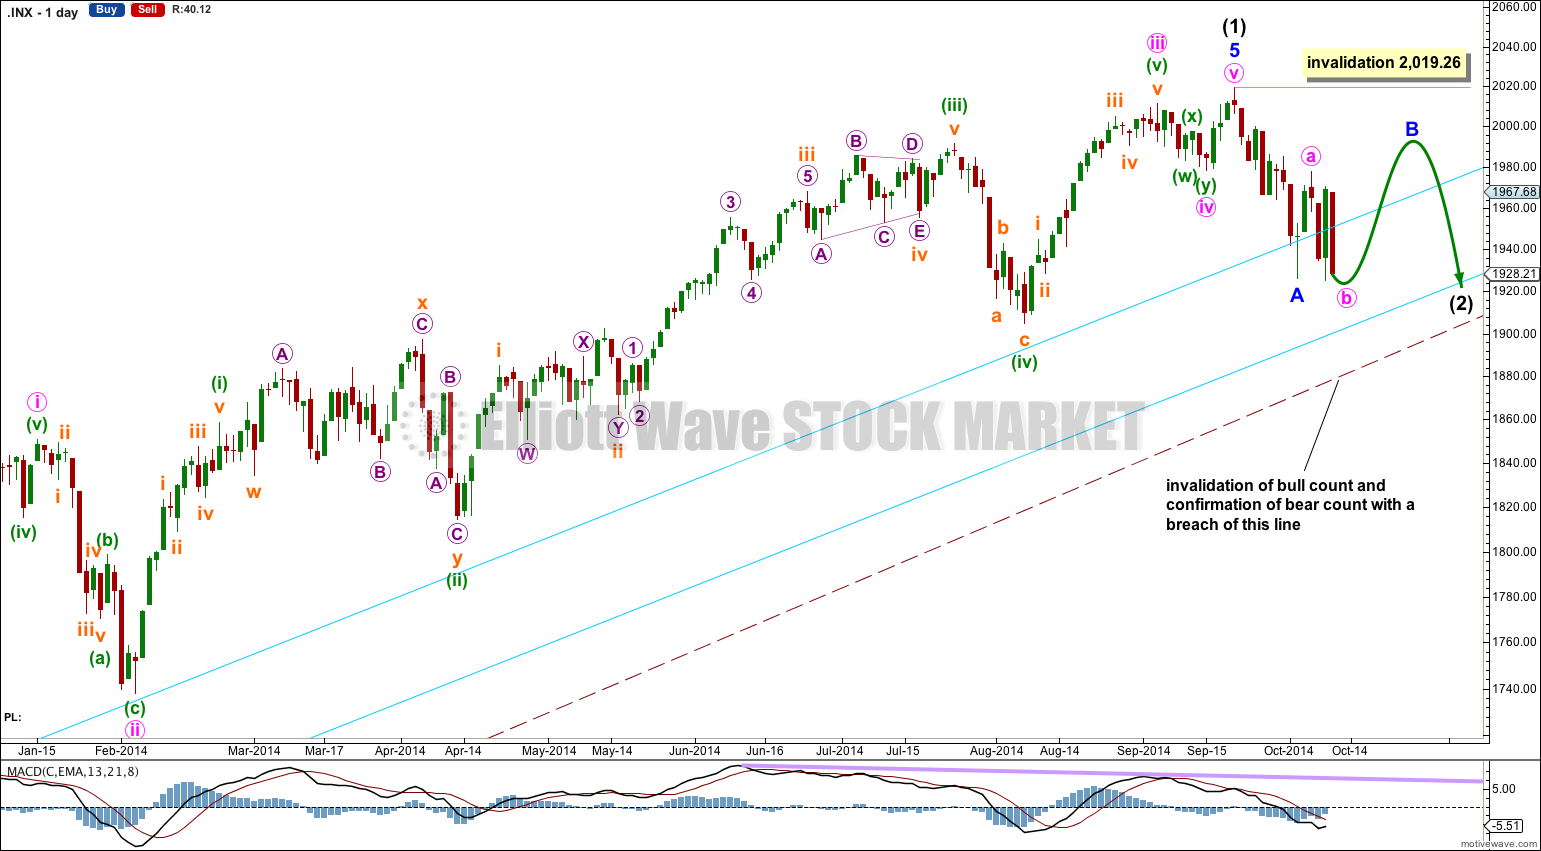
The aqua blue trend lines are critical. Draw the first trend line from the low of 1,158.66 on 25th November, 2011, to the next swing low at 1,266.74 on 4th June, 2012. Create a parallel copy and place it on the low at 1,560.33 on 24th June, 2013. While price remains above the lower of these two aqua blue trend lines we must assume the trend remains upwards. This is the main reason for the bullish wave count being my main wave count.
There are a couple of things about this wave count of which I am confident. I see minor wave 3 within intermediate wave (1) as over at 1,729.86 (19th September, 2013). It has the strongest upwards momentum and is just 0.76 longer than 2.618 the length of minor wave 1. At 455 days duration this is a remarkably close Fibonacci ratio. The subdivisions within it are perfect.
Minor wave 5 is 20.24 points longer than 1.618 the length of minor wave 1. This is a 5.4% variation. I consider any variation less than 10% to be acceptable.
Ratios within minor wave 5 are: there is no Fibonacci ratio between minute waves i and iii, and minute wave v is 0.89 points longer than 0.146 the length of minute wave iii.
Minute wave ii is a single zigzag lasting 14 days. Minute wave iv may be seen as a double combination lasting 7 days.
The large maroon – – – channel is copied over from the weekly chart. It is drawn in exactly the same way on bull and bear wave counts. For the bull wave count this channel is termed a base channel about primary waves 1 and 2. A lower degree second wave should not breach the lower edge of a base channel drawn about a first and second wave one or more degrees higher. The lower maroon – – – trend line differentiates the bull and bear wave counts at cycle degree and monthly chart level.
Intermediate wave (2) is expected to be a very shallow second wave correction. The support provided by the base channel should be stronger than the tendency of a second wave to be deep. Intermediate wave (1) lasted 35 months. Intermediate wave (2) should not be nearly as long in duration; I would expect it to last only a few weeks, maybe five or eight weeks in total. So far it is in its third week.
So far within intermediate wave (2) minor wave A subdivides as a five wave impulse, so this second wave is most likely a zigzag. Within a zigzag minor wave B may not move beyond the start of minor wave A above 2,019.26.
Minor wave B looks like it is unfolding as a flat correction or a combination. Within it minute wave a subdivides as a three, and minute wave b is an incomplete three.
Within minute wave b it is extremely likely that minuette wave (c) will make at least a slight new low below the end of minuette wave (a) at 1,925.25 to avoid a truncation. The target remains the same at 1,918 where minuette wave (c) would reach equality in length with minuette wave (a).
When minute wave b is a completed three then I would expect a five up for minute wave c to be extremely likely to move at least slightly above the end of minute wave a at 1,977.84 to avoid a truncation. When minute wave b is complete then I can calculate a target upwards for minute wave c. I cannot do that today for you.
When minor wave B is a completed corrective structure then I will calculate a target downwards for minor wave C to complete this correction for intermediate wave (2). I would look for this to end close to the lower of the two aqua blue trend lines on the daily chart. I would not expect intermediate wave (2) to breach this trend line.
Bearish Wave Count
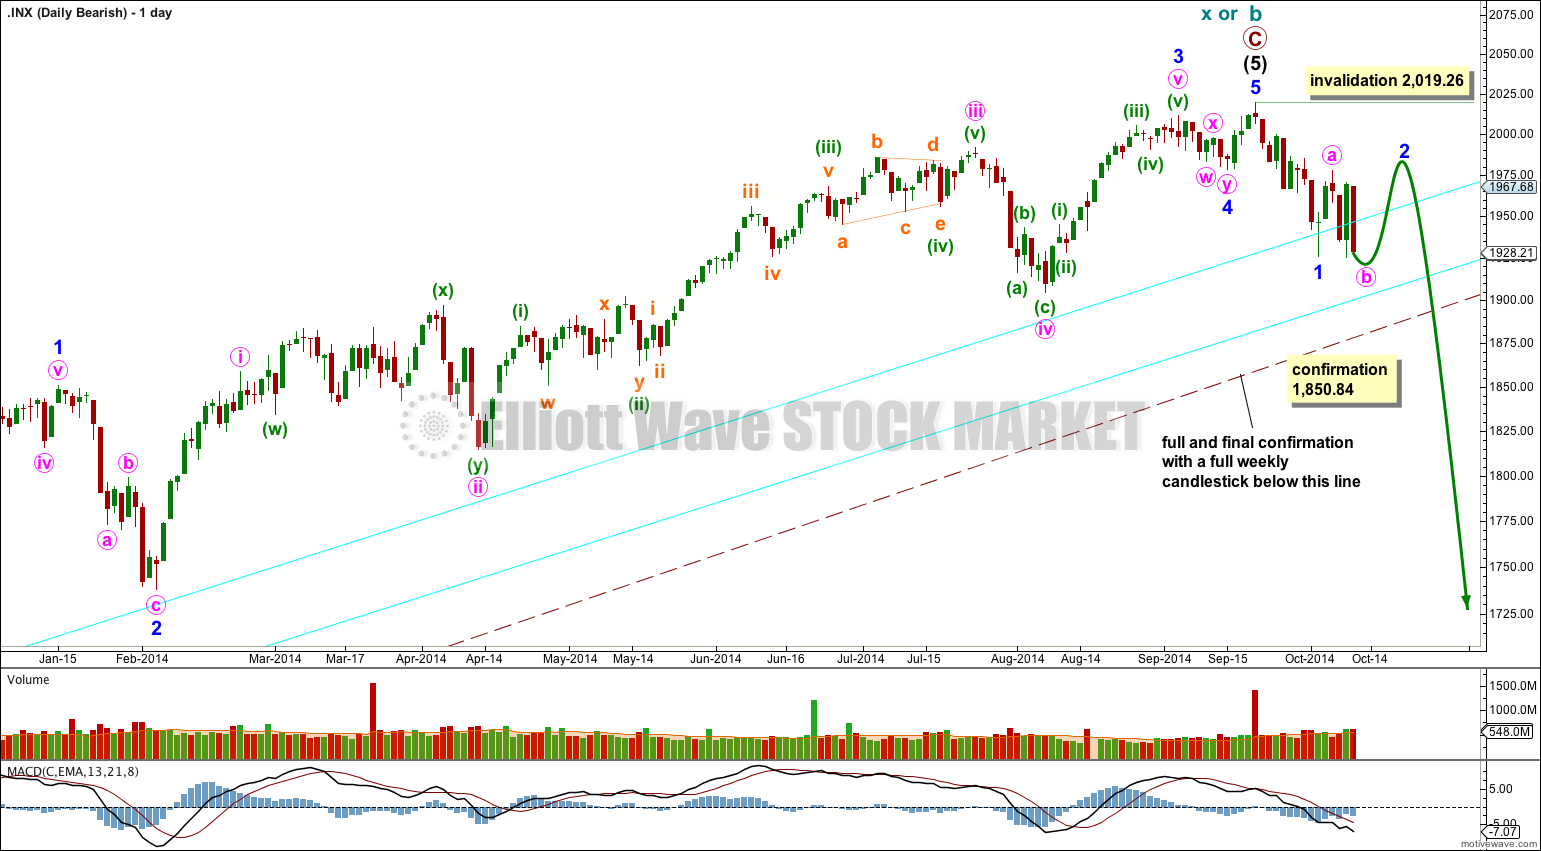
To see the difference between bull and bear wave counts they must be viewed on monthly charts here and video here.
The differentiation between the bull and bear wave count is the maroon – – – channel. For the bear wave count this channel is a corrective channel about cycle wave b or x zigzag. When a channel drawn about a zigzag is breached that provides trend channel confirmation that the zigzag is over and the next wave is underway.
If this trend line is breached by a full weekly candlestick below it and not touching it then this bear wave count would be my main wave count and I would then calculate downwards targets.
We should always assume the trend remains the same until proven otherwise; the trend is your friend. While price remains above the lower maroon – – – trend line I will assume that the S&P 500 remains within a bull market.
This analysis is published about 07:16 p.m. EST.