
A slight new low fitted the alternate hourly Elliot wave count and invalidated the main hourly Elliott wave count.
Summary: I have more confidence today that the correction is over. I expect about two to four weeks of upwards movement to a target at 2,042.
Click on charts to enlarge.
Bullish Wave Count
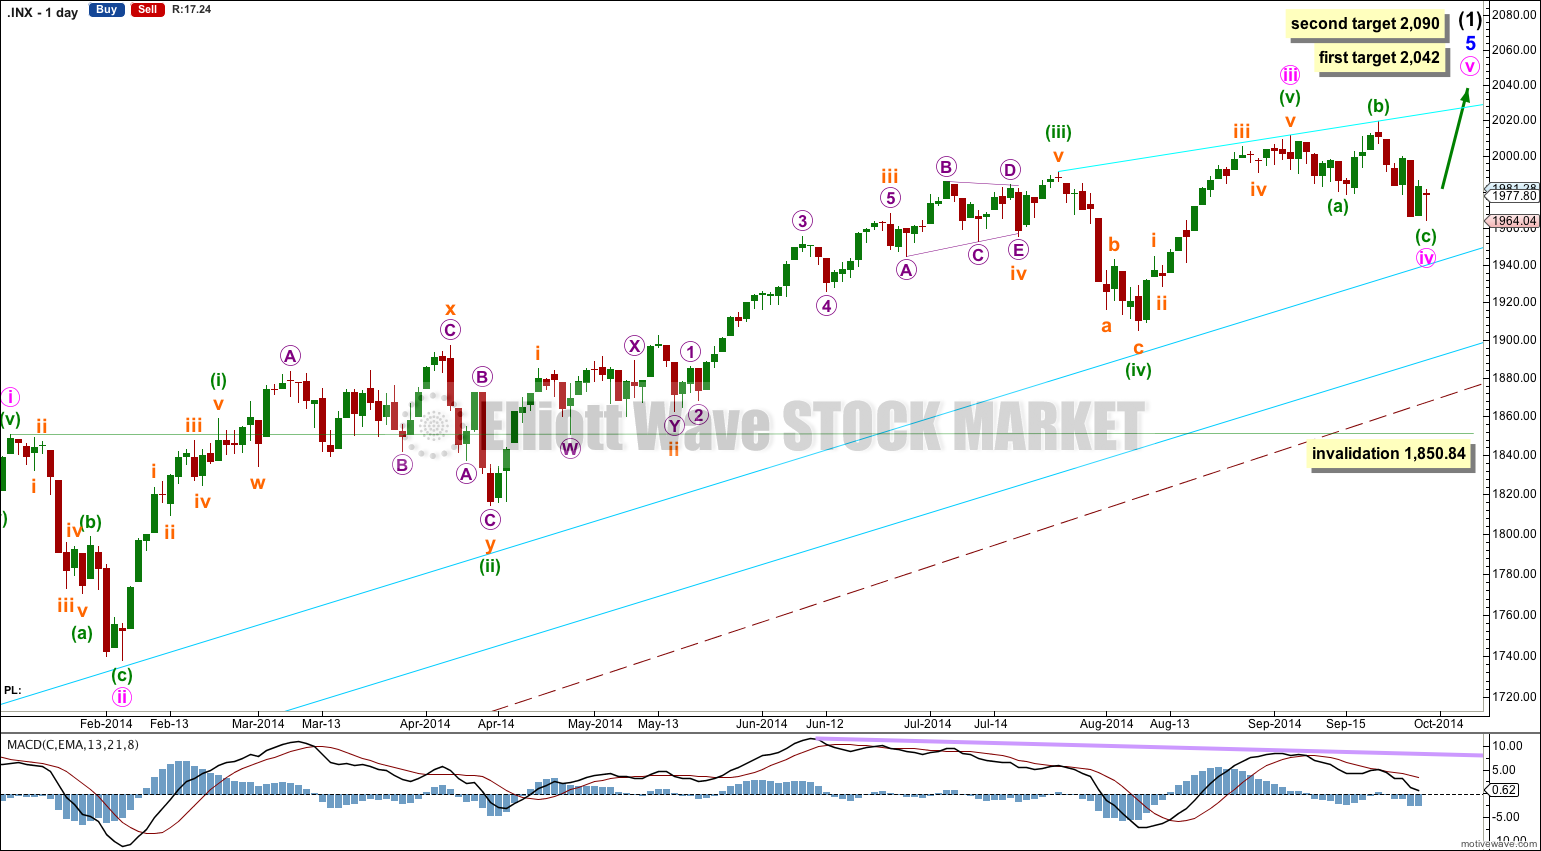
The aqua blue trend lines are critical. Draw the first trend line from the low of 1,158.66 on 25th November, 2011, to the next swing low at 1,266.74 on 4th June, 2012. Create a parallel copy and place it on the low at 1,560.33 on 24th June, 2013. While price remains above the lower of these two aqua blue trend lines we must assume the trend remains upwards. This is the main reason for the bullish wave count being my main wave count.
There are a couple of things about this wave count of which I am confident. I see minor wave 3 within intermediate wave (1) as over at 1,729.86 (19th September, 2013). It has the strongest upwards momentum and is just 0.76 longer than 2.618 the length of minor wave 1. At 455 days duration this is a remarkably close Fibonacci ratio. The subdivisions within it are perfect. If this is correct then minor wave 4 ends at 1,646.47 and this is where minor wave 5 begins.
Within minor wave 5 there is no Fibonacci ratio between minute wave i and iii. This makes it more likely that minute wave v will exhibit a Fibonacci ratio to either of i or iii. Within minor wave 5 minute waves i and iii are both extended. This means that minute wave v may not extend and should be relatively short and brief. At 2,042 minute wave v would reach 0.382 the length of minute wave i. The next target is at 2,090 where minute wave v would reach 0.618 the length of minute wave i.
The first target has a higher probability, and may even be slightly too high. A trend line drawn at the upper range of recent movement shows minute wave v may end close to 2,042. This trend line may be slightly overshot with a final push upwards before the market turns.
I would expect to see more divergence between price and MACD develop over coming weeks as minute wave v unfolds.
I would expect minute wave v to be relatively brief and should be over within about two to four weeks.
Minute wave ii lasted 14 sessions and was a relatively deep 55% zigzag correction. Minute wave iv is showing alternation as a shallow flat correction now lasting 17 sessions.
The large maroon – – – channel is copied over from the weekly chart. It is drawn in exactly the same way on bull and bear wave counts. For the bull wave count this channel is termed a base channel about primary waves 1 and 2. A lower degree second wave should not breach the lower edge of a base channel drawn about a first and second wave one or more degrees higher. The lower maroon – – – trend line differentiates the bull and bear wave counts at cycle degree and monthly chart level.
Main Hourly Wave Count
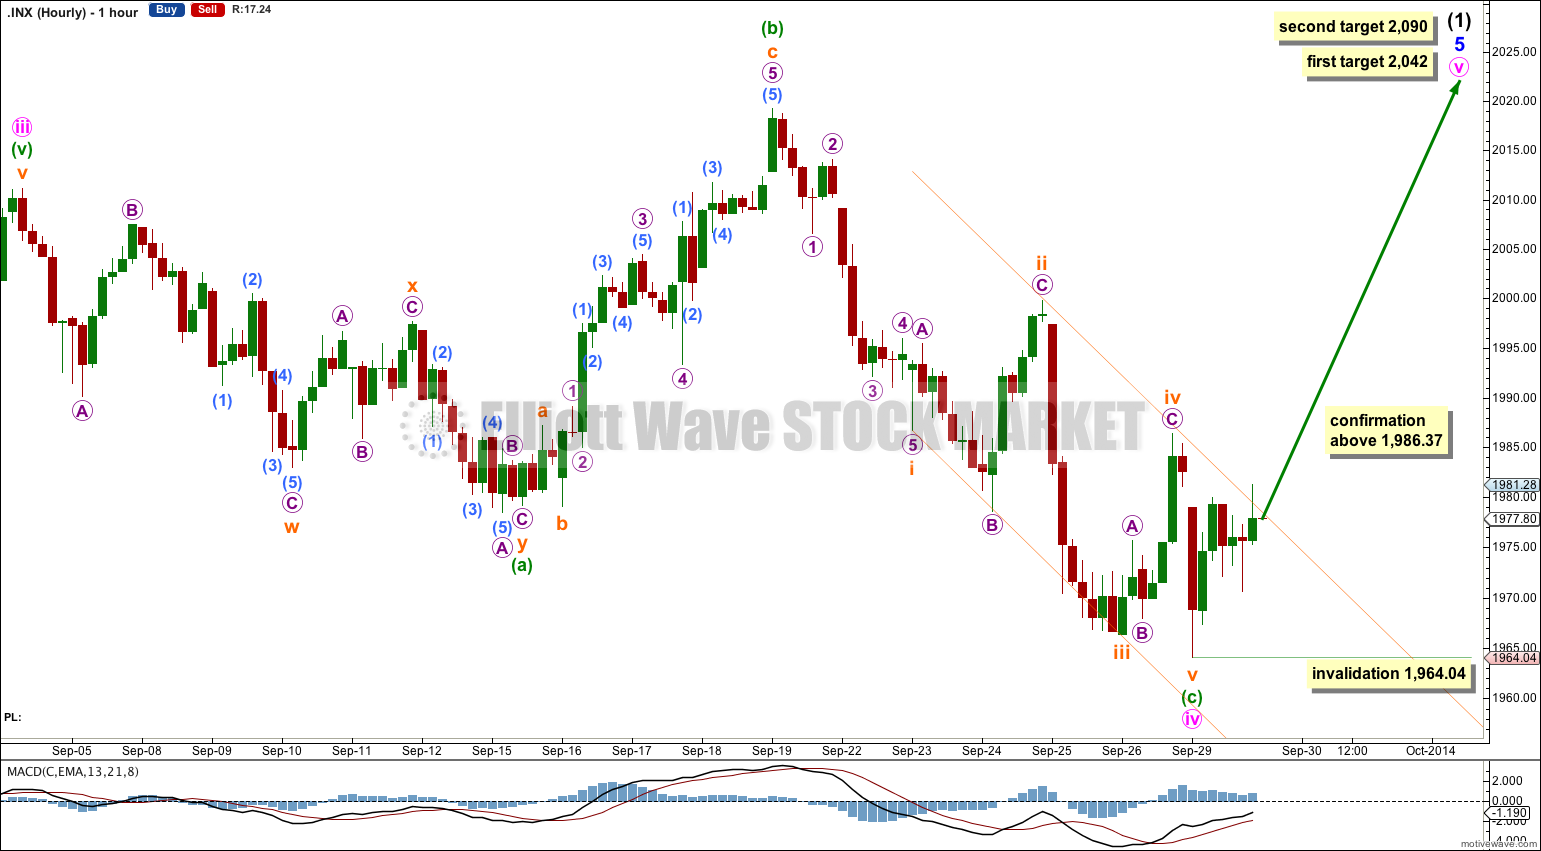
I have adjusted the wave count within minuette wave (c). This has a much better fit, good ratios, and fits within its Elliott channel perfectly. I am more confident that this part of the analysis is now right.
Minuette wave (c) is 3.52 longer than 1.618 the length of minuette wave (a).
Ratios within minuette wave (c) are: subminuette wave iii is just 1.01 longer than equality with subminuette wave i, and subminuette wave v is 1.58 longer than 0.618 the length of subminuette wave iii.
A channel about minuette wave (c) is drawn using Elliott’s first technique: draw the first trend line from the ends of subminuette waves i to iii, then place a parallel copy on the end of subminuette wave ii. This perfectly shows where subminuette wave iv ended. When this channel is clearly breached by upwards movement we shall have trend channel confirmation that minuette wave (c) is over and the next wave, minute wave v upwards, is underway. Expanded flat corrections do not fit into parallel channels, so a channel drawn about their C waves is used to determine when they are over.
Movement above 1,986.37 would invalidate the alternate hourly wave count below and provide price confirmation for this main wave count.
Alternate Hourly Wave Count
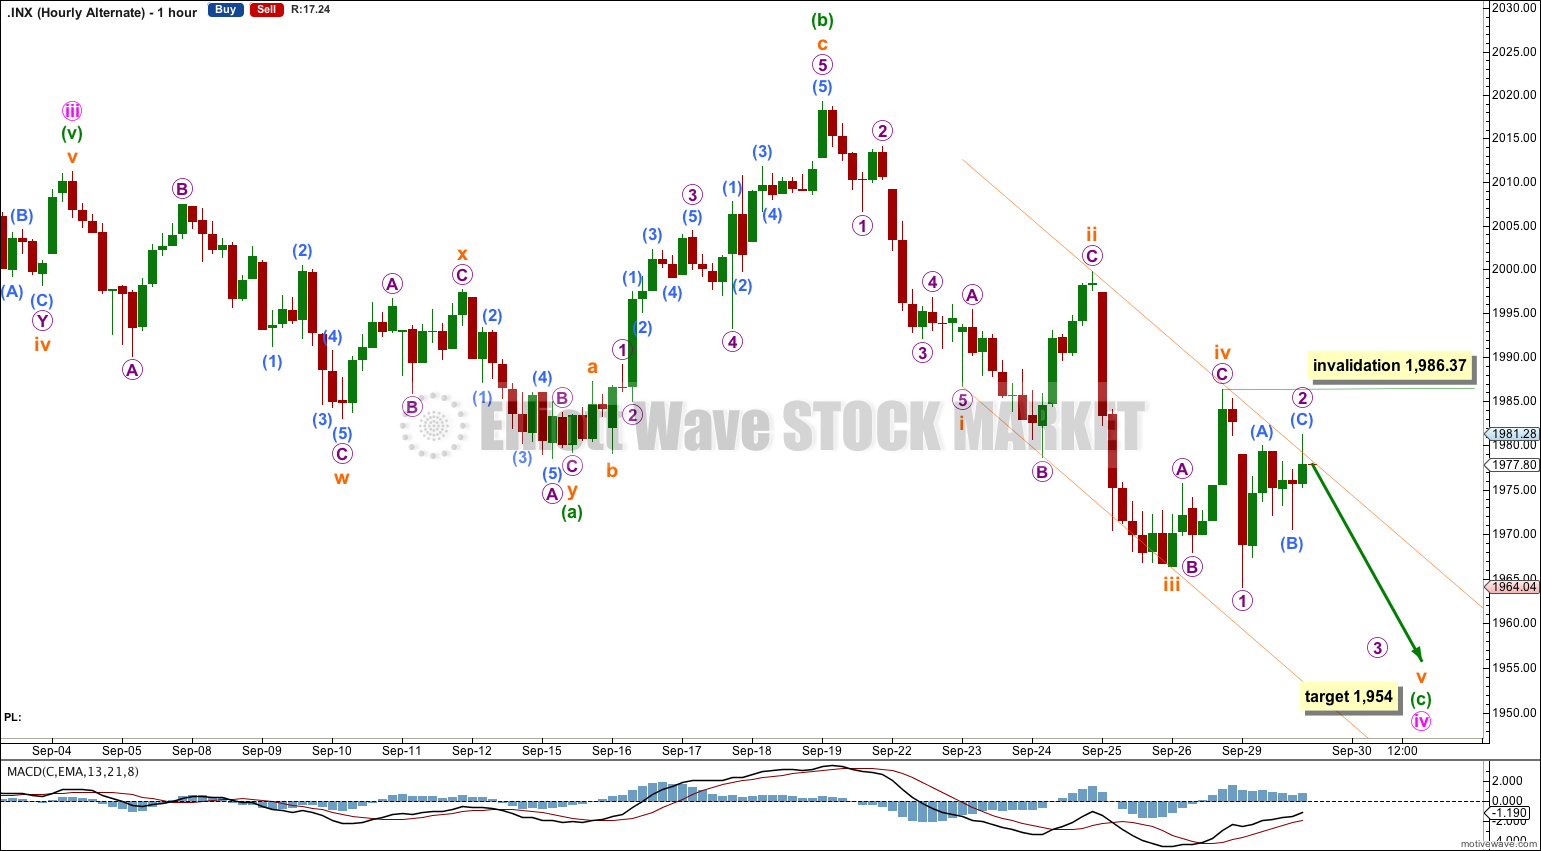
This alternate simply moves the degree of labeling within subminuette wave v down one degree. At 1,954 subminuette wave v would reach equality in length with subminuette wave i.
Within subminuette wave v micro wave 2 may not move beyond the start of micro wave 1 above 1,986.37.
A breach of the channel containing minuette wave (c) would substantially reduce the probability of this alternate, before the invalidation point is passed.
I expect this alternate has a very low probability. It looks like both subminuette waves i and iii are extended, so I would expect subminuette wave v to be shorter and not the same length.
Bearish Alternate Wave Count
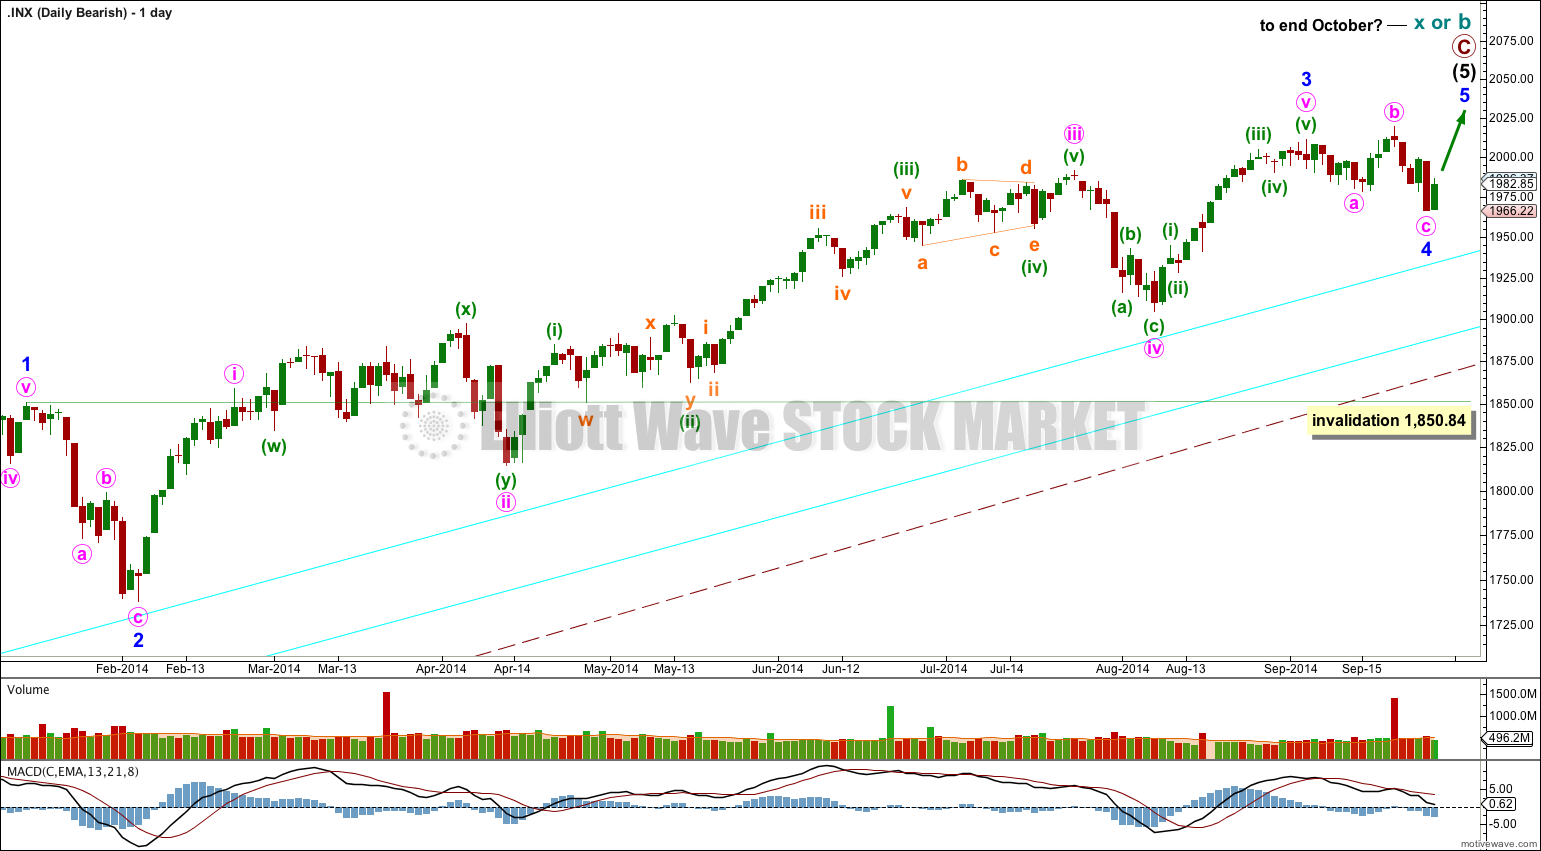
To see the difference between bull and bear wave counts they must be viewed on monthly charts here and video here.
The differentiation between the bull and bear wave count is the maroon – – – channel. The bull wave count should see price remain above the lower maroon – – – trend line. The bear wave count requires a clear breach of this trend line. If this trend line is breached by a full weekly candlestick below it and not touching it then this bear wave count would be my main wave count and I would then calculate downwards targets.
We should always assume the trend remains the same until proven otherwise; the trend is your friend. While price remains above the lower maroon – – – trend line I will assume that the S&P 500 remains within a bull market.
Alternate Wave Count
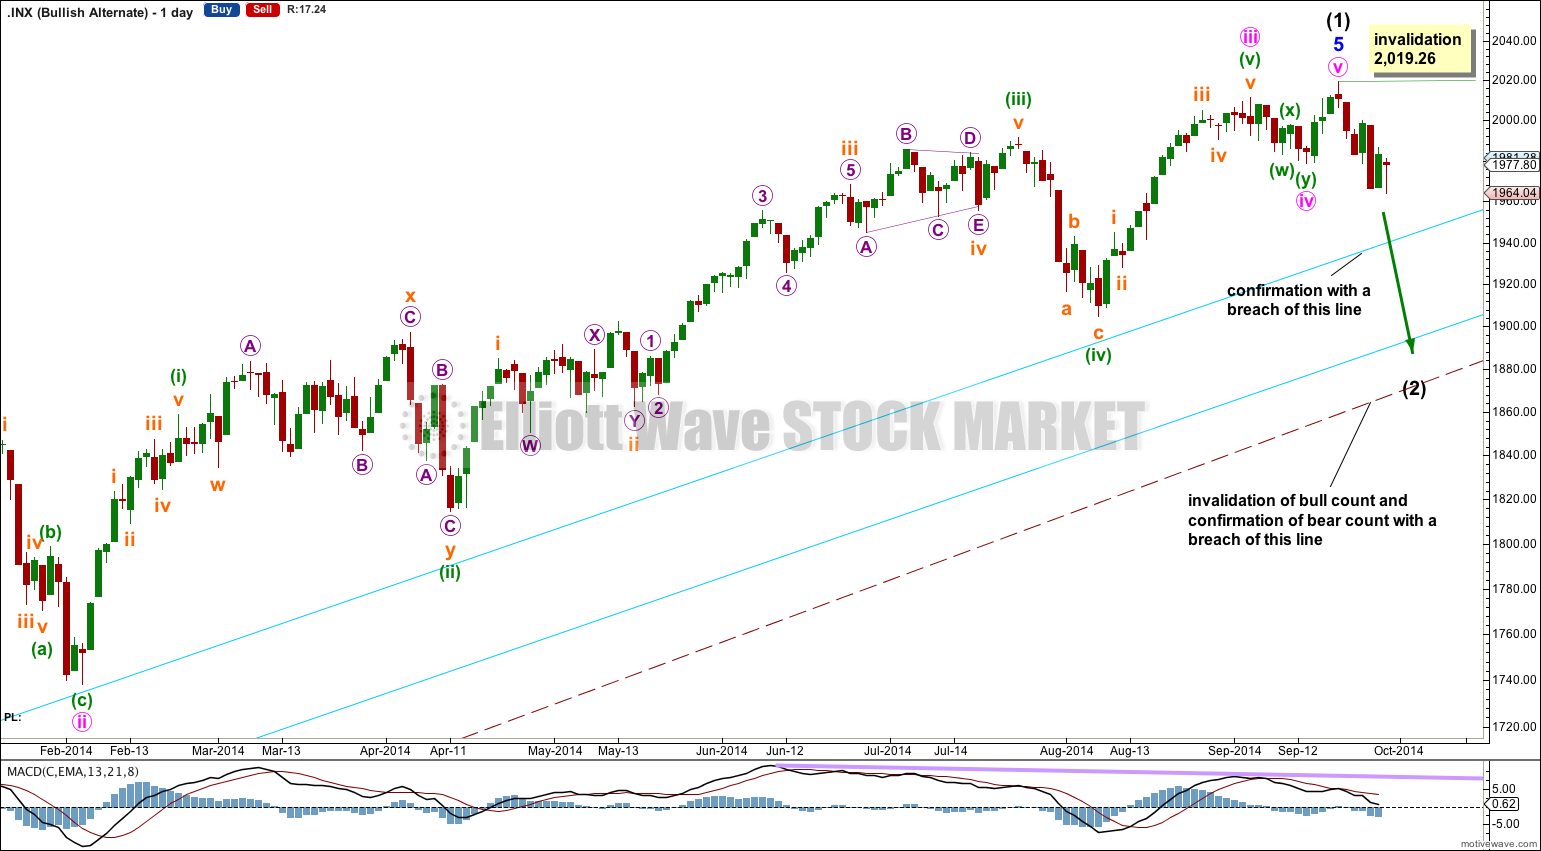
This alternate idea works for both bull and bear wave counts. It is possible that the upwards impulse of intermediate wave (1) (and for the bear wave count the upwards impulse for primary wave C) is over.
However, this alternate has a low probability from an Elliott wave perspective for two reasons:
1. Minute wave iv is very brief at only 7 sessions compared to minute wave ii at 14 sessions. The lack of proportion looks odd.
2. Minute wave iv has little structural alternation with minute wave ii; minute wave ii is a single zigzag and minute wave iv is a double zigzag.
Within intermediate wave (2) the first move down should be a five. Within it no second wave correction may move beyond its start above 2,019.26.
Intermediate wave (2) should not breach the lower edge of a base channel drawn about primary waves 1 and 2. For the bear wave count cycle wave c should breach this corrective channel about cycle wave b.
This analysis is published about 06:20 p.m. EST.
Hi Lara. I have just joined the EWSM service very recently. I am just curious about the current bigger picture. Can you tell me the rationale behind labelling the higher degree wave as Intermediate 1 and not Primary 3? Thanks in advance.
Because primary wave 3 should breach the upper edge of a base channel drawn about primary waves 1 and 2.
Not only has this base channel not been breached, price remains in the lower half of it.
And even more problematic, for the Dow the lower edge of the base channel has been breached.
This favours the bearish wave count very strongly.
We’ve just experienced one of the greatest bull runs in history. If it can’t break the upper edge of a base channel, I’m not sure what will.