
Click on chart to enlarge.
Alternate Wave Count
It has been suggested that the S&P 500 may not be able to make new highs in the near future, because some technical indicators are predicting a big trend change and a reasonable drop at this point. I wanted to show you how that would look for an Elliott wave count and explain the probability of this idea from an Elliott wave perspective.
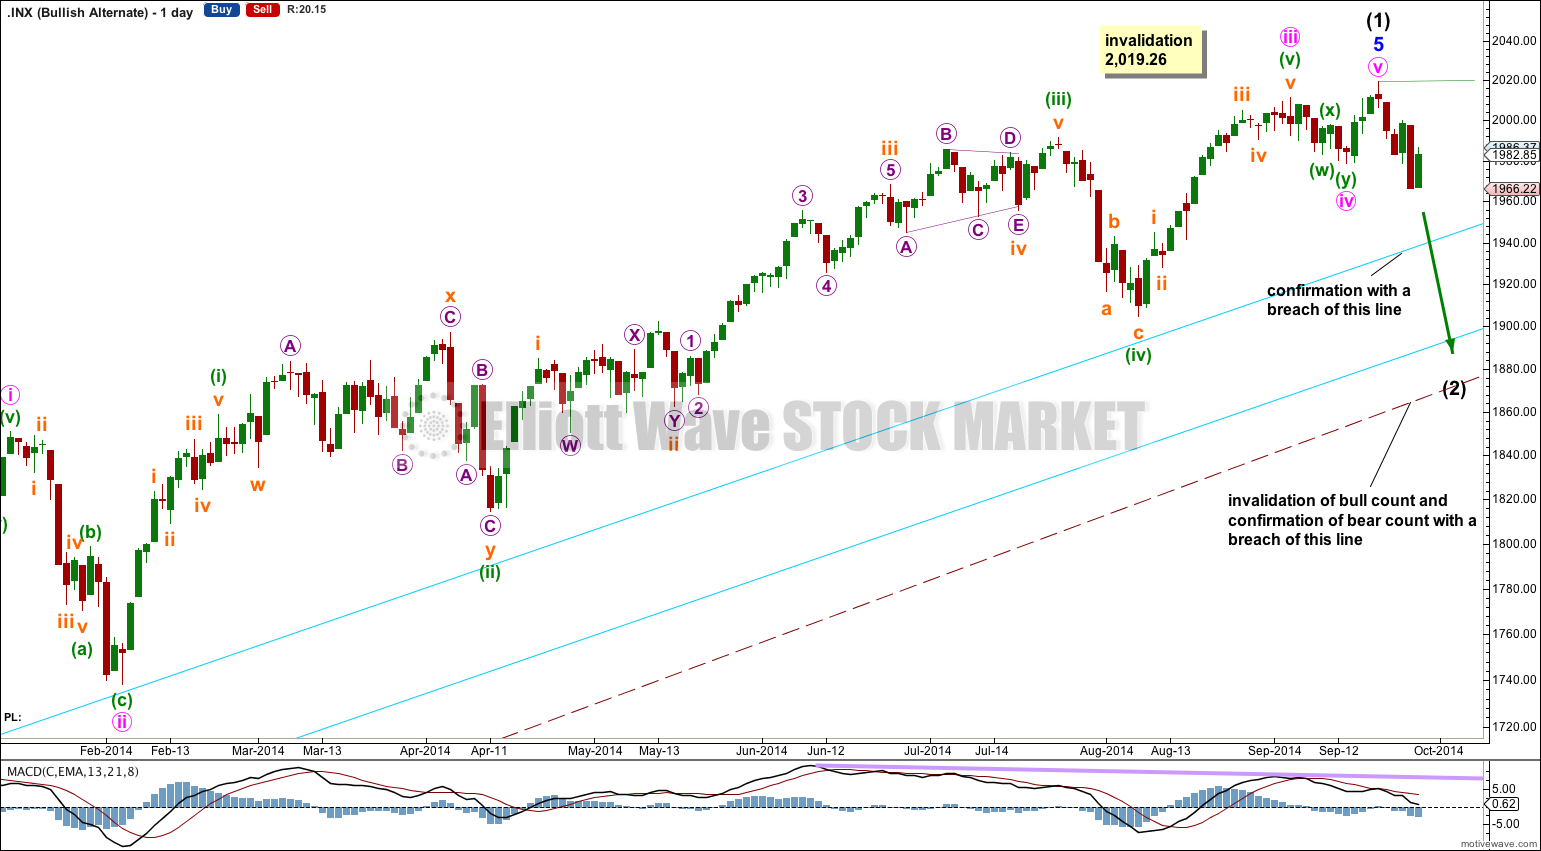
If intermediate wave (1) is over then minute waves iv and v must be over.
This idea works in exactly the same way for the bearish wave count.
Ratios within intermediate wave (1) are: minor wave 3 is just 0.76 points short of 2.618 the length of minor wave 1, and minor wave 5 is 19.79 longer than 0.618 the length of minor wave 3 (a variation of 5.3% of the length of minor wave 5 and so an acceptable Fibonacci ratio).
Ratios within minor wave 5 are: there is no adequate Fibonacci ratio between minute waves i and iii, and minute wave v is just 0.89 points longer than 0.146 the length of minute wave iii.
There is alternation in depth between minute waves ii and iv: minute wave ii is a relatively deep 55% correction and minute wave iv is a very shallow 12%. There is not much alternation in structure: minute wave ii is a single zigzag and minute wave iv is a double zigzag.
Minute wave ii lasted 14 sessions and minute wave iv lasted only 7. They are not close enough for the proportion to be very good.
The lack of alternation and disproportion between minute waves ii and iv reduces the probability of this wave count. It is possible, but it has a low probability.