
Price began the session with a little downwards movement. This is enough to complete the Elliott wave structure. Now a trend change needs to be confirmed.
Summary: The fourth wave correction may be over. The fifth wave may have begun and the first target is 2,105. A new low below 1,978.63 would indicate the fourth wave correction is incomplete. It is also possible that the fourth wave correction could continue sideways as a double flat or double combination for another one to three weeks.
Click on charts to enlarge.
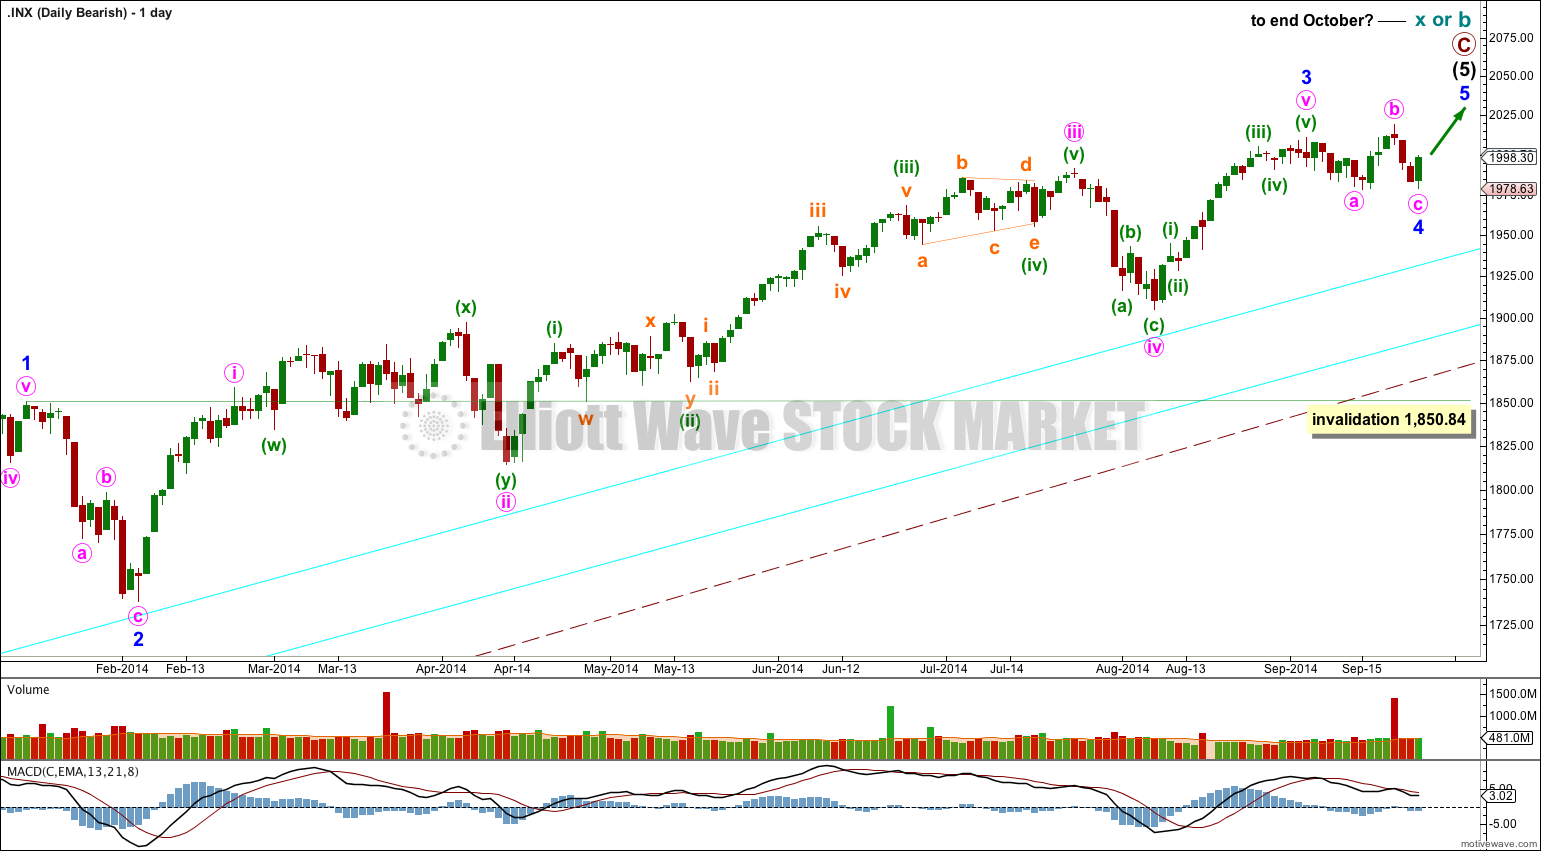
Bullish Wave Count
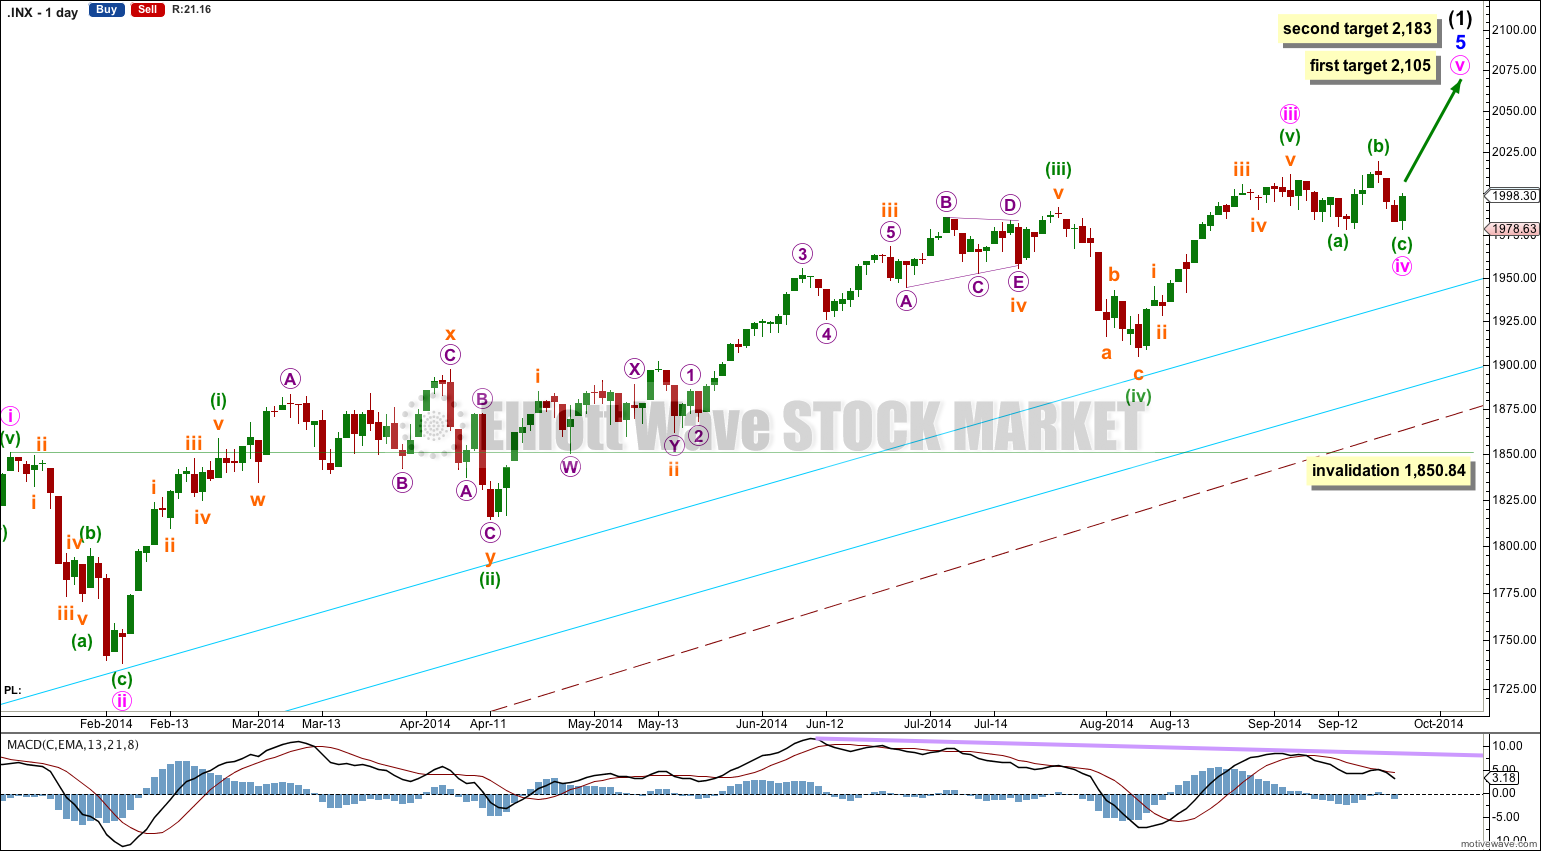
The aqua blue trend lines are critical. Draw the first trend line from the low of 1,158.66 on 25th November, 2011, to the next swing low at 1,266.74 on 4th June, 2012. Create a parallel copy and place it on the low at 1,560.33 on 24th June, 2013. While price remains above the lower of these two aqua blue trend lines we must assume the trend remains upwards. This is the main reason for the bullish wave count being my main wave count.
There are a couple of things about this wave count of which I am confident. I see minor wave 3 within intermediate wave (1) as over at 1,729.86 (19th September, 2013). It has the strongest upwards momentum and is just 0.76 longer than 2.618 the length of minor wave 1. At 455 days duration this is a remarkably close Fibonacci ratio. The subdivisions within it are perfect. If this is correct then minor wave 4 ends at 1,646.47 and this is where minor wave 5 begins.
Within minor wave 5 there is no Fibonacci ratio between minute wave i and iii. This makes it more likely that minute wave v will exhibit a Fibonacci ratio to either of i or iii. At 2,105 minute wave v will reach 0.618 the length of minute wave i. At 2,183 minute wave v would reach equality in length with minute wave i. If price reaches the first target and the structure is incomplete, or it just keeps going upwards, then I would use the second target.
Minor wave 5 is unfolding as an impulse. If minor wave 5 has passed its middle then I would expect to see more divergence between price and MACD develop over coming weeks.
Minute wave ii lasted 14 sessions and was a relatively deep 55% zigzag correction. Minute wave iv could be over now, lasting also 14 sessions which provides perfect proportion between its counterpart minute wave ii, and does show perfect alternation as a very shallow 12% flat correction. Because of the perfect alternation and perfect proportion I would judge the main hourly wave count to have a slightly higher probability than the alternate hourly wave counts. However, I would strongly advise members at this stage to use your own preferred technical analysis methods to determine which of these three wave counts you judge more likely to be correct.
The large maroon – – – channel is copied over from the weekly chart. It is drawn in exactly the same way on bull and bear wave counts. For the bull wave count this channel is termed a base channel about primary waves 1 and 2. A lower degree second wave should not breach the lower edge of a base channel drawn about a first and second wave one or more degrees higher. The lower maroon – – – trend line differentiates the bull and bear wave counts at cycle degree and monthly chart level.
Main Hourly Wave Count
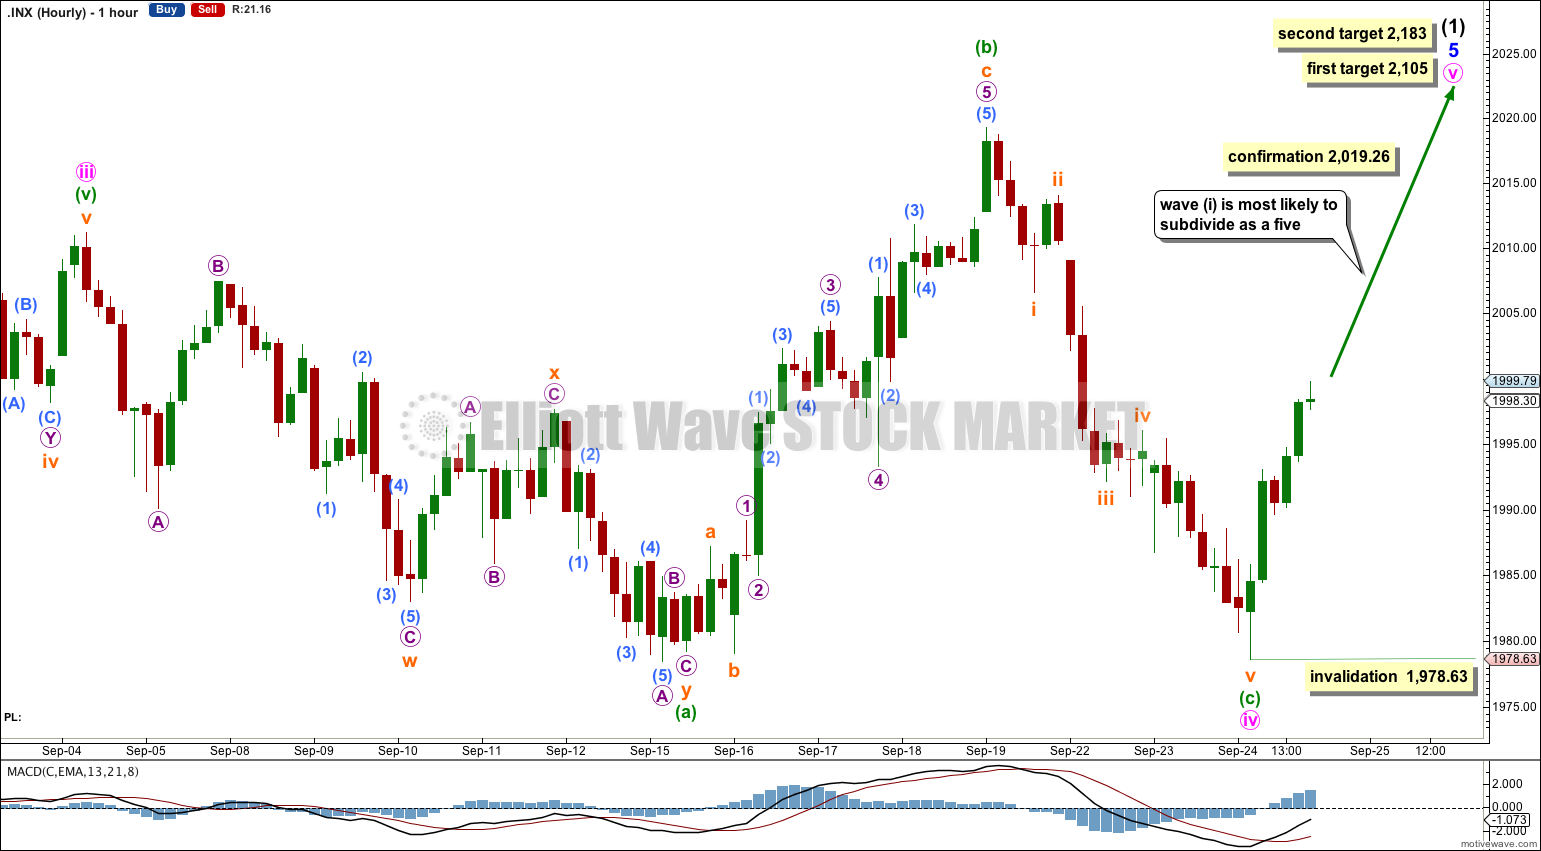
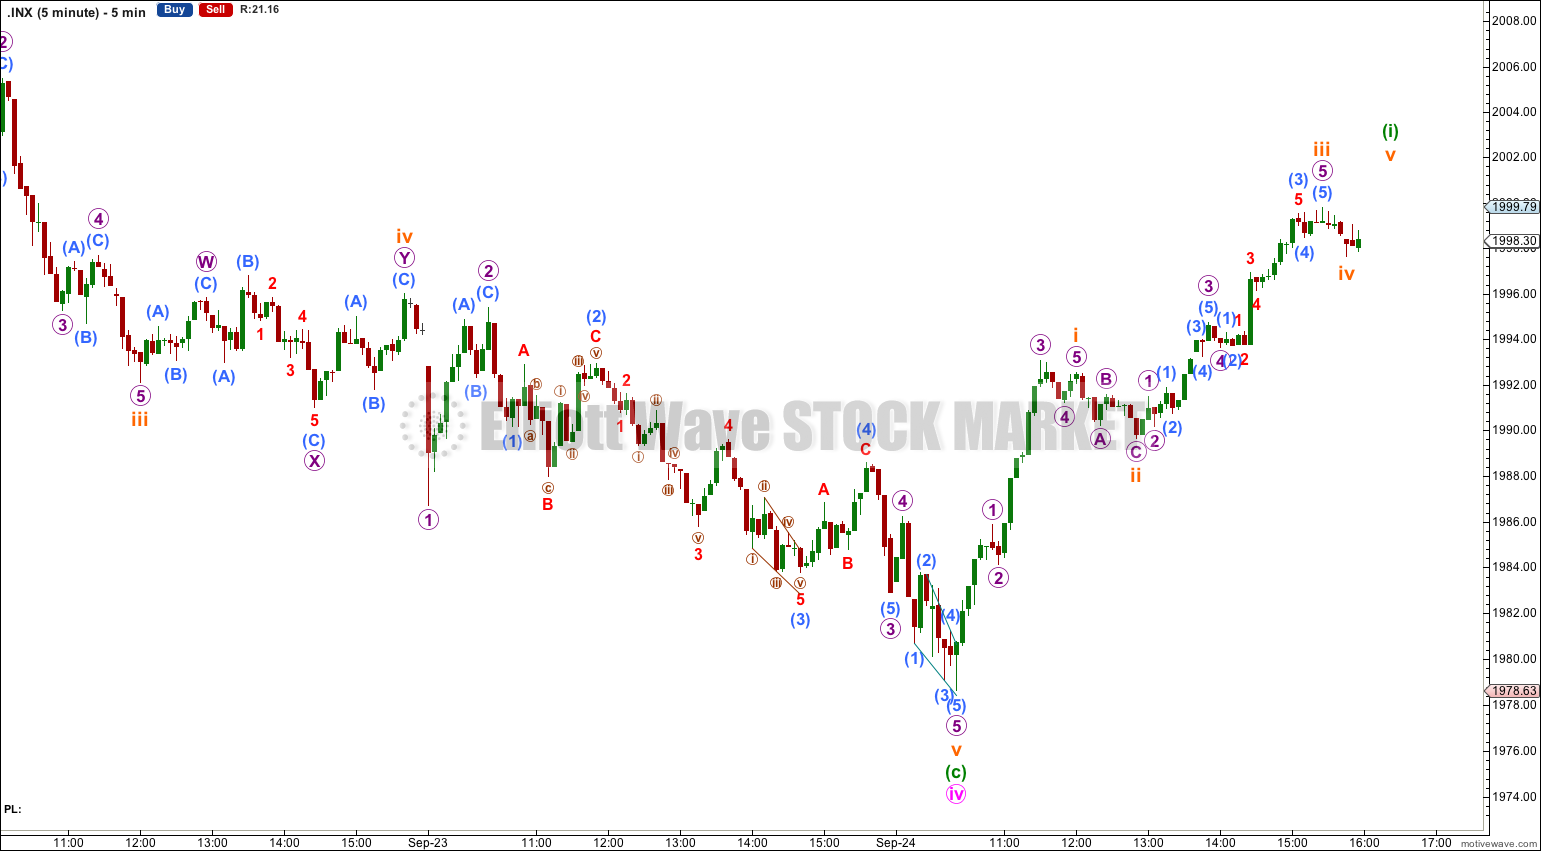
Minute wave iv may now be a completed expanded flat correction, with a shorter than normal C wave. This is not technically a running flat, because minuette wave (c) did manage just to make a new low below the end of minuette wave (a) which is at 1,979.22. This is reliant upon my analysis of the sideways chop at the end of minuette wave (a) and start of minuette wave (b) being correct on the five minute chart.
Minute wave iv is perfectly in proportion to minute wave ii and shows perfect alternation.
If minute wave v has begun here then it must subdivide as a five wave structure. It may only be either an impulse or an ending diagonal.
Ending diagonals require all their subwaves to subdivide as zigzags. If the next upwards wave is a zigzag there is no way to tell if it is the first wave of an ending diagonal, or an X wave for the second alternate wave count below. This is why I am encouraging members to use their own technical analysis methods at this time to determine which of these two wave counts you see as most likely.
Ending diagonals for final fifth waves are reasonably common. They are not at all unusual.
Impulses for fifth waves are more common than ending diagonals, so minuette wave (i) is most likely to subdivide as a five. If the next wave upwards is a five this main wave count would be confirmed.
Within either a diagonal or an impulse the second wave may not move beyond the start of the first wave below 1,978.63.
Alternate Hourly Wave Count
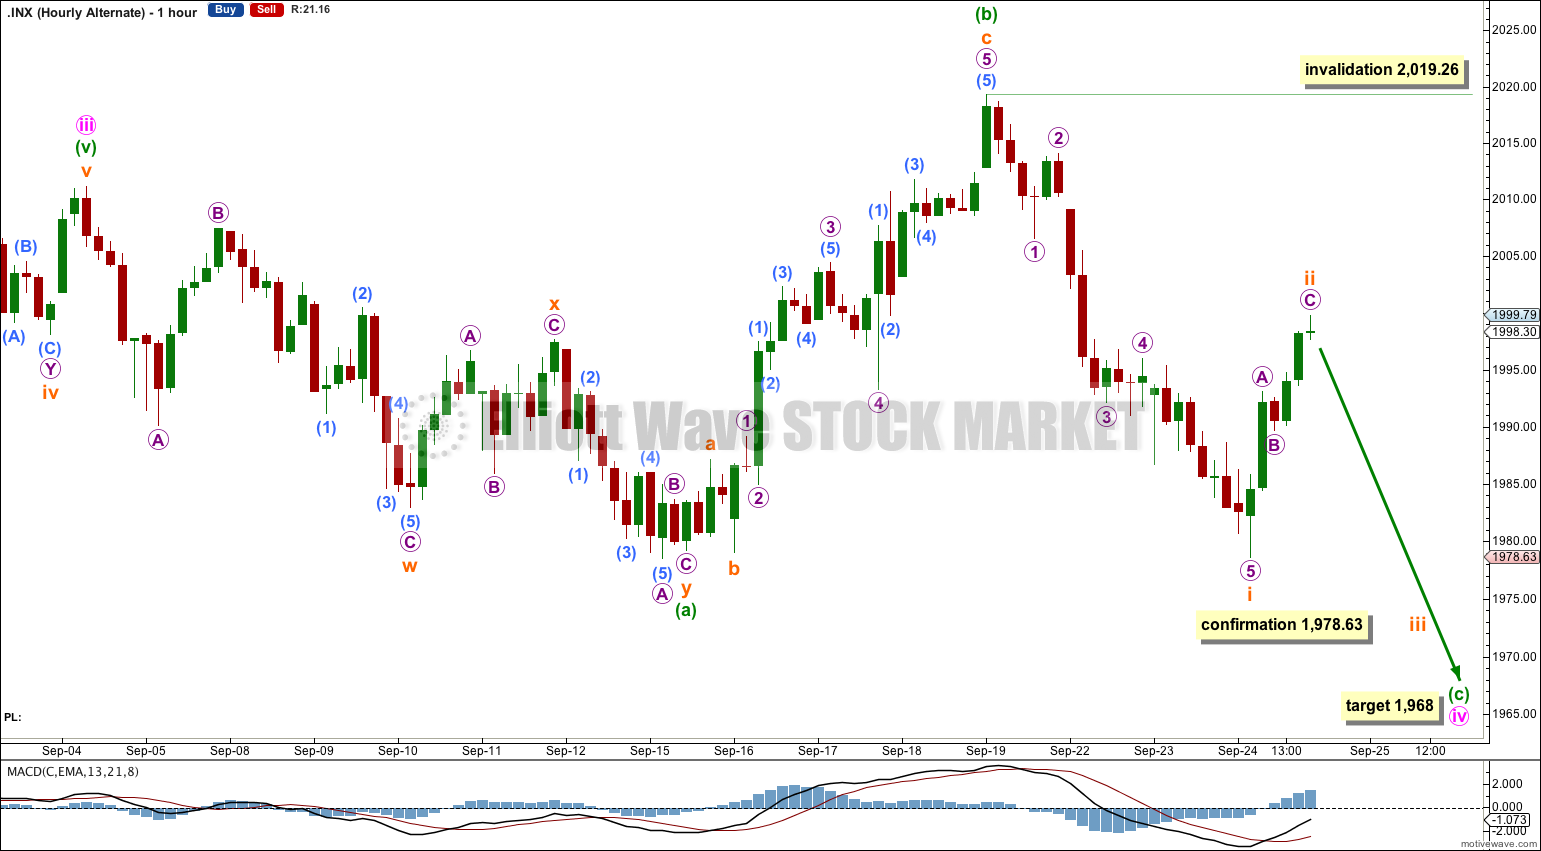
By simply moving the degree of labeling within minuette wave (c) all down one degree it is possible that only subminuette wave i is complete.
Minuette wave (c) may continue lower as an impulse with an extended first wave. The third wave would likely be shorter, and the fifth wave would likely be the shortest. If the main wave count is invalidated with movement below 1,978.63 this alternate and the second alternate below would both be valid.
Subminuette wave ii may not move beyond the start of subminuette wave i above 2,019.26.
Second Alternate Hourly Wave Count
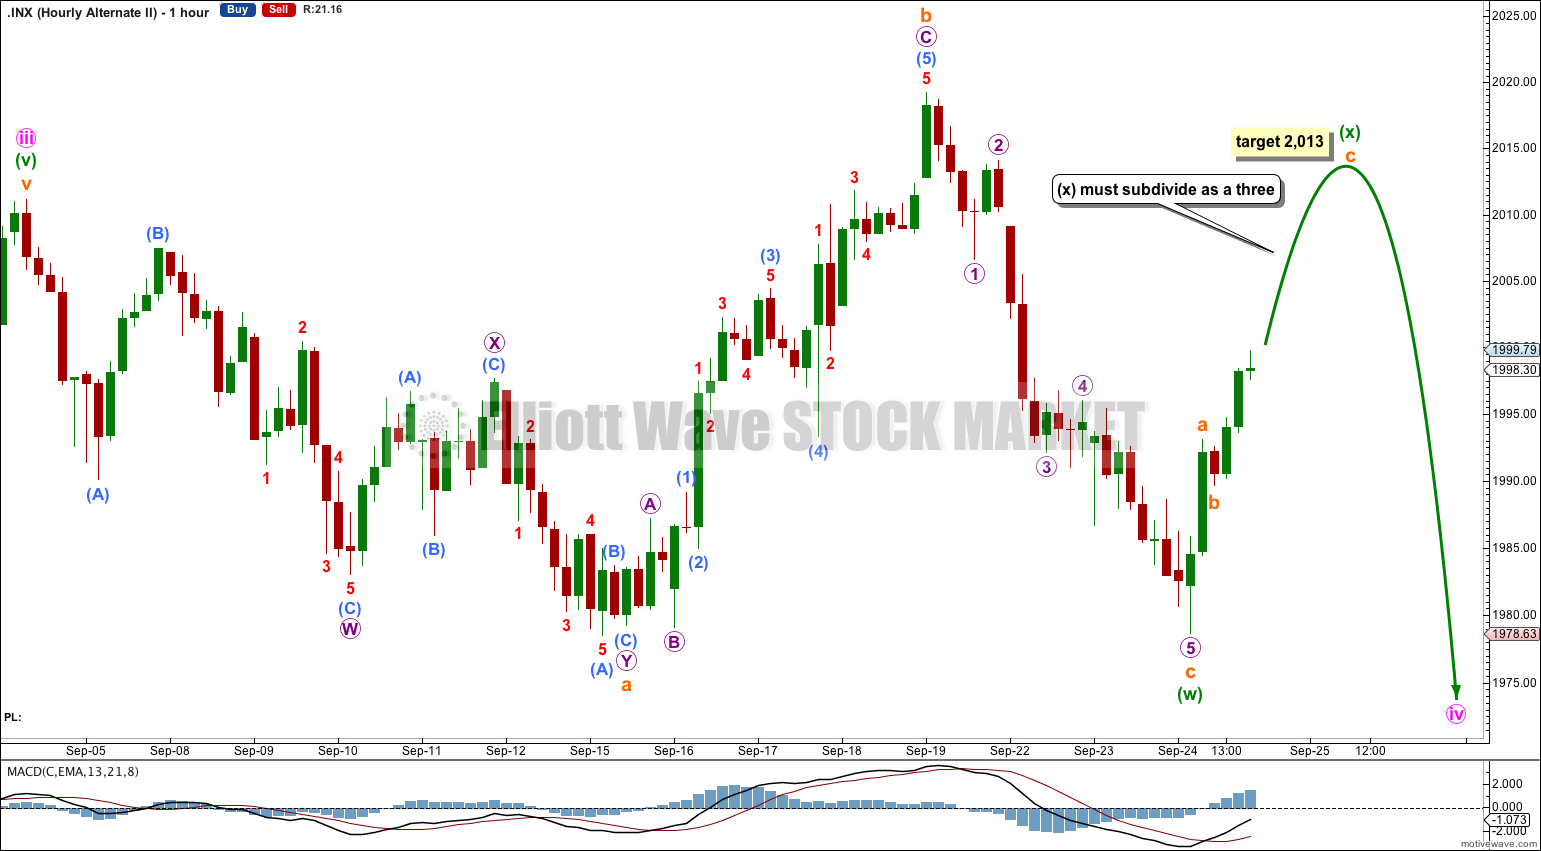
It is this idea which creates uncertainty at this juncture. By simply moving the degree of labeling within minute wave iv all down one degree this flat correction may be only the first flat in a double flat, or the first flat in a double combination.
Within double flats and double combinations minuette wave (x) must subdivide as a corrective structure, which can be any corrective structure, including a multiple. X waves are most often zigzags though, and this alternate would expect a zigzag upwards as most likely. Also, X waves may make new price extremes beyond the beginning or price territory of W waves, so minuette wave (x) may make a new high because there is no upper invalidation point for this wave count to differentiate with the first hourly wave count.
At 2,013 subminuette wave c would reach equality in length with subminuette wave a.
If the next wave up is a zigzag there will be no way to tell (from an Elliott wave perspective) if it is an X wave, or the first wave of an ending diagonal.
If the next wave up is a zigzag then this alternate and the main hourly wave counts could both be correct. If the next wave up is a different corrective structure, not a zigzag, then this alternate would be correct and the main wave count would be wrong.
This alternate wave count expects more sideways movement for at least one more week, and probably two or three. It is only the expected duration for this alternate which indicates it is less likely than the main hourly wave count.
Bearish Alternate Wave Count
To see the difference between bull and bear wave counts they must be viewed on monthly charts here and video here.
The differentiation between the bull and bear wave count is the maroon – – – channel. The bull wave count should see price remain above the lower maroon – – – trend line. The bear wave count requires a clear breach of this trend line. If this trend line is breached by a full weekly candlestick below it and not touching it then this bear wave count would be my main wave count and I would then calculate downwards targets.
We should always assume the trend remains the same until proven otherwise; the trend is your friend. While price remains above the lower maroon – – – trend line I will assume that the S&P 500 remains within a bull market.
This analysis is published about 08:33 p.m. EST.