
Price moved sideways, remaining just above the invalidation point on the hourly chart. I am adjusting the Elliott wave count slightly today which makes the target zone narrower.
Summary: If the target at 2,022 – 2,025 is met in two days time then this fifth wave will exhibit a Fibonacci duration, lasting 21 days. This time expectation is a rough guide only though. I will also look for upwards movement to end if price touches the upper green trend line on the daily chart.
Click on charts to enlarge.
The aqua blue trend lines are critical. Draw the first trend line from the low of 1,158.66 on 25th November, 2011, to the next swing low at 1,266.74 on 4th June, 2012. Create a parallel copy and place it on the low at 1,560.33 on 24th June, 2013. While price remains above the lower of these two aqua blue trend lines we must assume the trend remains upwards. This is the main reason for the bullish wave count being my main wave count.
Bullish Wave Count.
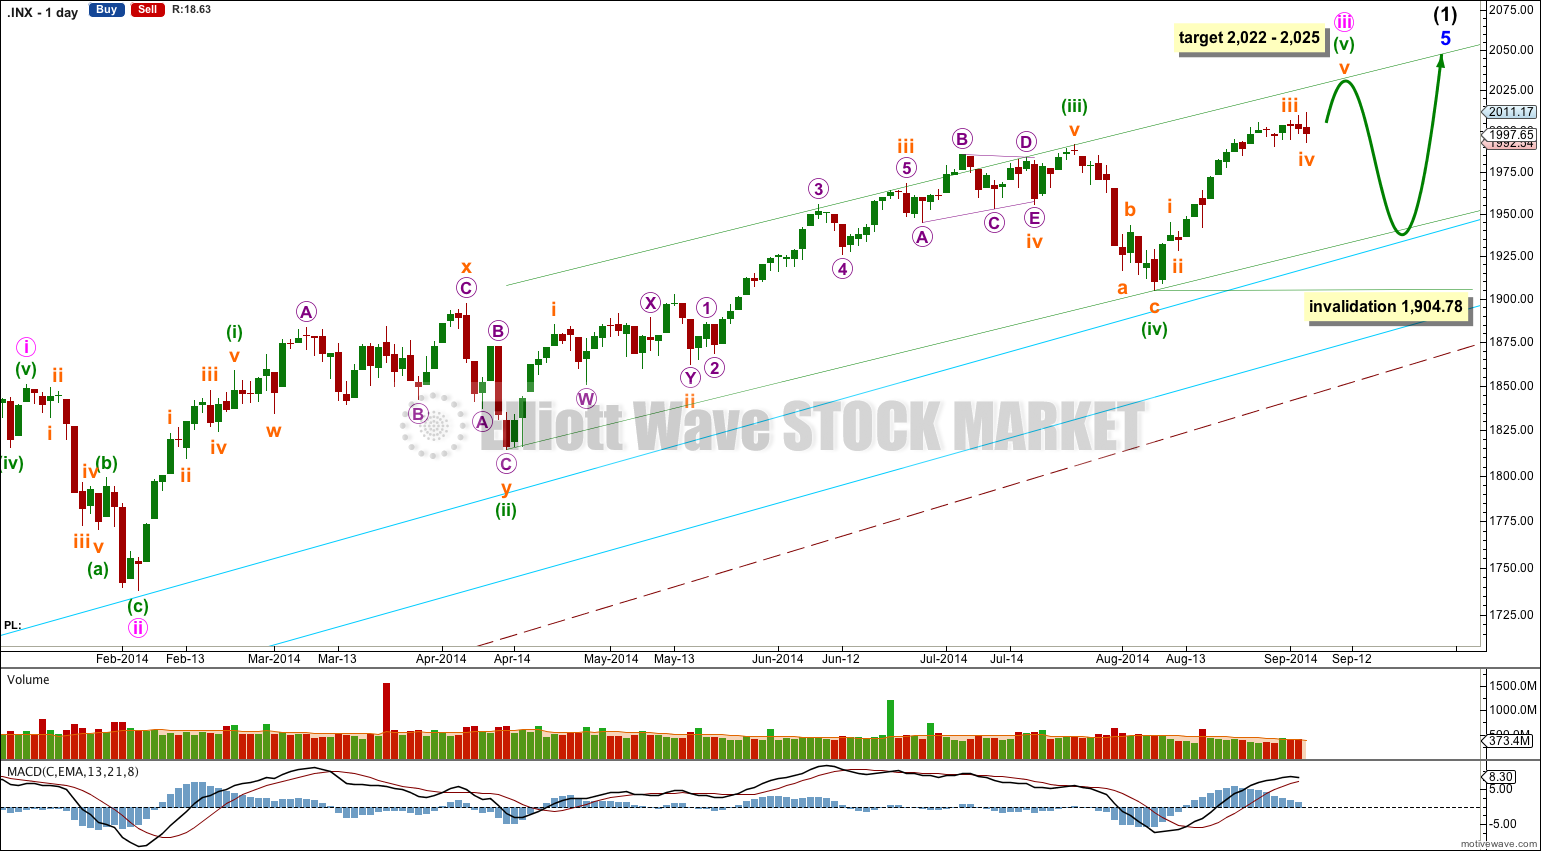
There are a couple of things about this wave count of which I am confident. I see minor wave 3 within intermediate wave (1) as over at 1,729.86 (19th September, 2013). It has the strongest upwards momentum and is just 0.76 longer than 2.618 the length of minor wave 1. At 455 days duration this is a remarkably close Fibonacci ratio. The subdivisions within it are perfect. If this is correct then minor wave 4 ends at 1,646.47 and this is where minor wave 5 begins.
Because there is already a very close Fibonacci ratio between minor waves 1 and 3 I would not actually expect to see a Fibonacci ratio between minor wave 5 to either of 1 or 3. This means that the target for intermediate wave (1) to end would best be calculated at minute wave degree, within minor wave 5. I will not be able to do that until minute wave iv has ended.
Minor wave 5 is unfolding as an impulse. If minor wave 5 has passed its middle then I would expect to see more divergence between price and MACD develop over coming weeks.
Along the way up towards the completion of intermediate wave (1) I would expect one more correction complete for minute wave iv, which should not breach the upper of the two aqua blue trend lines given that the upper trend line has held for over a year now.
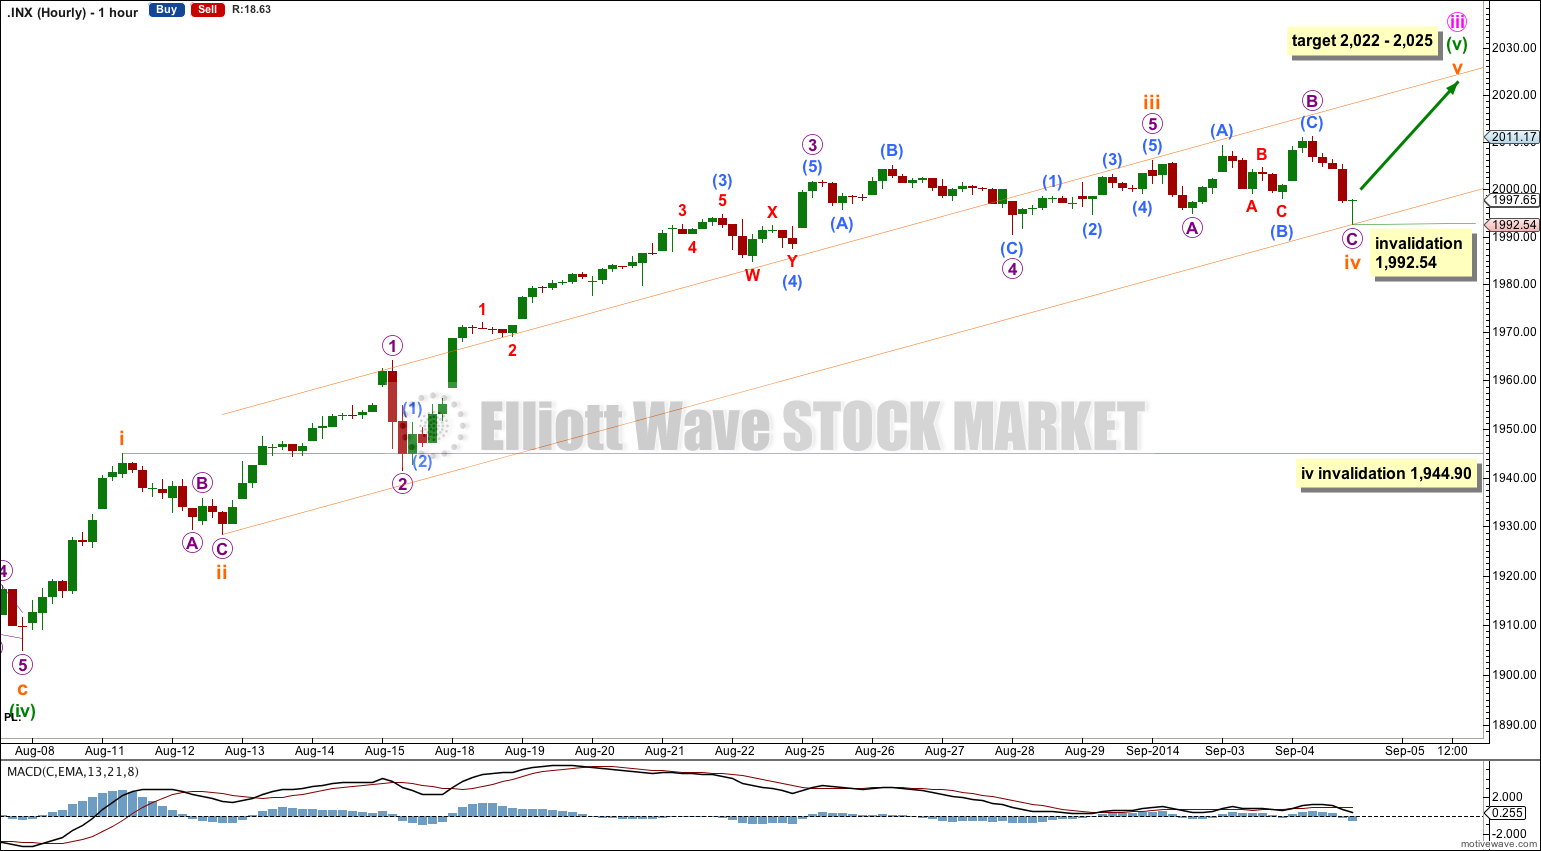
Within minuette wave (v) no second wave correction may move beyond the start of its first wave below 1,904.78.
Within minute wave iii there is no adequate Fibonacci ratio between minuette waves (iii) and (i). This makes it more likely that minuette wave (v) would exhibit a Fibonacci ratio to either of minuette waves (i) or (iii). At 2,025 minuette wave (v) would reach equality in length with minuette wave (i). As this is the most common relationship between first and fifth waves this should be the first expectation.
If price keeps rising through this target then I will again calculate a second higher target, although at this stage looking at trend channels and time frames this first lower target looks much more likely to be correct so I will leave it as the sole target for now.
Minuette wave (v) has now lasted 19 sessions. If it completes in a total Fibonacci 21 sessions it may end in two more sessions. This expectation of a Fibonacci duration for minuette wave (v) is a rough guideline only. Minuette wave (i) lasted 12 sessions, just one short of a Fibonacci 13, and minuette wave (ii) lasted a Fibonacci 34 sessions. Minuette wave (iii) lasted 71 sessions and minuette wave (iv) lasted 10 sessions. These two waves have no Fibonacci duration nor ratio in time to minuette waves (i) or (ii). This illustrates that sometimes the S&P exhibits Fibonacci durations and ratios between waves for time taken, but not always. It cannot be relied upon.
I have drawn the parallel channel about minute wave iii using Elliott’s second technique: draw the first trend line from the lows of minuette waves (ii) to (iv), then place a parallel copy on the high of minuette wave (iii). Minuette wave (v) may end about the upper edge of this channel.
The large maroon – – – channel is copied over from the weekly chart. It is drawn in exactly the same way on bull and bear wave counts. For the bull wave count this channel is termed a base channel about primary waves 1 and 2. A lower degree second wave should not breach the lower edge of a base channel drawn about a first and second wave one or more degrees higher. The lower maroon – – – trend line differentiates the bull and bear wave counts at cycle degree and monthly chart level.
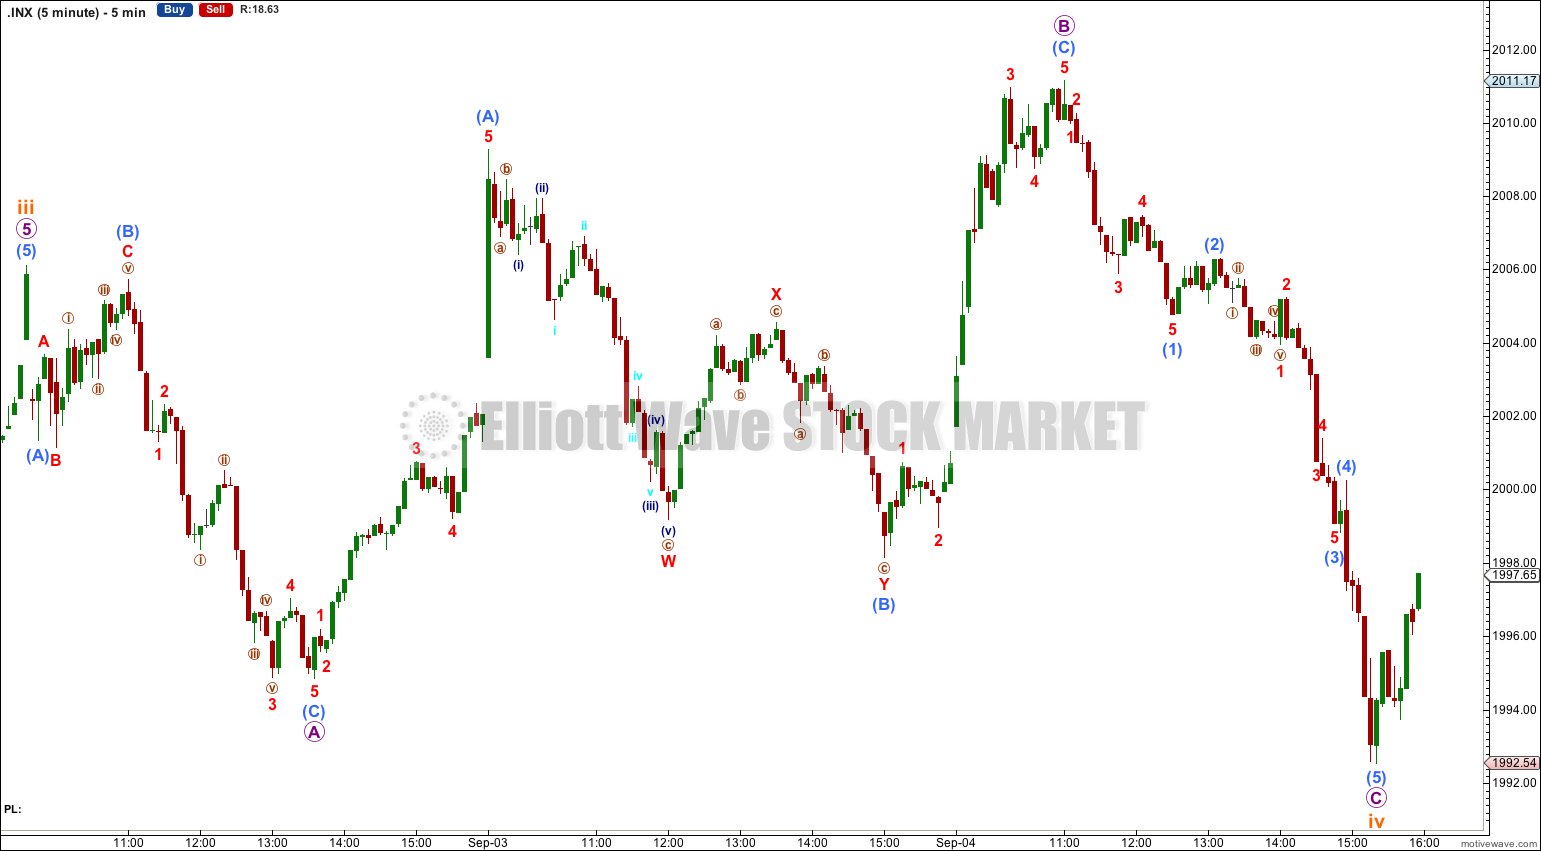
I have adjusted the wave count today to see recent movement as subminuette wave iv, which has a better fit now.
There is still no Fibonacci ratio between subminuette waves iii and i, and I still expect to see a Fibonacci ratio for subminuette wave v to either of iii or i. At 2,022 subminuette wave v would reach 0.382 the length of subminuette wave iii. Because this is very close to 2,025 calculated at minuette wave degree this provides a smaller target zone, with a higher probability.
Ratios within subminuette wave iii are: micro wave 3 is 2.39 points longer than 1.618 the length of micro wave 1, and micro wave 5 is 1.39 points longer than 0.236 the length of micro wave 3.
I have drawn a channel about minuette wave (v) using Elliott’s second technique: draw the first trend line from the lows labeled subminuette waves ii to iv, then place a parallel copy on the high labelled subminuette wave iii. I know this channel does not fit all this movement, but I would still expect subminuette wave v to end about the upper orange trend line.
Within subminuette wave v no second wave correction may move beyond the start of its first wave below 1,992.54.
If this first invalidation point is breached it is possible that subminuette wave iv is continuing further as a double flat correction. I would expect such a structure to only move sideways so a breach of 1,992.54 should not see significant further downwards movement, and is highly unlikely as here subminuette wave iv is nicely in proportion on the hourly and daily chart.
If subminuette wave iv does continue it may not move into subminuette wave i price territory below 1,944.90.
Bearish Alternate Wave Count
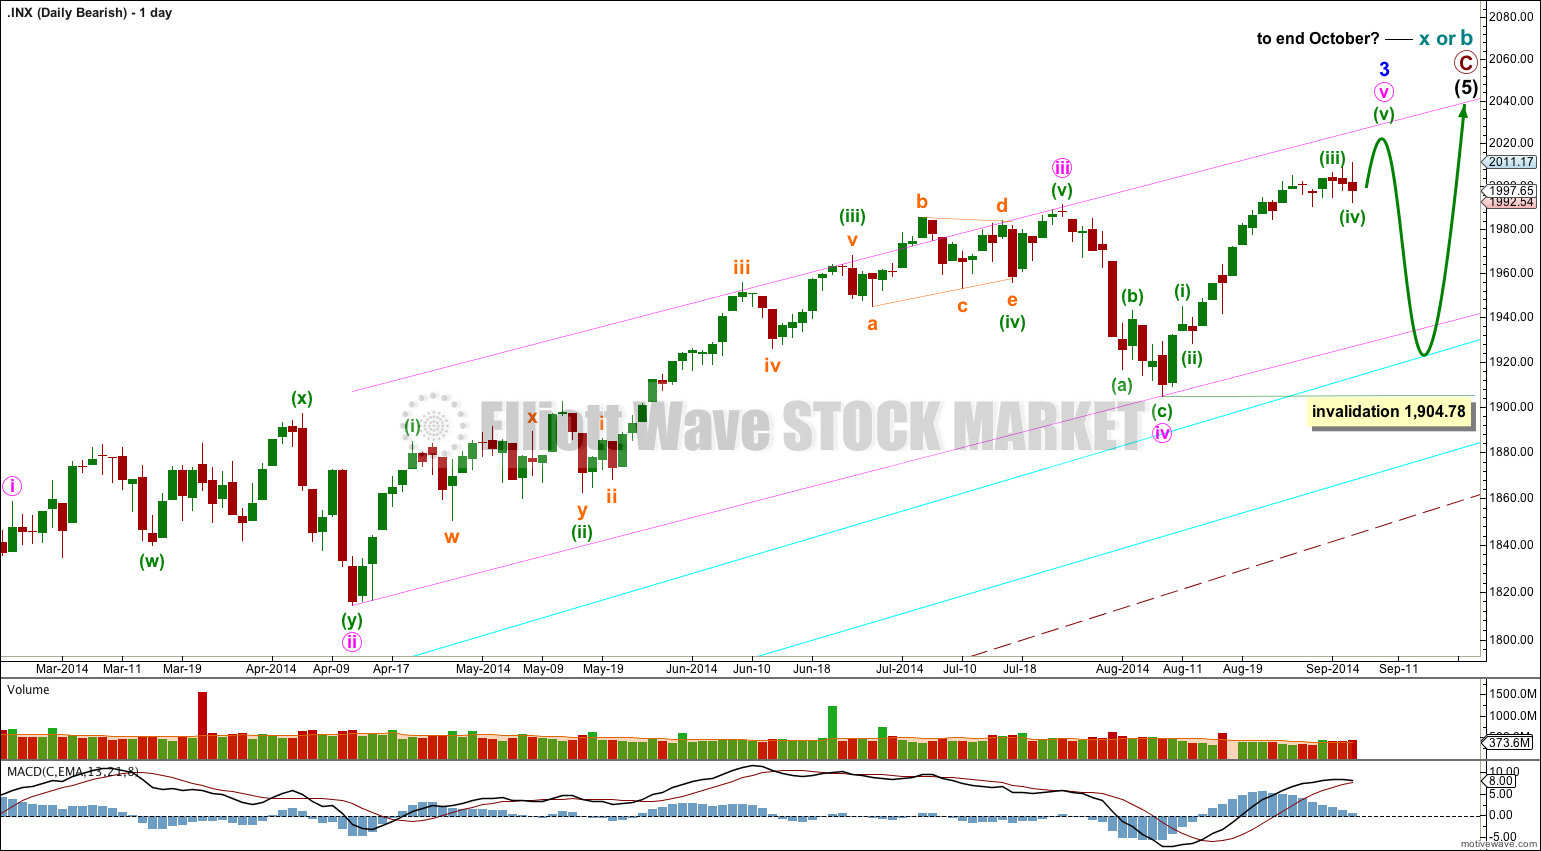
This bearish alternate wave count expects that the correction is not over. The flat correction which ended at 666.79 was only cycle wave a (or w) of a larger super cycle second wave correction.
The structure and subdivisions within primary wave C for the bear wave count are the same as for intermediate wave (1) for the bull wave count. Thus the short to mid term outlook is identical.
The differentiation between the bull and bear wave count is the maroon – – – channel. The bull wave count should see price remain above the lower maroon – – – trend line. The bear wave count requires a clear breach of this trend line. If this trend line is breached by a full weekly candlestick below it and not touching it then this bear wave count would be my main wave count and I would then calculate downwards targets.
We should always assume the trend remains the same until proven otherwise; the trend is your friend. While price remains above the lower maroon – – – trend line I will assume that the S&P 500 remains within a bull market.
This analysis is published about 04:45 p.m. EST.
No.
2,025 – 2,030 is now the target only for minute wave iii to end.
I do not have a target for minute wave v to end the whole structure, up to and including intermediate wave (1). Today’s video explains why this is.
lara
previously back early august you mention around 2219 as ultimate target for around october before a trend change
is 20222/2025 is now the ultimate target?
Lara, isn’t it possible that wave 5 has been reached now on the Daily and we are seeing the start of a trend change down?
Lara, other elliotticians are suggesting subminuette wave v ended as an ED at 2011. Have you considered this count and would you consider it if we follow through to the downside on Friday? A close below 1990.52 on Friday would make things really interesting as it would suggest a key reversal week on the S&P
I think the market has answered this question (its faster than me, sorry!)
No. I cannot see an ending diagonal in there. It just doesn’t fit.