
Yesterday’s hourly Elliott wave analysis expected a little more upwards movement in the short term to 1,981. Price did move higher to reach just above the target to 1.982.57.
The wave counts remain the same.
Summary: It is most likely that tomorrow we shall see downwards movement. A new low below 1,944.90 would confirm that price should keep falling to below 1,904.78. Alternatively, a new high above 1,991.39 would confirm the correction was over a few days ago and price should then continue up towards 2,028 – 2,069.
Click on charts to enlarge.
The aqua blue trend lines are critical. Draw the first trend line from the low of 1,158.66 on 25th November, 2011, to the next swing low at 1,266.74 on 4th June, 2012. Create a parallel copy and place it on the low at 1,560.33 on 24th June, 2013. While price remains above the lower of these two aqua blue trend lines we must assume the trend remains upwards. This is the main reason for the bullish wave count being my main wave count.
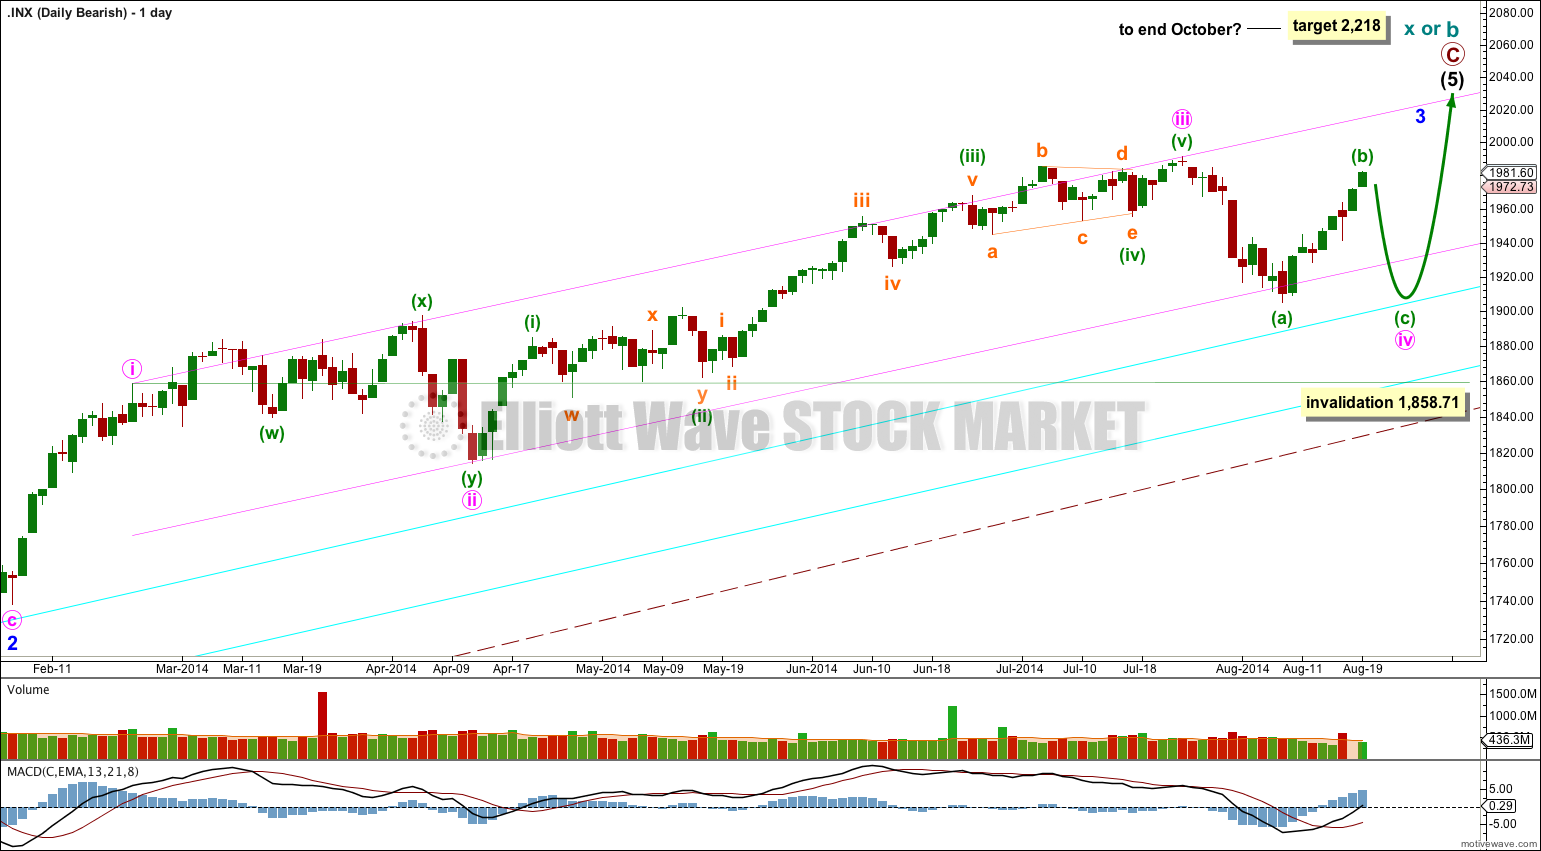
Bullish Wave Count.
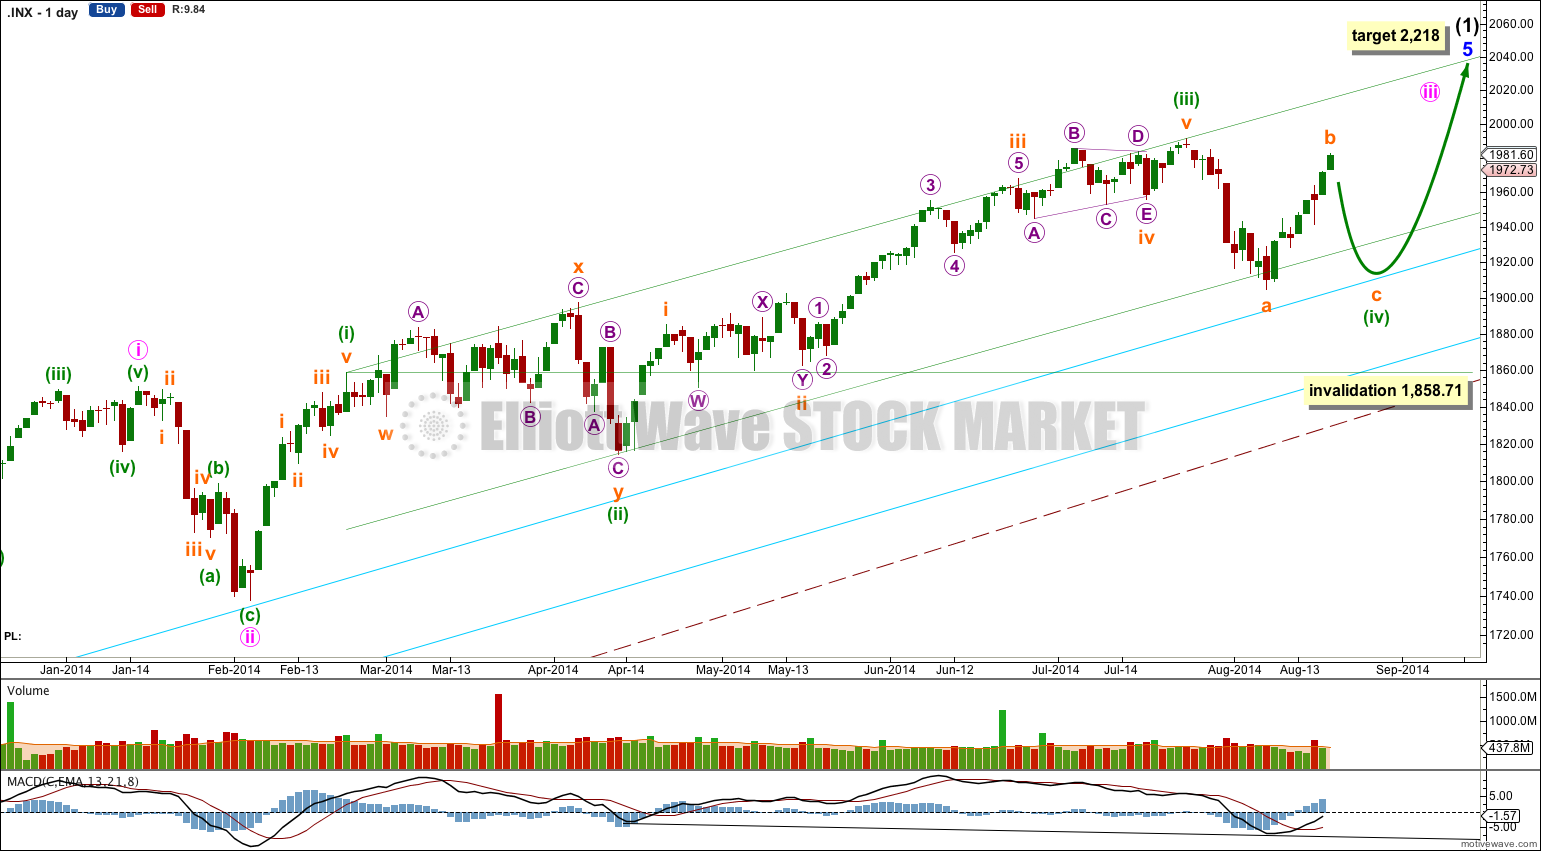
There are a couple of things about this wave count of which I am confident. I see minor wave 3 within intermediate wave (1) as over at 1,729.86 (19th September, 2013). It has the strongest upwards momentum and is just 0.76 longer than 2.618 the length of minor wave 1. At 455 days duration this is a remarkably close Fibonacci ratio. The subdivisions within it are perfect. If this is correct then minor wave 4 ends at 1,646.47 and this is where minor wave 5 begins.
Minor wave 5 is unfolding as an impulse. If minor wave 5 has passed its middle then I would expect to see more divergence between price and MACD develop over coming weeks.
Along the way up towards the final target I would expect to see two more corrections complete: the current correction for minuette wave (iv) and one more for minute wave iv.
Minuette wave (iv) may not move into minuette wave (i) price territory below 1,858.71.
At 2,218 minor wave 5 would reach equality in length with minor wave 3. This target may be met in October.
I have drawn a parallel channel about minute wave iii using Elliott’s first technique: draw the first trend line from the highs of minuette waves (i) to (iii), then place a parallel copy on the low of minuette wave (ii). Minuette wave (iv) so far slightly breaches the lower edge of this channel. If it has ended there then it fits quite nicely within the channel. If it continues further it may overshoot the channel.
Minuette wave (iv) may reach as low as the 0.618 Fibonacci ratio of minuette wave (iii) at 1,881.28, which would provide alternation in depth of correction between minuette waves (ii) and (iv), (minuette wave (ii) was a shallow 37% correction). Downwards movement may find final support about the upper aqua blue trend line, continuing a pattern which has lasted about a year now. If the upper aqua blue trend line is overshot by downwards movement then I would expect price to find support at the lower aqua blue trend line, although it may not get that low.
Minuette wave (ii) lasted exactly a Fibonacci 34 sessions. So far minuette wave (iv) has lasted 18 sessions, and if it continues for another three it will last a Fibonacci 21 sessions and have a 0.618 Fibonacci ratio to the duration of minuette wave (ii).
The large maroon – – – channel is copied over from the weekly chart. It is drawn in exactly the same way on bull and bear wave counts. For the bull wave count this channel is termed a base channel about primary waves 1 and 2. A lower degree second wave should not breach the lower edge of a base channel drawn about a first and second wave one or more degrees higher. The lower maroon – – – trend line differentiates the bull and bear wave counts at cycle degree and monthly chart level.
Main Hourly Wave Count.
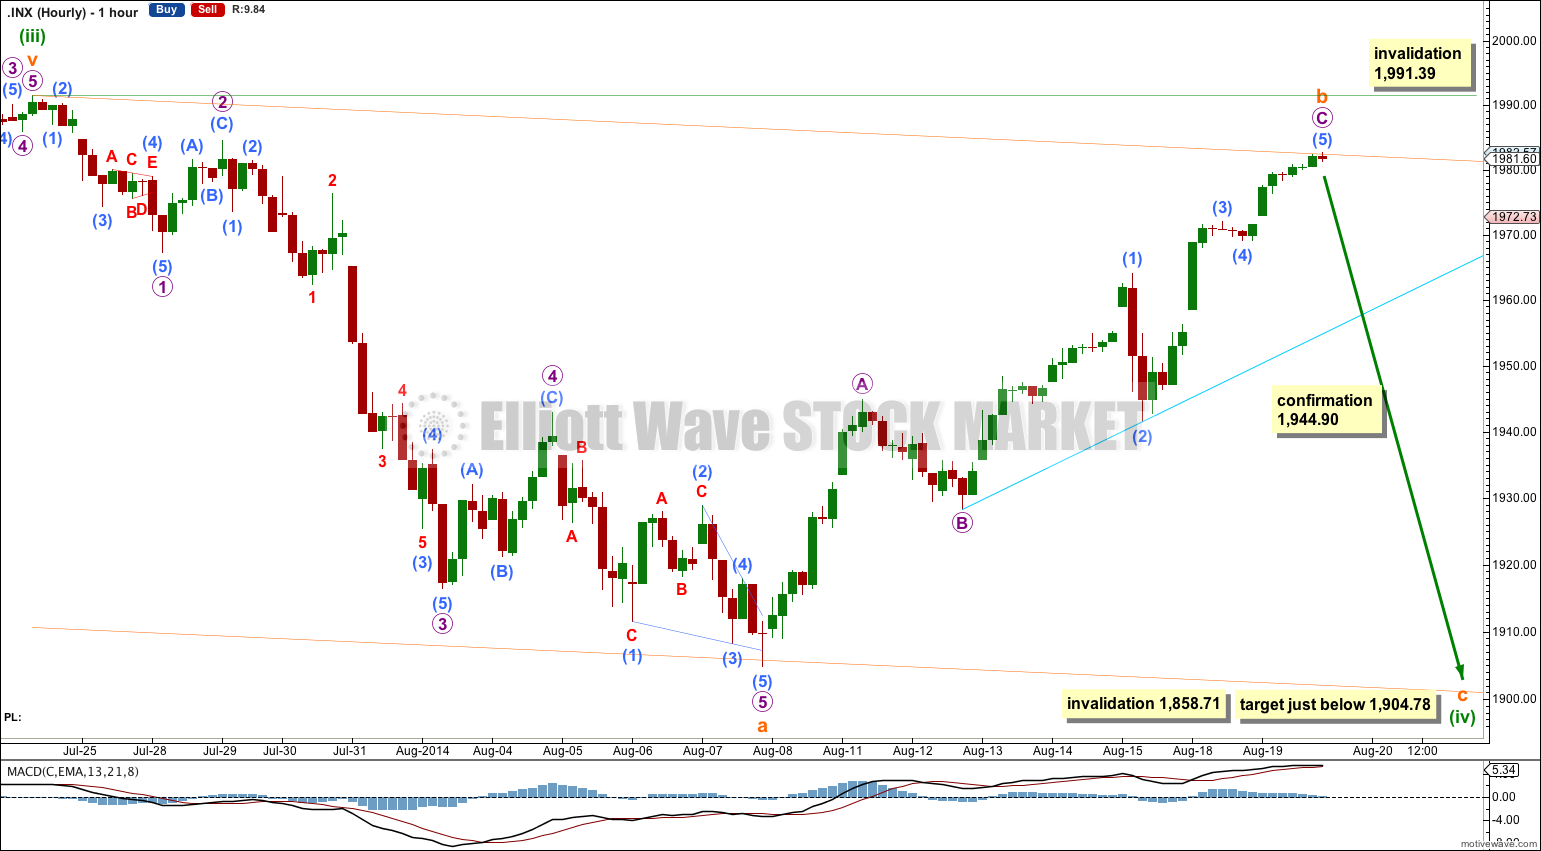
At the hourly chart level this main wave count still has the best fit and best overall look. So far upwards movement fits nicely as a zigzag for subminuette wave b.
Within subminuette wave b there is no Fibonacci ratio between micro waves A and C.
Ratios within micro wave C are: there is no Fibonacci ratio between submicro waves (3) and (1), and submicro wave (5) is just 0.36 points short of 0.382 the length of submicro wave (1).
Because subminuette wave a subdivides as a five wave impulse subminuette wave b may not move above 1,991.39. This invalidation point is not far away; there is not much room for upwards movement.
Movement below 1,944.90 would invalidate the alternate below and provide confirmation for this main wave count. Before that price point is passed though, I would have increased confidence in this main wave count if the aqua blue trend line is breached.
Subminuette wave c is very likely to end at least slightly below the end of subminuette wave a at 1,904.78 to avoid a truncation.
Alternate Hourly Wave Count.
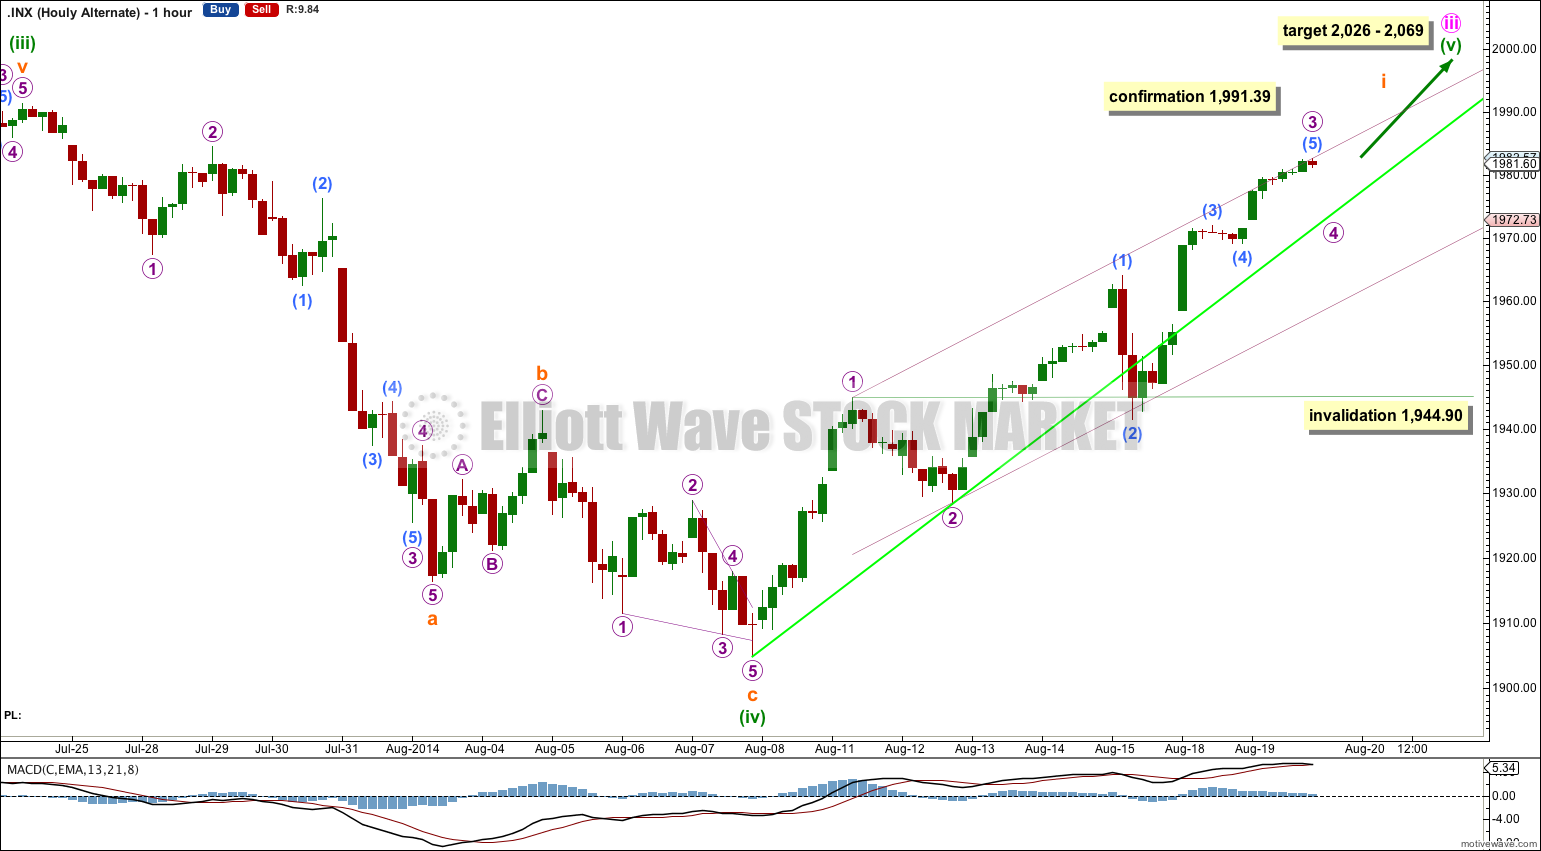
I have adjusted the wave count within the structure of minuette wave (iv) and this is much more satisfactory. Minuette wave (iv) may be a complete zigzag. Although if this is correct I would have expected it to have a clearer more obvious three wave look to it on the daily chart. If it is over as labeled here then it lasted only 10 days, compared to minuette wave (ii) at 34 days. This difference is quite large, but still somewhat an acceptable difference between a brief zigzag and a long lasting combination.
A further problem with this alternate is the breach of submicro wave (2) of a base channel drawn about micro waves 1 and 2, one degree higher (the lower trend line of the base channel only is shown on this chart today as a lime green line). This breach does not invalidate this alternate, but it does further reduce the probability.
Now that micro wave 3 would most likely be over I have redrawn the channel: draw the first trend line from the highs of micro waves 1 to 3, then place a parallel copy on the low of micro wave 2.
Micro wave 4 may not move into micro wave 1 price territory below 1,944.90. Micro wave 4 would be likely to remain contained with the channel drawn here. If it breaches this channel this wave count would further reduce in probability.
This alternate would be confirmed with movement above 1,991.39.
At 2,026 minuette wave (v) would reach equality in length with minuette wave (i). At 2,069 minute wave iii would reach 1.618 the length of minute wave i. This gives a rather wide target zone though and may be narrowed towards the end when the target can be calculated at subminuette wave degree as well.
Within micro wave 3 no second wave correction may move beyond the start of its first wave below 1,928.29.
Bearish Alternate Wave Count
This bearish alternate wave count expects that the correction is not over. The flat correction which ended at 666.79 was only cycle wave a (or w) of a larger super cycle second wave correction.
The structure and subdivisions within primary wave C for the bear wave count are the same as for intermediate wave (1) for the bull wave count. Thus the short to mid term outlook is identical.
The differentiation between the bull and bear wave count is the maroon – – – channel. The bull wave count should see price remain above the lower maroon – – – trend line. The bear wave count requires a clear breach of this trend line. If this trend line is breached by a full weekly candlestick below it and not touching it then this bear wave count would be my main wave count and I would then calculate downwards targets.
We should always assume the trend remains the same until proven otherwise; the trend is your friend. While price remains above the lower maroon – – – trend line I will assume that the S&P 500 remains within a bull market.
This analysis is published about 10:03 p.m. EST.