
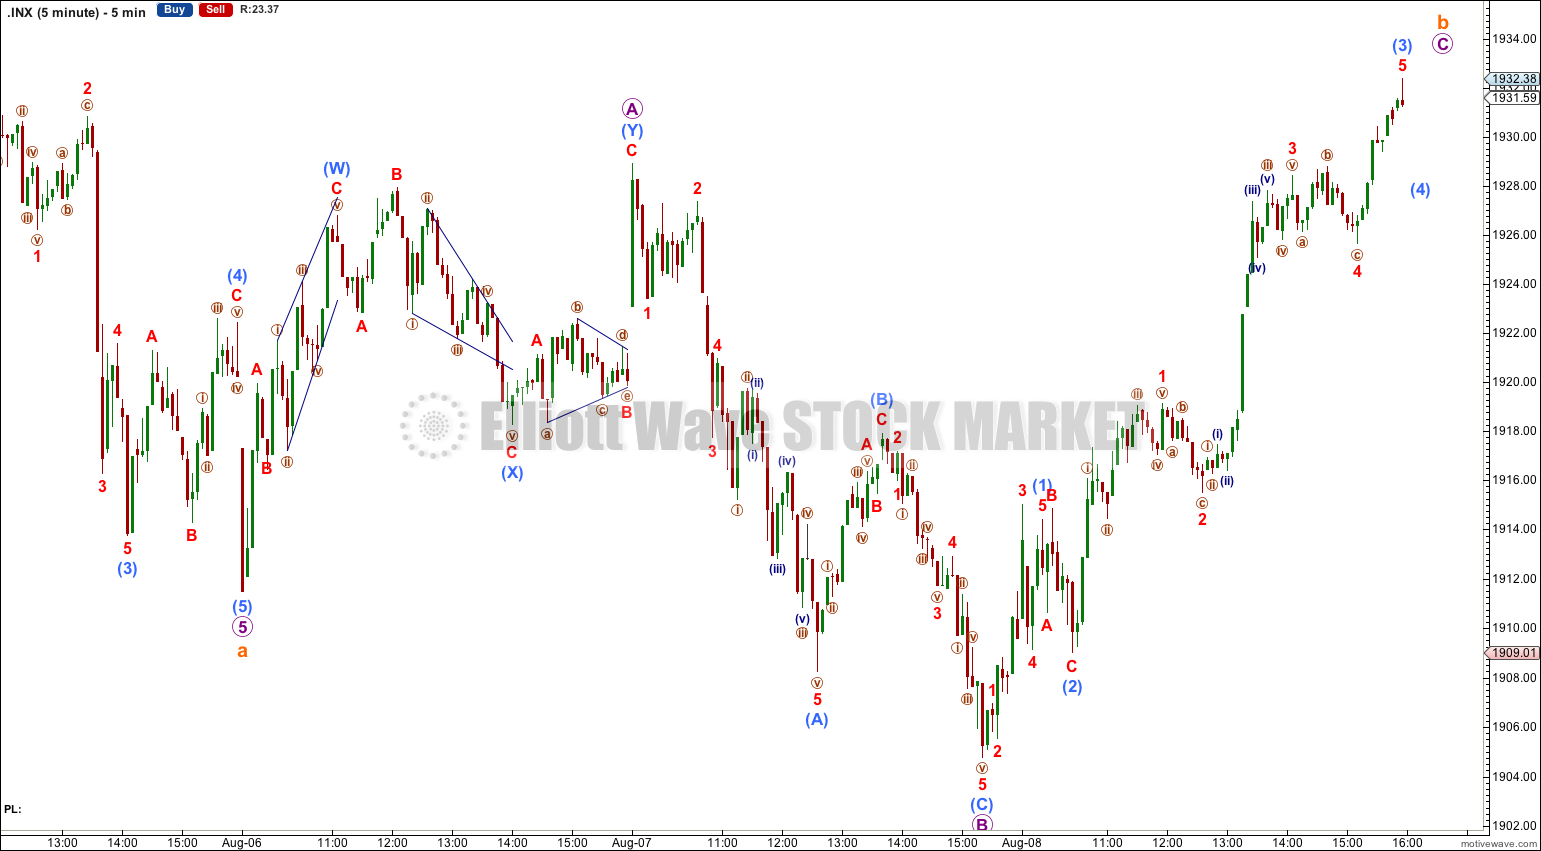
Last Elliott wave analysis expected upwards movement for Friday’s session to a short term target at 1,933. Upwards movement was exactly what happened, reaching 1,932.38.
The Elliott wave structure remains the same.
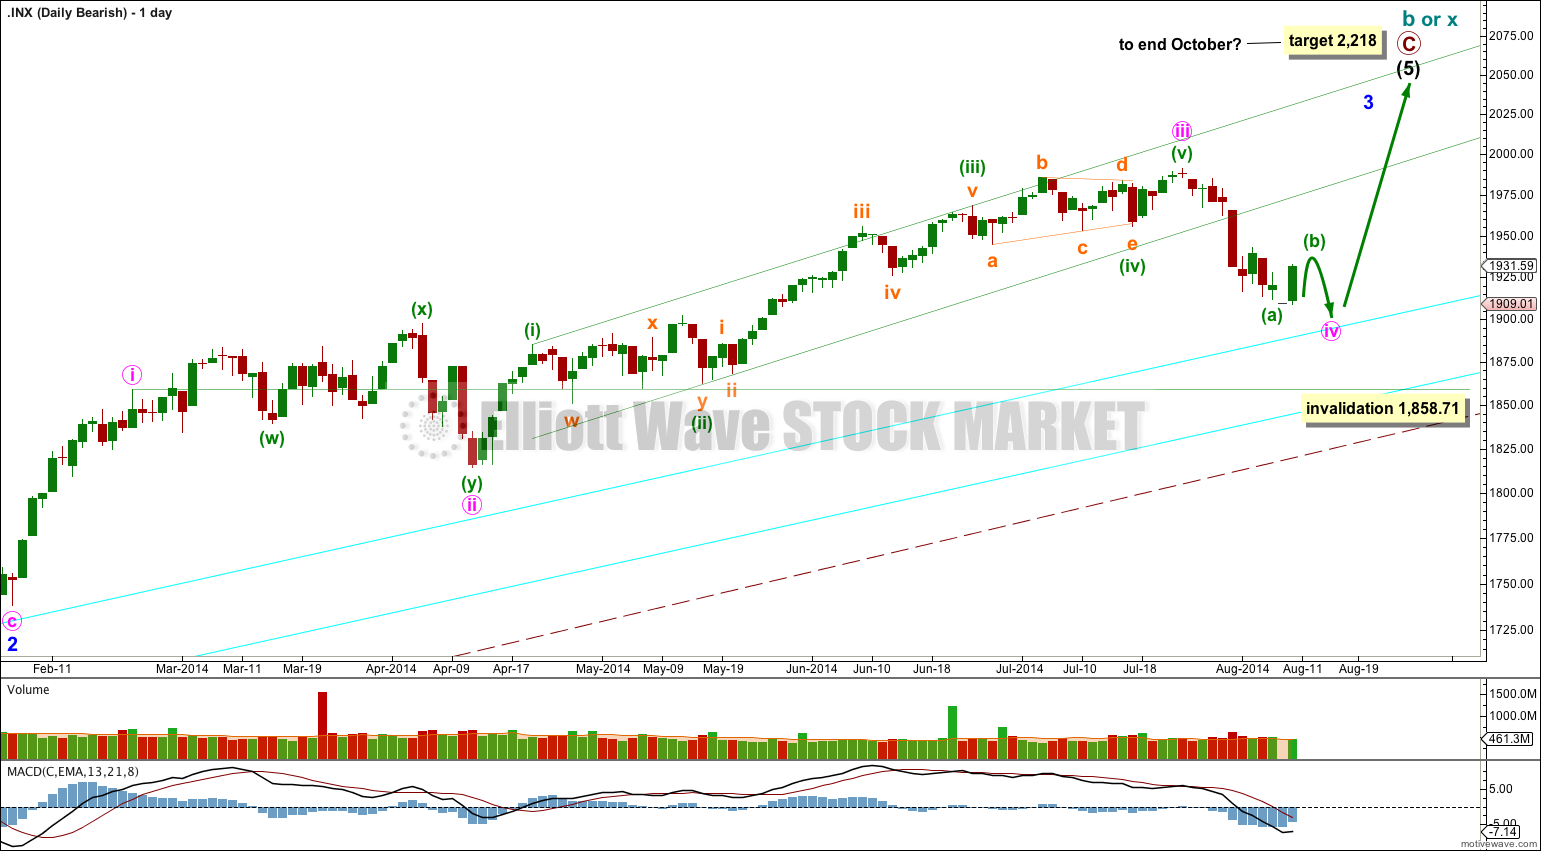
Summary: This fourth wave correction may end in two more days. I expect the sideways B wave to end on Monday and be followed by one final downwards wave which may find support and end at the upper aqua blue trend line. Alternatively, this fourth wave correction may continue for two more weeks (ten days) but this is less likely.
Click on charts to enlarge.
The aqua blue trend lines are critical. Draw the first trend line from the low of 1,158.66 on 25th November, 2011 to the next swing low at 1,266.74 on 4th June, 2012. Create a parallel copy and place it on the low at 1,560.33 on 24th June, 2013. While price remains above the lower of these two aqua blue trend lines we must assume the trend remains upwards. This is the main reason for the bullish wave count being my main wave count.
Bullish Wave Count.
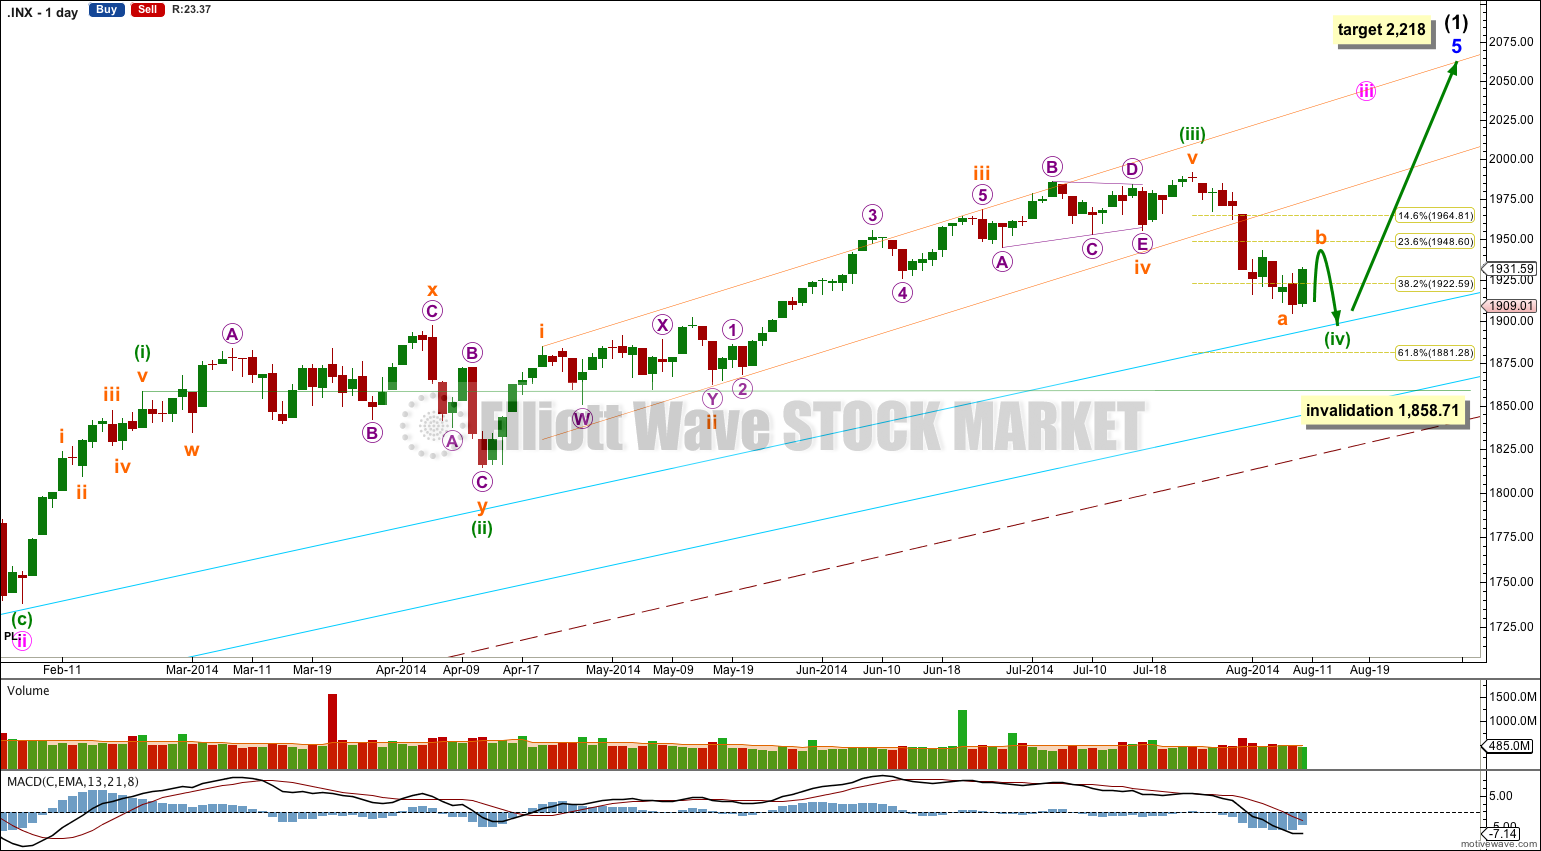
There are a couple of things about this wave count of which I am confident. I see minor wave 3 within intermediate wave (1) as over at 1,729.86 (19th September, 2013). It has the strongest upwards momentum and is just 0.76 longer than 2.618 the length of minor wave 1. At 455 days duration this is a remarkably close Fibonacci ratio. The subdivisions within it are perfect. If this is correct then minor wave 4 ends at 1,646.47 and this is where minor wave 5 begins.
Minor wave 5 is unfolding as an impulse. If minor wave 5 has passed its middle then I would expect to see more divergence between price and MACD develop over coming weeks.
Along the way up towards the final target I would expect to see two more corrections complete: the current correction for minuette wave (iv) and one more for minute wave iv.
Minuette wave (iv) may not move into minuette wave (i) price territory below 1,858.71.
At 2,218 minor wave 5 would reach equality in length with minor wave 3. This target may be met in October.
I have drawn a parallel channel about minuette wave (iii) using Elliott’s first technique: draw the first trend line from the highs of subminuette waves i to iii, then place a parallel copy on the low of subminuette wave ii. Minuette wave (iv) has arrived and breaches the channel about minuette wave (iii). Minuette wave (iv) may reach as low as the 0.618 Fibonacci ratio of minuette wave (iii) at 1,881.28, which would provide alternation in depth of correction between minuette waves (ii) and (iv), (minuette wave (ii) was a shallow 37% correction). Downwards movement may find final support about or just above the upper aqua blue trend line, continuing a pattern which has lasted about a year now.
The large maroon – – – channel is copied over from the weekly chart. It is drawn in exactly the same way on bull and bear wave counts. For the bull wave count this channel is termed a base channel about primary waves 1 and 2. A lower degree second wave should not breach the lower edge of a base channel drawn about a first and second wave one or more degrees higher. The lower maroon – – – trend line differentiates the bull and bear wave counts at cycle degree and monthly chart level.
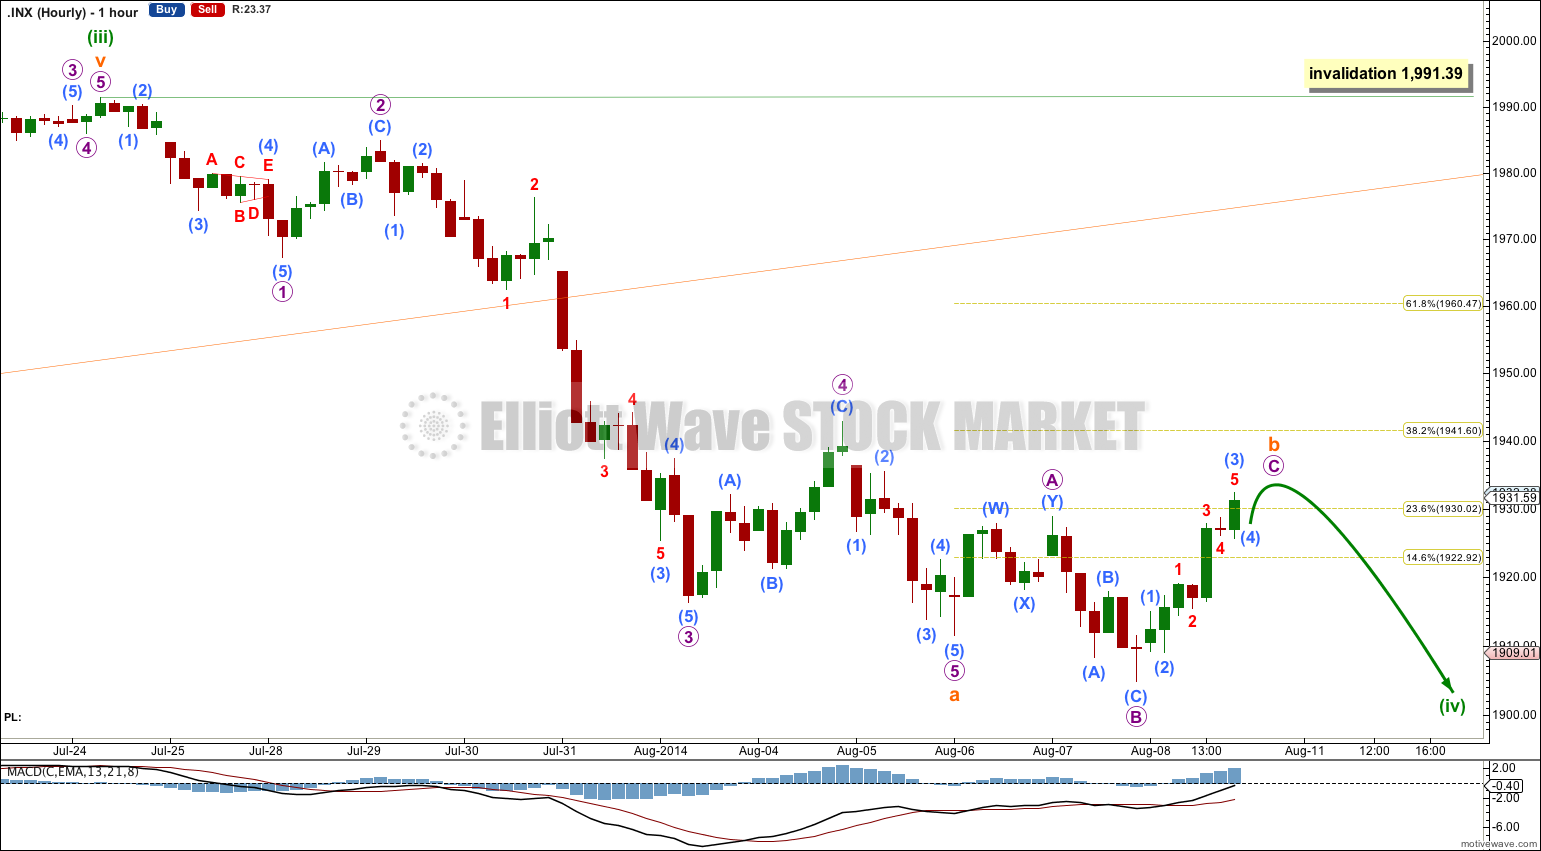
Main Hourly Wave Count.
I have moved the degree of labeling within subminuette wave b all up one degree. It is possible that it is almost complete. On the daily chart this looks most likely.
On the five minute chart submicro wave (5) upwards needs to complete the five wave impulse of micro wave C. I would expect submicro wave (5) to end slightly above 1,932.38 to avoid a truncated fifth wave.
If this correction for minuette wave (iv) ends in just two more days it would complete in a Fibonacci 13 days. This is possible and it would still be long lasting enough to give the wave count at the daily chart the “right look”.
If the next downwards movement subdivides as a five and not a three then this main wave count will be correct. I would look for downwards movement to find very strong support, and probably end, when price touches the upper aqua blue trend line on the daily chart.
Minuette wave (iv) may not move into minuette wave (i) price territory below 1,858.71.
Alternate Hourly Wave Count.
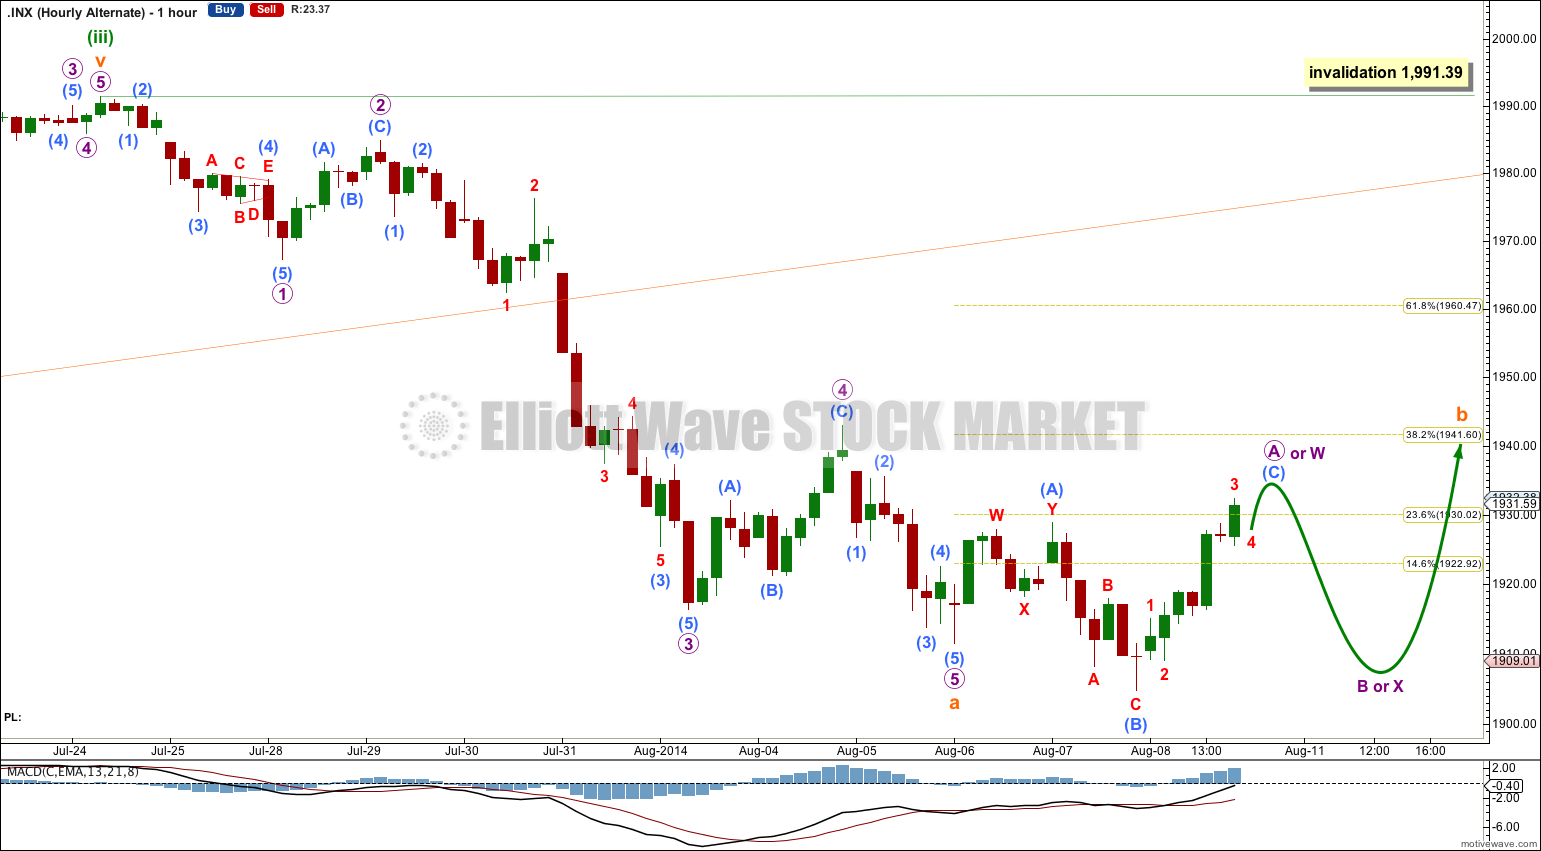
Subminuette wave b may still last longer and so only micro wave A (or W) within it may be almost over.
Thereafter, this alternate would expect mostly downwards movement for another three wave structure to begin on Monday. If subminuette wave b is a flat correction then within it micro wave B must reach a minimum 90% length of micro wave A. Micro wave B may make a new low below the start of micro wave A.
If subminuette wave b is a double flat or double combination then within it micro wave X must be a corrective structure and there is no minimum downwards requirement for it in relation to micro wave W.
Overall this main hourly wave count expects more sideways movement for a few more days. So far minuette wave (iv) has lasted 11 days. If it continues for another 10 days it may end in a total Fibonacci 21 days, and would have a Fibonacci ratio to the duration of minuette wave (ii) which lasted a Fibonacci 34 days.
Subminuette wave b may not move beyond the start of subminuette wave a above 1,991.39.
Bearish Alternate Wave Count
This bearish alternate wave count expects that the correction is not over. The flat correction which ended at 666.79 was only cycle wave a (or w) of a larger super cycle second wave correction.
The structure and subdivisions within primary wave C for the bear wave count are the same as for intermediate wave (1) for the bull wave count. Thus the short to mid term outlook is identical.
The differentiation between the bull and bear wave count is the maroon – – – channel. The bull wave count should see price remain above the lower maroon – – – trend line. The bear wave count requires a clear breach of this trend line. If this trend line is breached by a full weekly candlestick below it and not touching it then this bear wave count would be my main wave count and I would then calculate downwards targets.
We should always assume the trend remains the same until proven otherwise; the trend is your friend. While price remains above the lower maroon – – – trend line I will assume that the S&P 500 remains within a bull market.
This analysis is published about 04:11 a.m. EST.
Thx Lara! I really get confused with the frequent changing of the degree of labeling. I would agree it’s the hardest part of EW by far. You stress having the right look which is great. However, I really think the alternate has the better look than the main. Subminuette a lasted about 8 days so I think subminuette b needs to last a little longer than 3 days. I also think it would have a better look retracing at least into the 1940’s on the daily. Currently, the main wave count suggests it will not even come close. Anyway, just my thoughts and opinion. Have a good rest of the weekend!