
A new low and downwards movement still fits the current Elliott wave count.
Summary: I expect that a low degree B wave has begun and may take about five to seven days in total to unfold. B waves exhibit the greatest variety in form and structure of all Elliott waves. There are more than thirteen possible structures of a B wave. It will most likely be very choppy and overlapping. Alternate wave counts will be essential, and the wave count will change as the structure unfolds. In more traditional technical analysis terms I expect the S&P has begun a sideways consolidation phase. For tomorrow I expect a green candlestick, with upwards movement to a short term target at 1,933.
Click on charts to enlarge.
The aqua blue trend lines are critical. Draw the first trend line from the low of 1,158.66 on 25th November, 2011 to the next swing low at 1,266.74 on 4th June, 2012. Create a parallel copy and place it on the low at 1,560.33 on 24th June, 2013. While price remains above the lower of these two aqua blue trend lines we must assume the trend remains upwards. This is the main reason for the bullish wave count being my main wave count.
Bullish Wave Count.
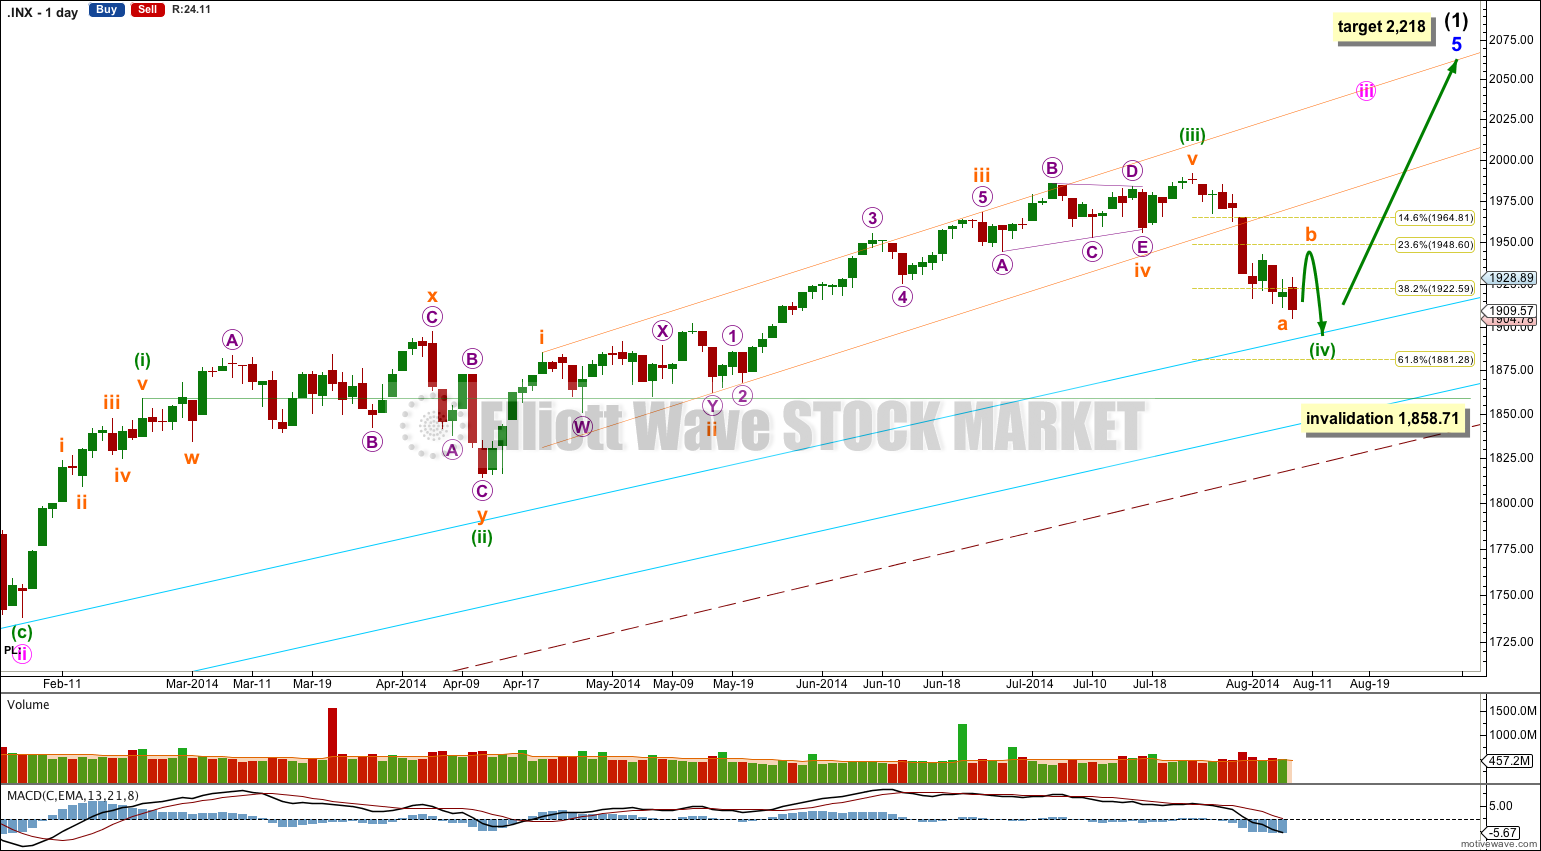
There are a couple of things about this wave count of which I am confident. I see minor wave 3 within intermediate wave (1) as over at 1,729.86 (19th September, 2013). It has the strongest upwards momentum and is just 0.76 longer than 2.618 the length of minor wave 1. At 455 days duration this is a remarkably close Fibonacci ratio. The subdivisions within it are perfect. If this is correct then minor wave 4 ends at 1,646.47 and this is where minor wave 5 begins.
Minor wave 5 is unfolding as an impulse. If minor wave 5 has passed its middle then I would expect to see more divergence between price and MACD develop over coming weeks.
Along the way up towards the final target I would expect to see two more corrections complete: the current correction for minuette wave (iv) and one more for minute wave iv.
Minuette wave (iv) may not move into minuette wave (i) price territory below 1,858.71.
At 2,218 minor wave 5 would reach equality in length with minor wave 3. This target may be met in October.
I have drawn a parallel channel about minuette wave (iii) using Elliott’s first technique: draw the first trend line from the highs of subminuette waves i to iii, then place a parallel copy on the low of subminuette wave ii. Minuette wave (iv) has arrived and breaches the channel about minuette wave (iii). Minuette wave (iv) may reach as low as the 0.618 Fibonacci ratio of minuette wave (iii) at 1,881.28, which would provide alternation in depth of correction between minuette waves (ii) and (iv), (minuette wave (ii) was a shallow 37% correction). Downwards movement may find final support about or just above the upper aqua blue trend line, continuing a pattern which has lasted about a year now.
The large maroon – – – channel is copied over from the weekly chart. It is drawn in exactly the same way on bull and bear wave counts. For the bull wave count this channel is termed a base channel about primary waves 1 and 2. A lower degree second wave should not breach the lower edge of a base channel drawn about a first and second wave one or more degrees higher. The lower maroon – – – trend line differentiates the bull and bear wave counts at cycle degree and monthly chart level.
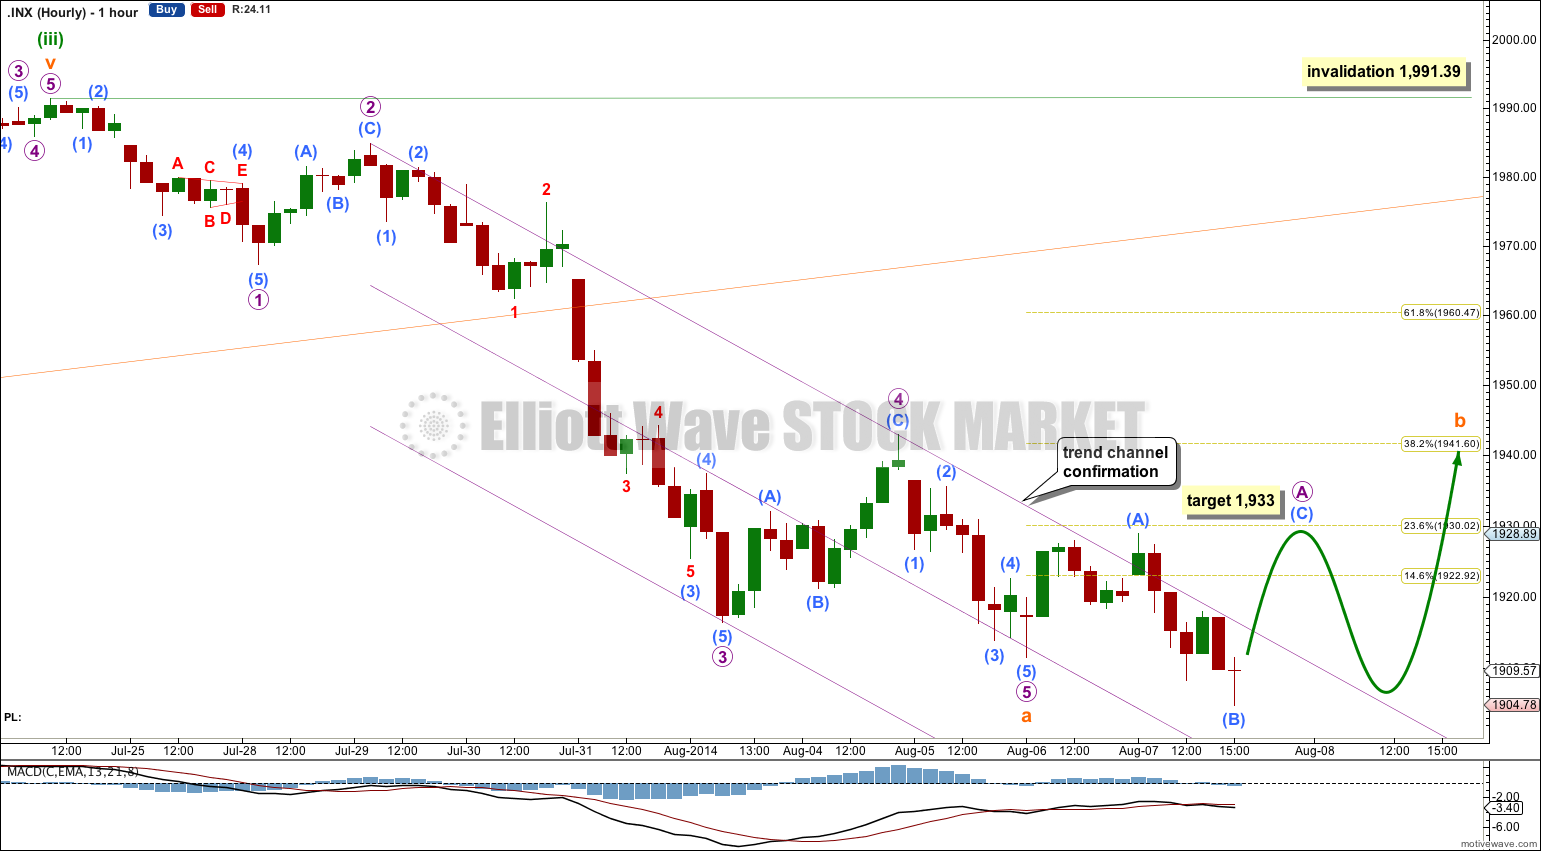
Although the channel about subminuette wave a is not breached yet, sideways movement of the last thirteen hours trading is in three wave structures. This fits as the start of subminuette wave b and not as a continuation of subminuette wave a.
Subminuette wave b may be unfolding as a single flat correction where micro wave A subdivides as a three, itself an expanded flat.
Subminuette wave b may also be unfolding as a double flat correction. It may also be a running triangle.
All these options are sideways and most often shallow corrections. I would now expect subminuette wave b to be reasonably likely to reach only up to the 0.382 Fibonacci ratio of subminuette wave a about 1,941.60.
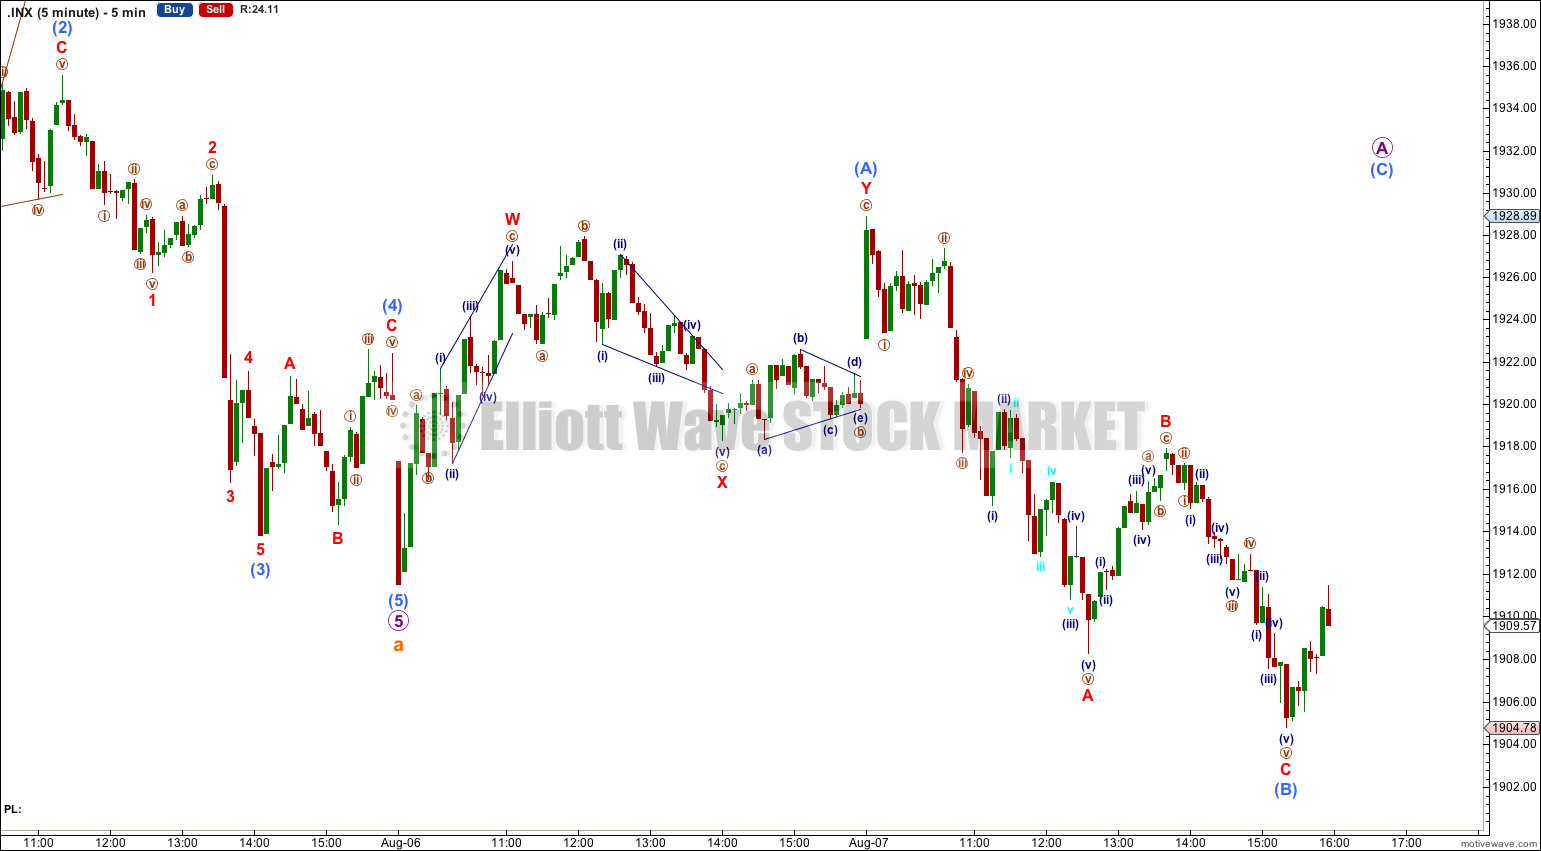
Within micro wave A submicro wave (B) is a 138% correction of submicro wave (A). At 1,933 submicro wave (C) would reach 1.618 the length of submicro wave (A).
Thereafter, micro wave B may make a new low below the start of micro wave A at 1,911.45, or if subminuette wave b is a combination or triangle the downwards wave to follow may not make a new low below 1,911.45.
Overall I expect to see very choppy overlapping sideways movement for a few days. As more structure unfolds and the possibilities narrow (or expand) the wave count will probably change in coming days for this piece of movement.
Subminuette wave b may not move beyond the start of subminuette wave a above 1,991.39.
Bearish Alternate Wave Count
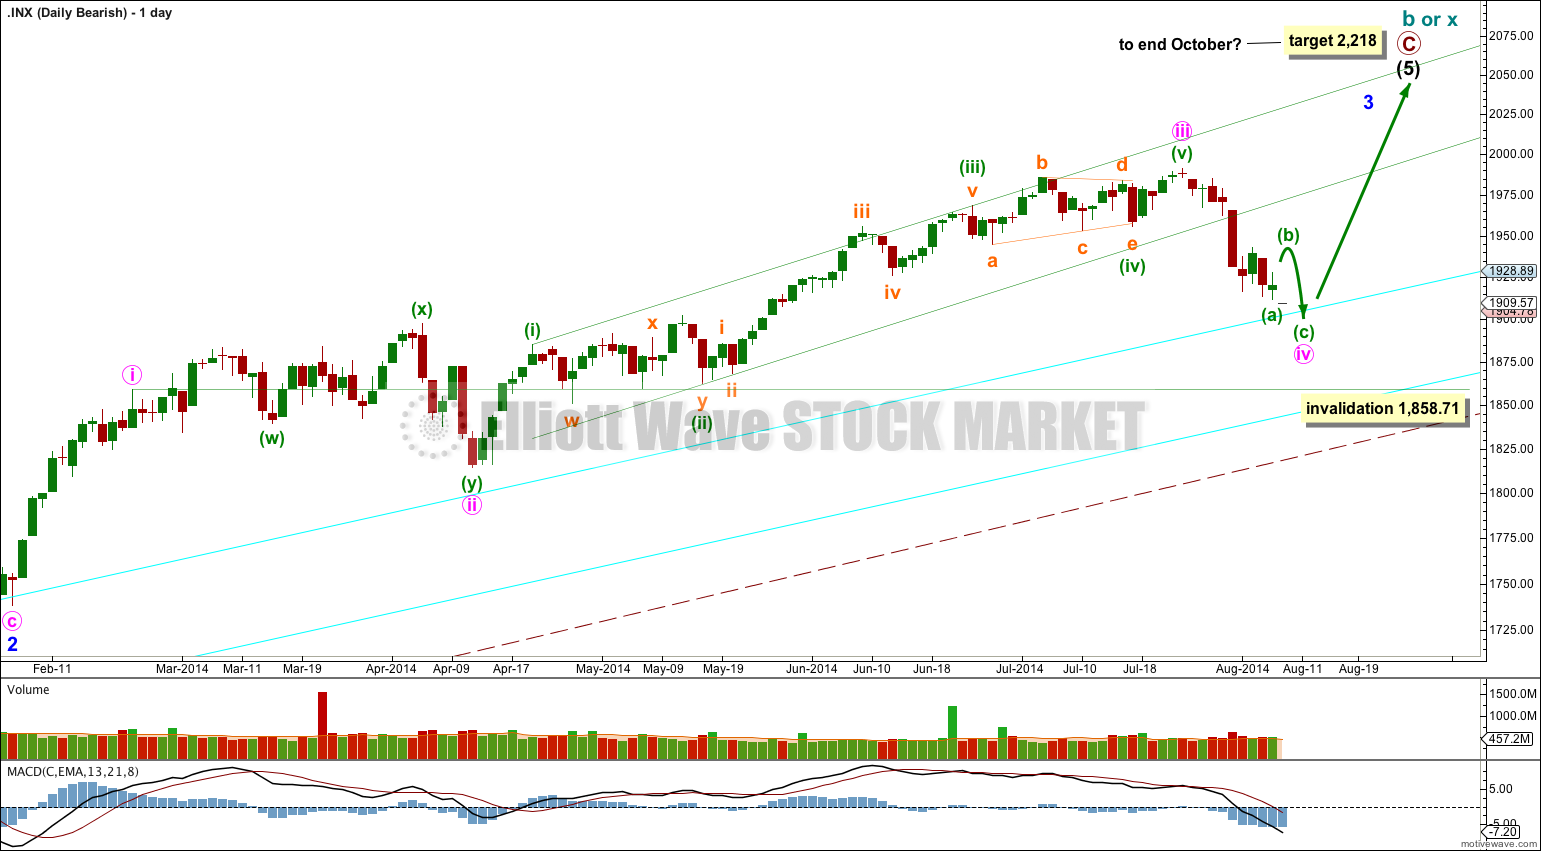
This bearish alternate wave count expects that the correction is not over. The flat correction which ended at 666.79 was only cycle wave a (or w) of a larger super cycle second wave correction.
The structure and subdivisions within primary wave C for the bear wave count are the same as for intermediate wave (1) for the bull wave count. Thus the short to mid term outlook is identical.
The differentiation between the bull and bear wave count is the maroon – – – channel. The bull wave count should see price remain above the lower maroon – – – trend line. The bear wave count requires a clear breach of this trend line. If this trend line is breached by a full weekly candlestick below it and not touching it then this bear wave count would be my main wave count and I would then calculate downwards targets.
We should always assume the trend remains the same until proven otherwise; the trend is your friend. While price remains above the lower maroon – – – trend line I will assume that the S&P 500 remains within a bull market.
This analysis is published about 06:57 p.m. EST.