
The alternate daily Elliott wave count was confirmed with movement above 1,973.72. I have just the one wave count for you today.
Summary: Upwards movement is not over. But for the short term I expect to see a small fourth wave correction. It should move lower, the target is 1,941, and it should last at least another five days and maybe up to twelve days.
Click on charts to enlarge.
The aqua blue trend lines are critical. Draw the first trend line from the low of 1,158.66 on 25th November, 2011 to the next swing low at 1,266.74 on 4th June, 2012. Create a parallel copy and place it on the low at 1,560.33 on 24th June, 2013. While price remains above the lower of these two aqua blue trend lines we must assume the trend remains upwards. This is the main reason for the bullish wave count being my main wave count.
Bullish Wave Count.
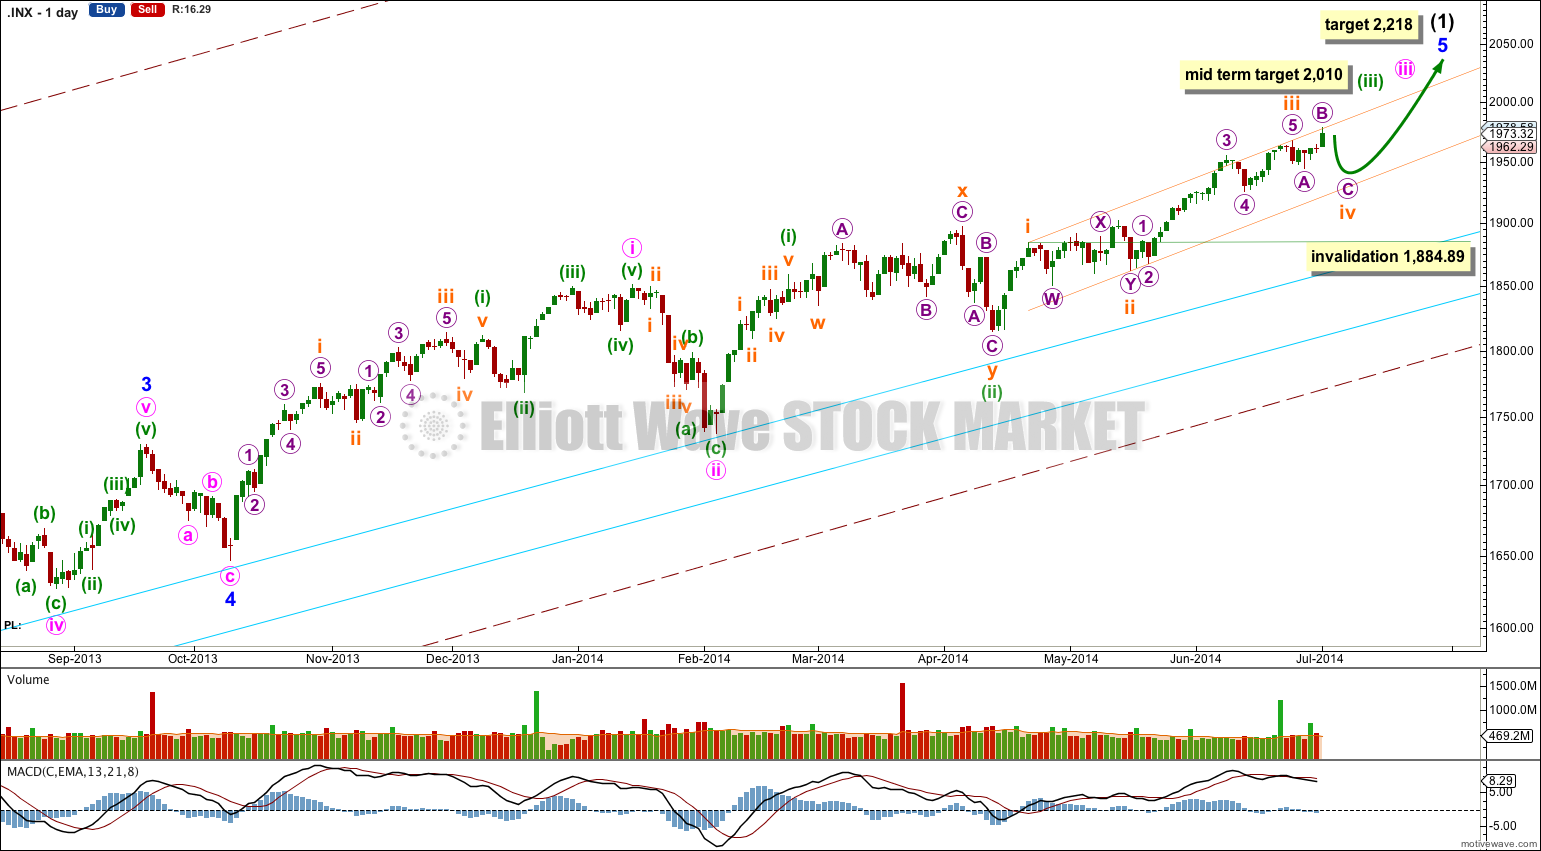
This bullish wave count expects a cycle degree correction was over at 666.79 for a fourth wave, and a new cycle degree bull market began there for a fifth wave. Within cycle wave V primary waves 1 and 2 are complete. Within primary wave 3 intermediate wave (1) must be incomplete.
There are a couple of things about this wave count of which I am confident. I see minor wave 3 within intermediate wave (1) as over at 1,729.86 as labeled. It has the strongest upwards momentum and is just 0.76 longer than 2.618 the length of minor wave 1. At 455 days duration this is a remarkably close Fibonacci ratio. The subdivisions within it are perfect. If this is correct then minor wave 4 ends at 1,646.47 and this is where minor wave 5 begins.
Minor wave 5 may be only one of two structures: a simple impulse or an ending diagonal. At this stage an ending diagonal looks less likely, and current upwards movement is looking like a third wave so a more common impulse is more likely.
Along the way up towards the final target I would expect to see three more corrections complete. The first for subminuette wave iv is most likely to be somewhat in proportion to subminuette wave ii which lasted 17 days. So far subminuette wave iv has lasted five days and so it is very likely to continue.
Subminuette wave iv may not move into subminuette wave i price territory.
At 2,010 minuette wave (iii) would reach 1.618 the length of minuette wave (i).
At 2,218 minor wave 5 would reach equality in length with minor wave 3.
I have drawn a parallel channel about minuette wave (iii) using Elliott’s first technique: draw the first trend line from the highs of subminuette waves i to iii, then place a parallel copy on the low of subminuette wave ii. Today’s upwards movement perfectly found resistance at the upper edge of this channel. If it gets down that far I would expect subminuette wave iv to find support at the lower edge.
There is still divergence with price trending higher and MACD trending lower on the weekly chart, and a little on the daily chart for most recent movement. This classic technical divergence supports indicates that a correction should unfold.
Main Hourly Wave Count.
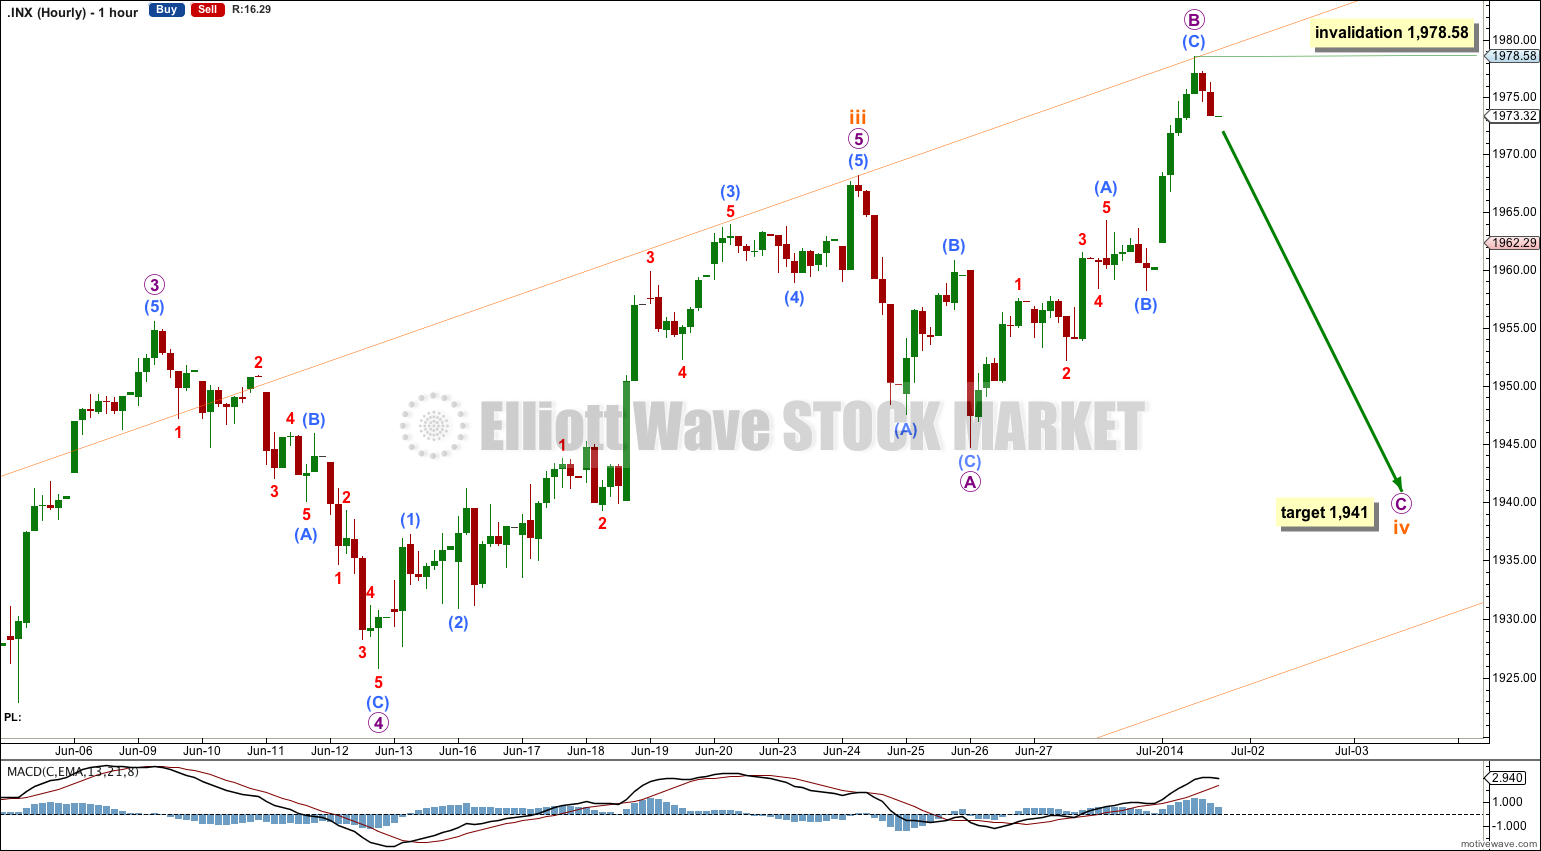
There are multiple possibilities for subminuette wave iv. It is likely to show structural alternation with subminuette wave ii which was a double combination. Subminuette wave iv is most likely to be a flat correction or a triangle. A flat is more common than a triangle, and so this is my main hourly wave count.
At 1,941 micro wave C would reach 1.618 the length of micro wave A.
Within micro wave C no second wave correction may move beyond the start of its first wave above 1,978.58.
Alternate Hourly Wave Count.
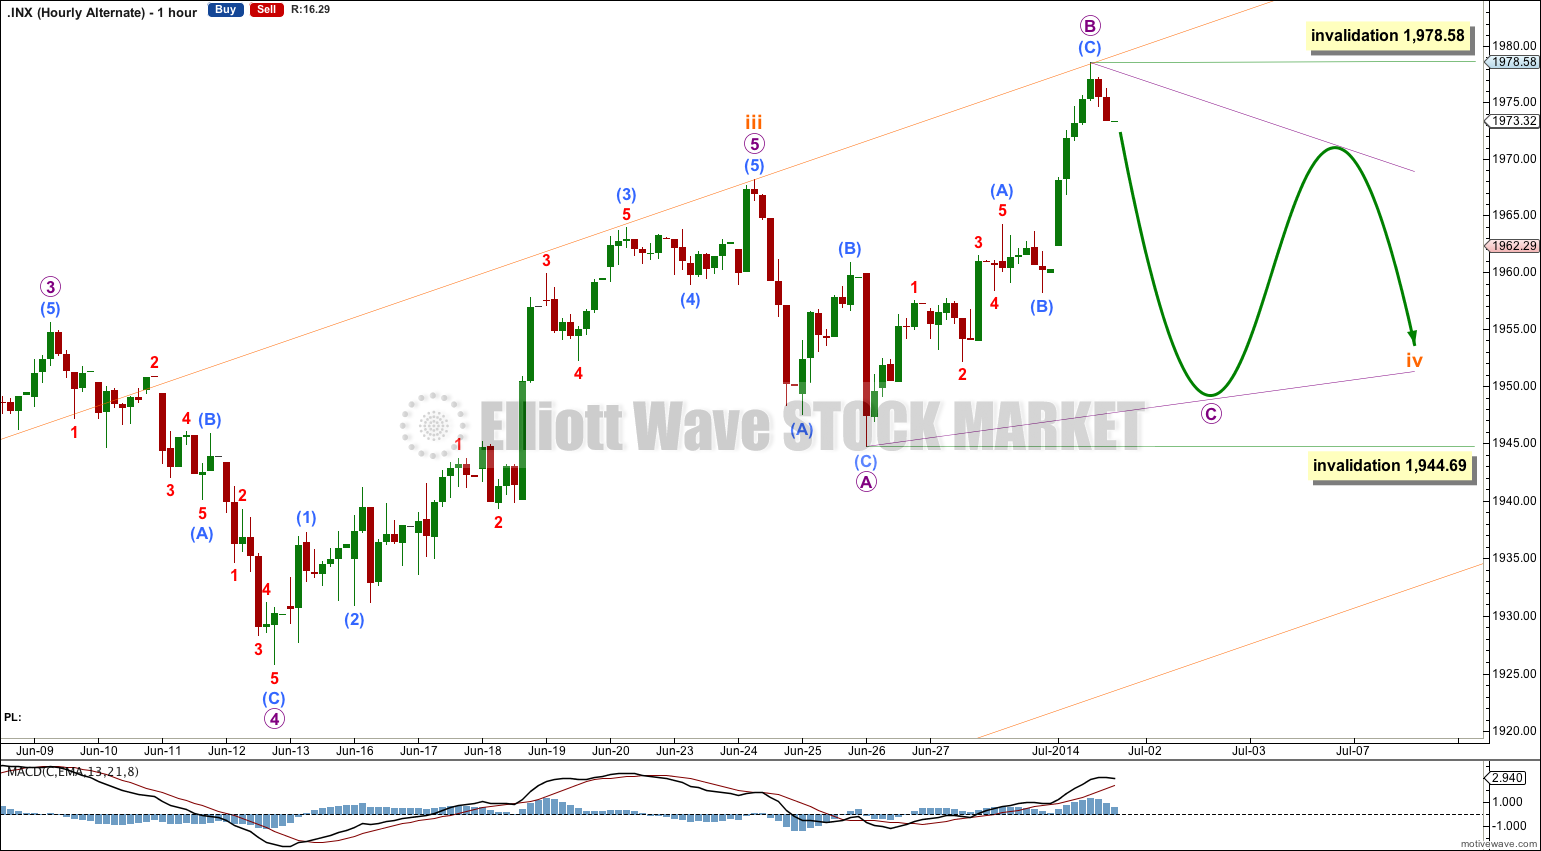
It is also entirely possible that subminuette wave iv may unfold as a running contracting triangle.
This alternate wave count expects choppy overlapping sideways movement for several more days. This wave count could see subminuette wave iv lasting as long, or nearly as long, as subminuette wave ii which lasted 17 days.
Within a contracting triangle micro wave C may not move beyond the end of micro wave A at 1,944.69. Micro wave D may not move beyond the end of micro wave B at 1,978.58.
Bearish Alternate Wave Count.
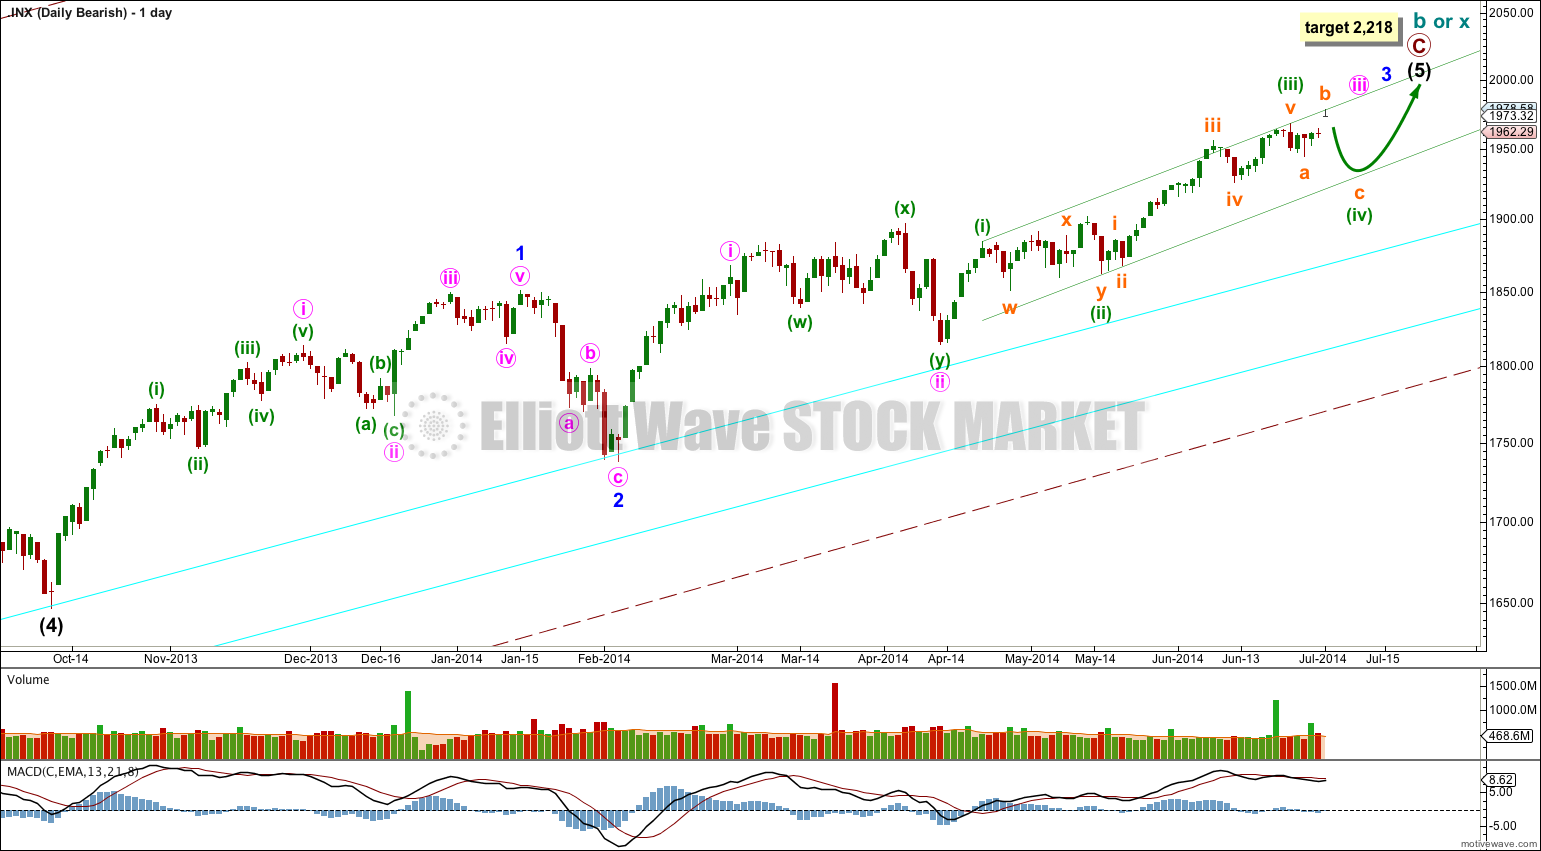
This bearish alternate wave count expects that the correction is not over. The flat correction which ended at 666.79 was only cycle wave a (or w) of a larger super cycle second wave correction.
Cycle wave b (or x) is now longer than the maximum common length of 138% for a B wave of a flat correction, at 150%.
A clear breach of the large maroon – – – channel on the monthly and weekly charts is required for confirmation of this wave count. If that happens then this would be my main wave count and would be strongly favoured. Only once this wave count is confirmed will I calculate downwards targets for cycle wave c (or y) for you; it would be premature to do that prior to confirmation.
Within cycle wave c no second wave correction may move beyond the start of its first wave. Once a trend change is confirmed then this bearish wave count will have an invalidation point at 1,968.17.
This analysis is published about 08:38 p.m. EST.