
Last Elliott wave count expected downwards movement. We do have a tiny red doji candlestick, but price remains above the confidence point.
Summary: The downwards structure is giving cause for concern. I want to see price break below 1,925.78 to have any confidence in a trend change. While price remains above this point I will accept the possibility of a new high. In preparation for that possibility I have an alternate daily chart for you today.
Click on charts to enlarge.
The aqua blue trend lines are critical. Draw the first trend line from the low of 1,158.66 on 25th November, 2011 to the next swing low at 1,266.74 on 4th June, 2012. Create a parallel copy and place it on the low at 1,560.33 on 24th June, 2013. While price remains above the lower of these two aqua blue trend lines we must assume the trend remains upwards. This is the main reason for the bullish wave count being my main wave count.
Bullish Wave Count.
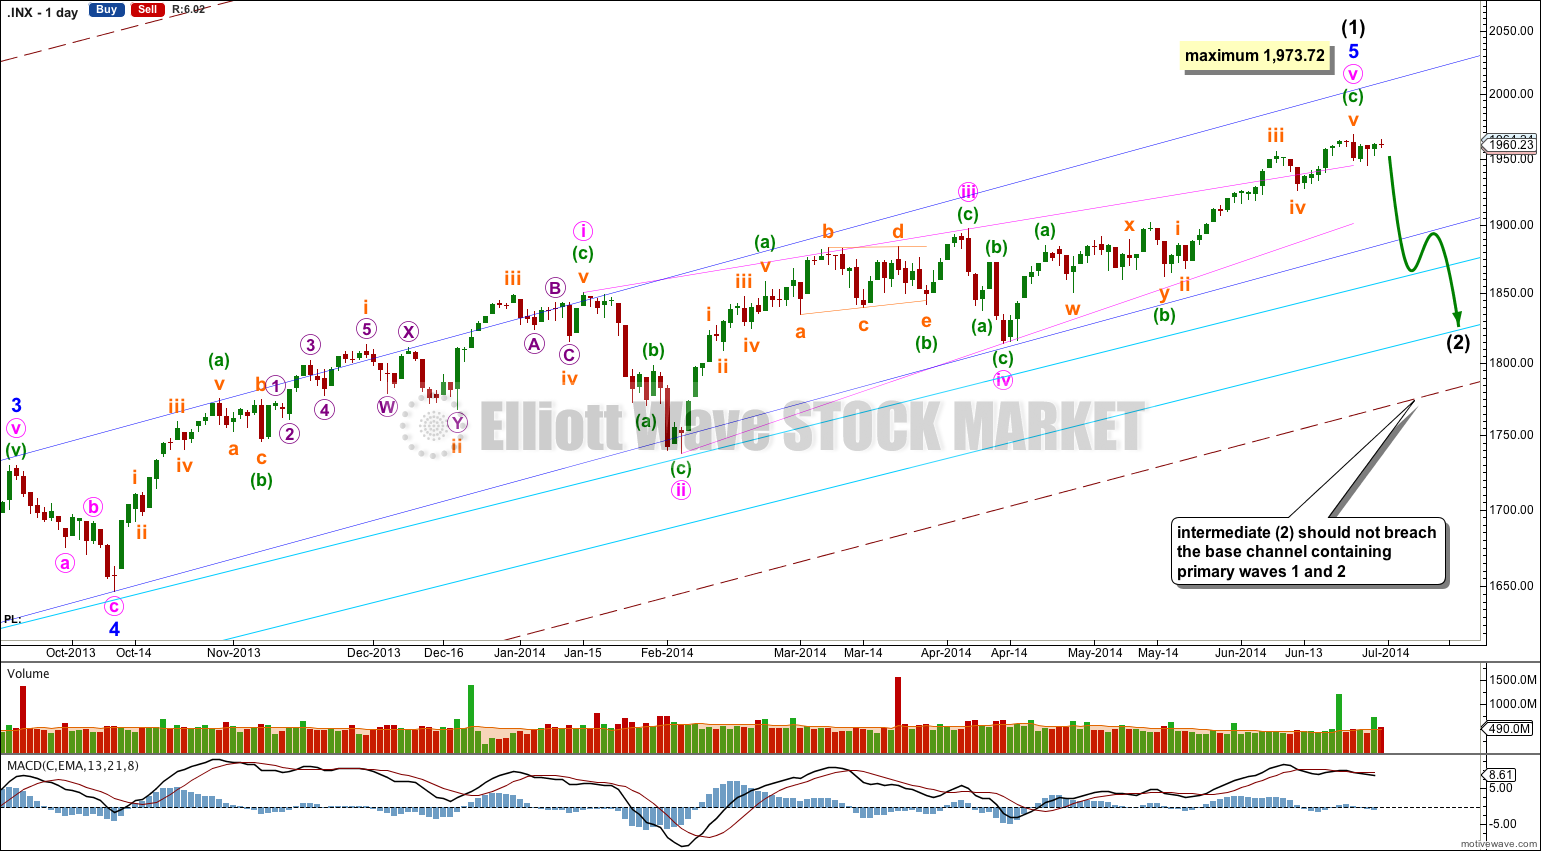
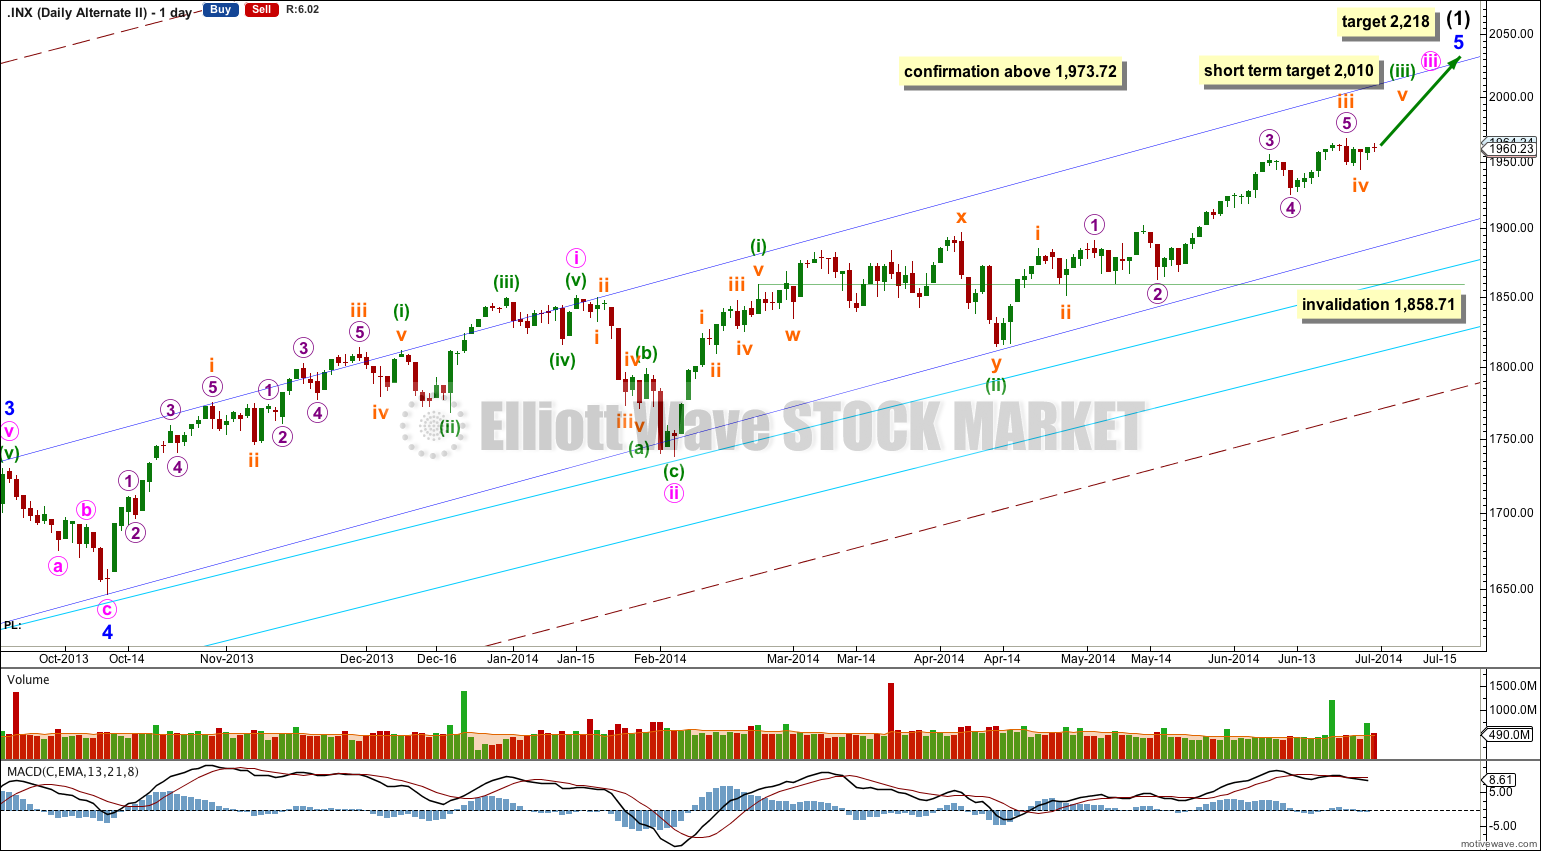
This bullish wave count expects a cycle degree correction was over at 666.79 for a fourth wave, and a new cycle degree bull market began there for a fifth wave. Within cycle wave V primary waves 1 and 2 are complete. Within primary wave 3 intermediate wave (1) may be over here.
Minor wave 5 is a complete ending contracting diagonal. Within an ending diagonal all the subwaves must be single zigzags, and the fourth wave should overlap first wave price territory.
Contracting diagonals commonly end with an overshoot of the 1-3 trend line. Apparently (according to Frost and Prechter, EWP page 38) the overshoot always occurs with a volume spike (I have not noticed this to be so). The S&P 500 had a volume spike at the end of this pattern. Is this the final piece of the puzzle for this structure? It may end here.
But while we have no confirmation of a high in place we must accept the possibility of more upwards movement.
The diagonal is contracting because minute wave iii is shorter than minute wave i. Minute wave v may not be longer than equality with minute wave iii at 1,973.72 because a third wave may never be the shortest wave. So if we see more upwards movement and new highs I do not expect to see movement above 1,973.72 in the mid term.
There is divergence with price trending higher and MACD trending lower on the weekly chart, and a little on the daily chart for most recent movement. This classic technical divergence supports this wave count and indicates that at least a reasonably sized correction should arrive soon. By reasonably sized I mean in fitting with this bullish wave count: Intermediate wave (2) should last at least two weeks, and more likely about five weeks. It should not breach the lower aqua blue trend line nor the lower edge of the maroon – – – channel. The wave count remains bullish at primary degree.
Main Hourly Wave Count.
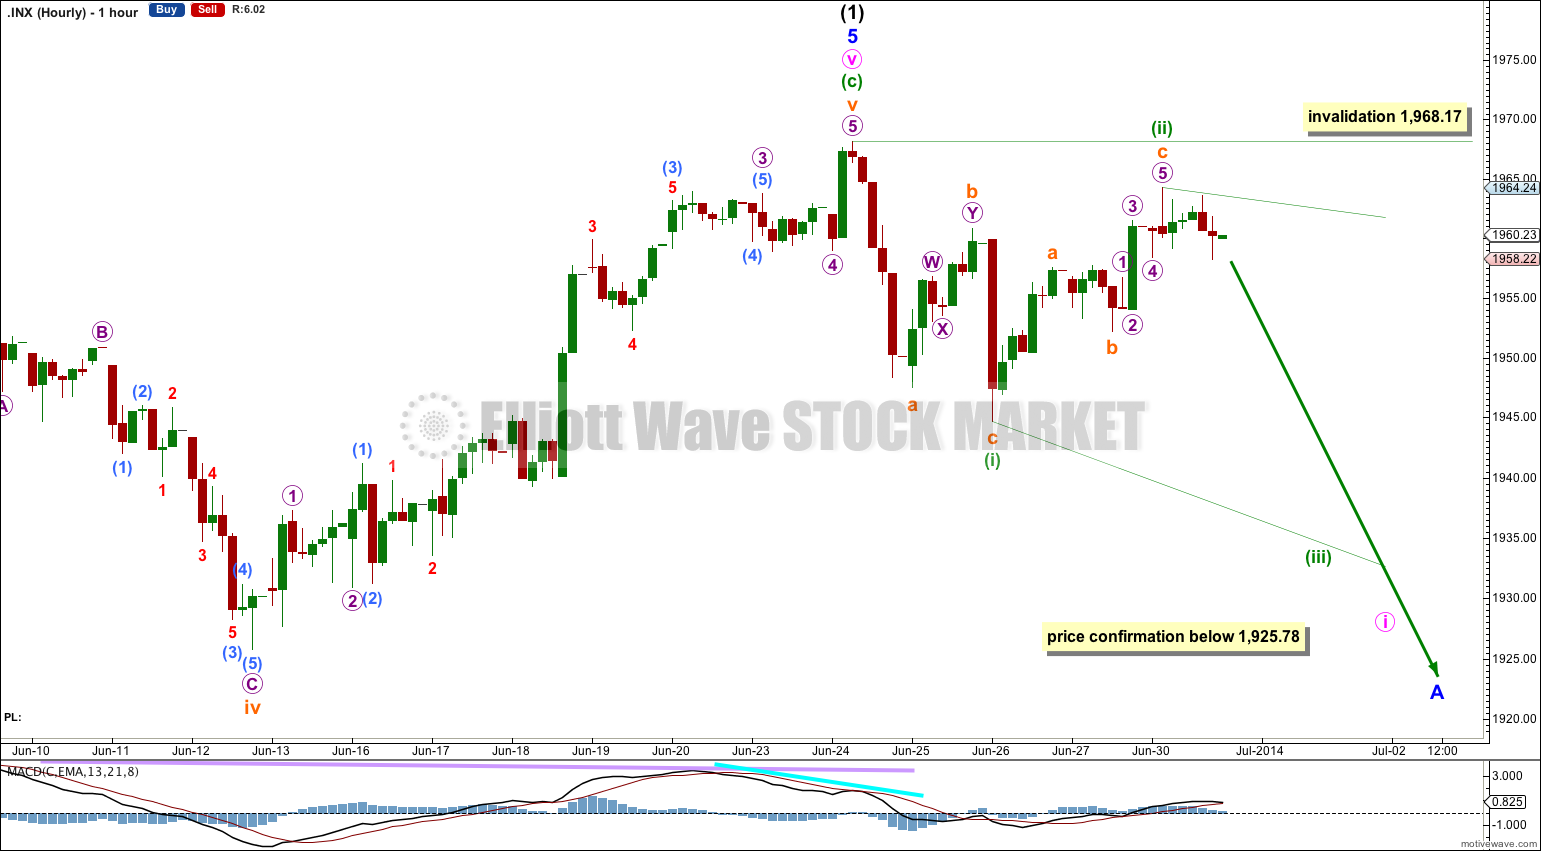
So far there is still not a clear five down on the hourly chart, and price remains above the confirmation point at 1,925.78. I do not have confidence in this trend change yet.
There may be a leading diagonal unfolding downwards. Minuette wave (ii) is now a 0.83 length of minuette wave (i), just beyond the normal range of 0.66 to 0.81.
Minuette wave (iii) must make a new low below the end of minuette wave (i) at 1,944.69. Thereafter, minuette wave (iv) upwards must overlap back into minuette wave (i) price territory.
A leading diagonal would expect choppy overlapping downwards movement. If this unfolds correctly then we would have a clear five down on the hourly chart, and I would have confidence in a trend change at 1,968.17.
Minuette wave (ii) may not move beyond the start of minuette wave (i) above 1,968.17.
Alternate Hourly Wave Count.
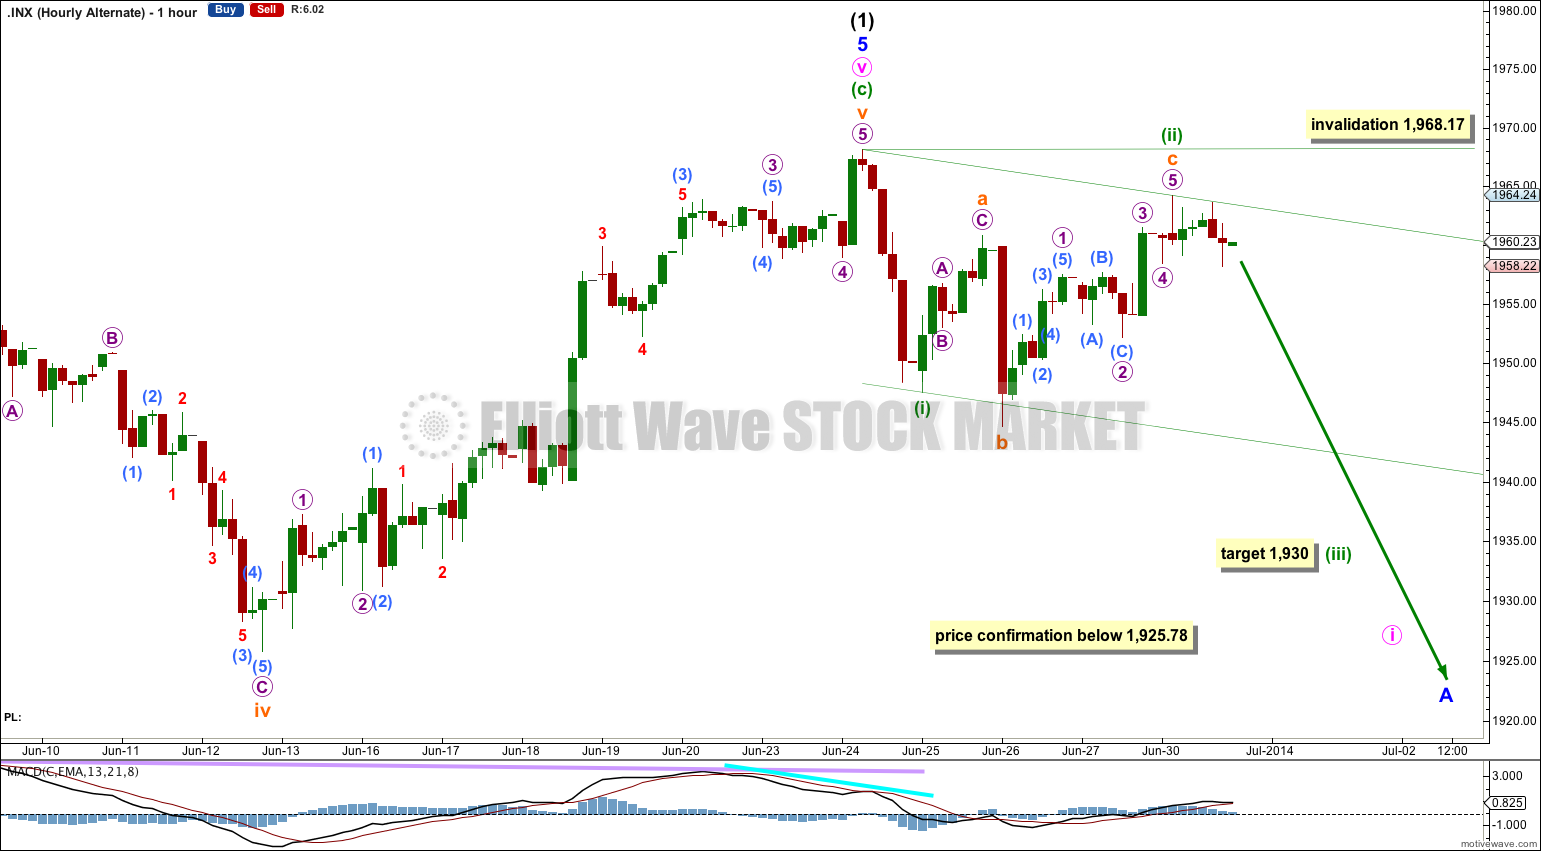
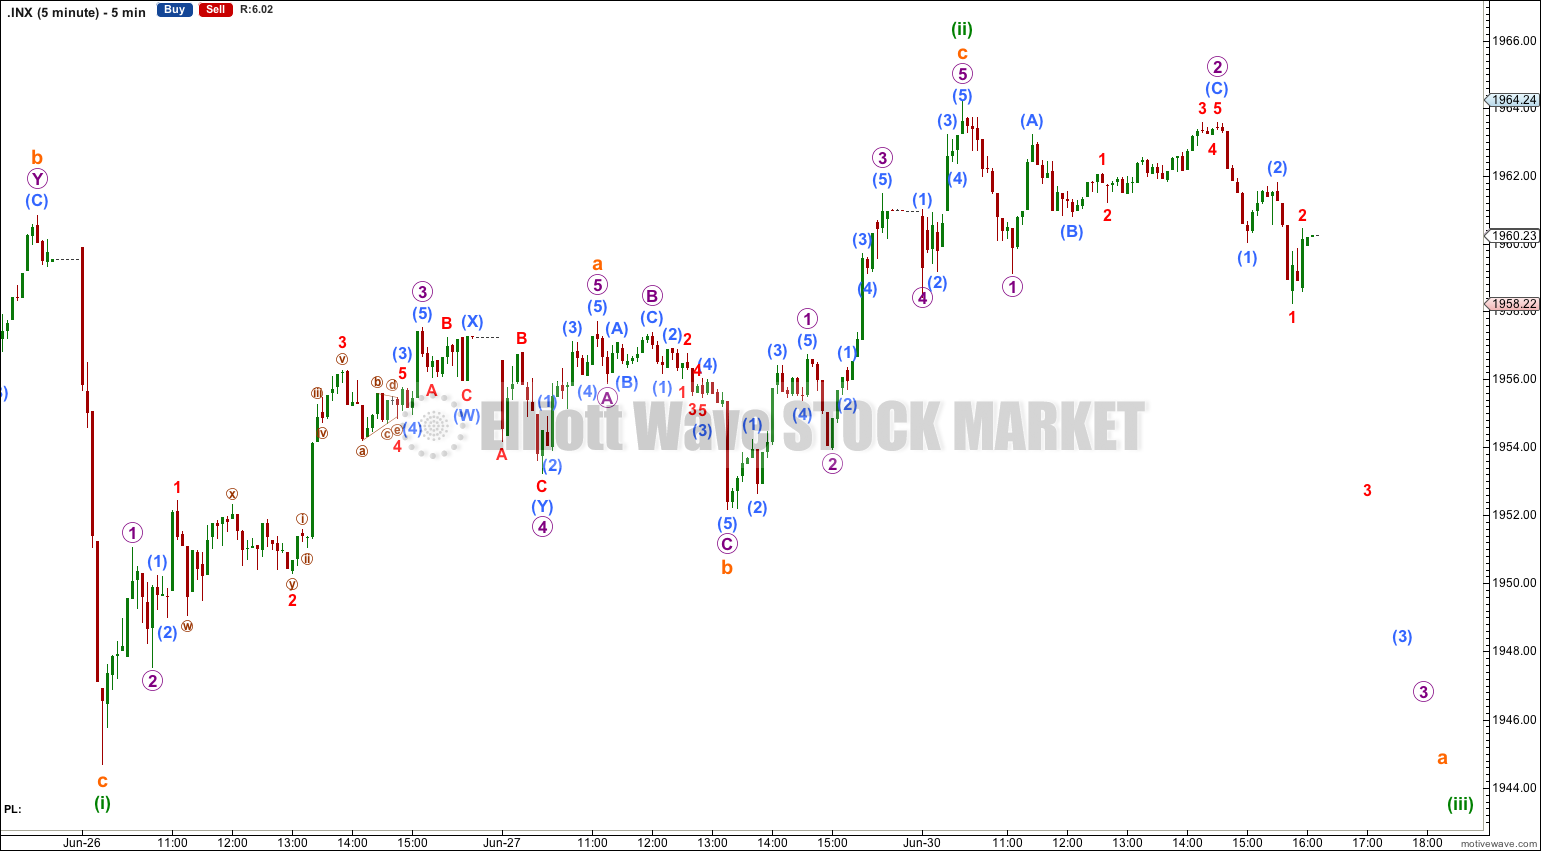
If an impulse is unfolding for the first five down then minuette wave (ii) may be an expanded flat correction. However, on the one minute chart the downwards wave labeled here subminuette wave b does not fit as well as a three and looks more like a five. The problem I had with subminuettte wave c looking like a five and not a three is now resolved with upwards movement during Monday’s session. Subminuette wave c subdivides nicely as a five wave impulse, although overall it has a better look as a three. There is no adequate Fibonacci ratio between subminuette waves a and c.
At 1,930 minuette wave (iii) would reach 1.618 the length of minuette wave (i). Minuette wave (iii) should show a clear strong increase in downwards momentum.
The channel about minuette waves (i) and (ii) is a base channel. Minuette wave (iii) should have the power to break through support at the lower edge of this channel, and along the way down upwards corrections should find resistance at the upper edge of this channel.
Minuette wave (ii) may not move beyond the start of minuette wave (i) above 1,968.17.
Bullish Alternate Wave Count.
This is the wave count I would use if price moves to a new high above 1,968.17 then above 1,973.72 this week.
There are two possible structures for minor wave 5. The main wave count sees it as an ending contracting diagonal. This alternate looks at the other possibility, that it may be an impulse. If it is an impulse then it must be incomplete.
Within minor wave 5 at 2,010 minuette wave (iii) would reach 1.618 the length of minuette wave (i).
Thereafter, minuette wave (iv) should move sideways and lower for about six weeks (to be in proportion to minuette wave (ii) which lasted 34 sessions) and may not move down into minuette wave (i) price territory below 1,858.71.
The subdivisions on this wave count do not have as good a fit as the main wave count. Minuette wave (ii) is a rather long lasting double combination, but the second structure in the double moves reasonably below the end of the first giving the combination an atypical slope against the main trend.
Within the middle of the third wave, subminuette wave iii, micro wave 2 is a rare running flat. This reduces the probability of this wave count.
Also, this wave count does not fit as nicely with momentum: so far minute wave iii has passed its middle and did not show a clear increase in momentum beyond that seen for minute wave i as it should have within an impulse. This further reduces the probability of this wave count.
At 2,218 minor wave 5 would reach equality in length with minor wave 3.
I do not have confidence in this wave count. I publish it only to consider all possibilities, and in acknowledgement that it is possible that the main wave count may be invalidated this week.
Bearish Alternate Wave Count.
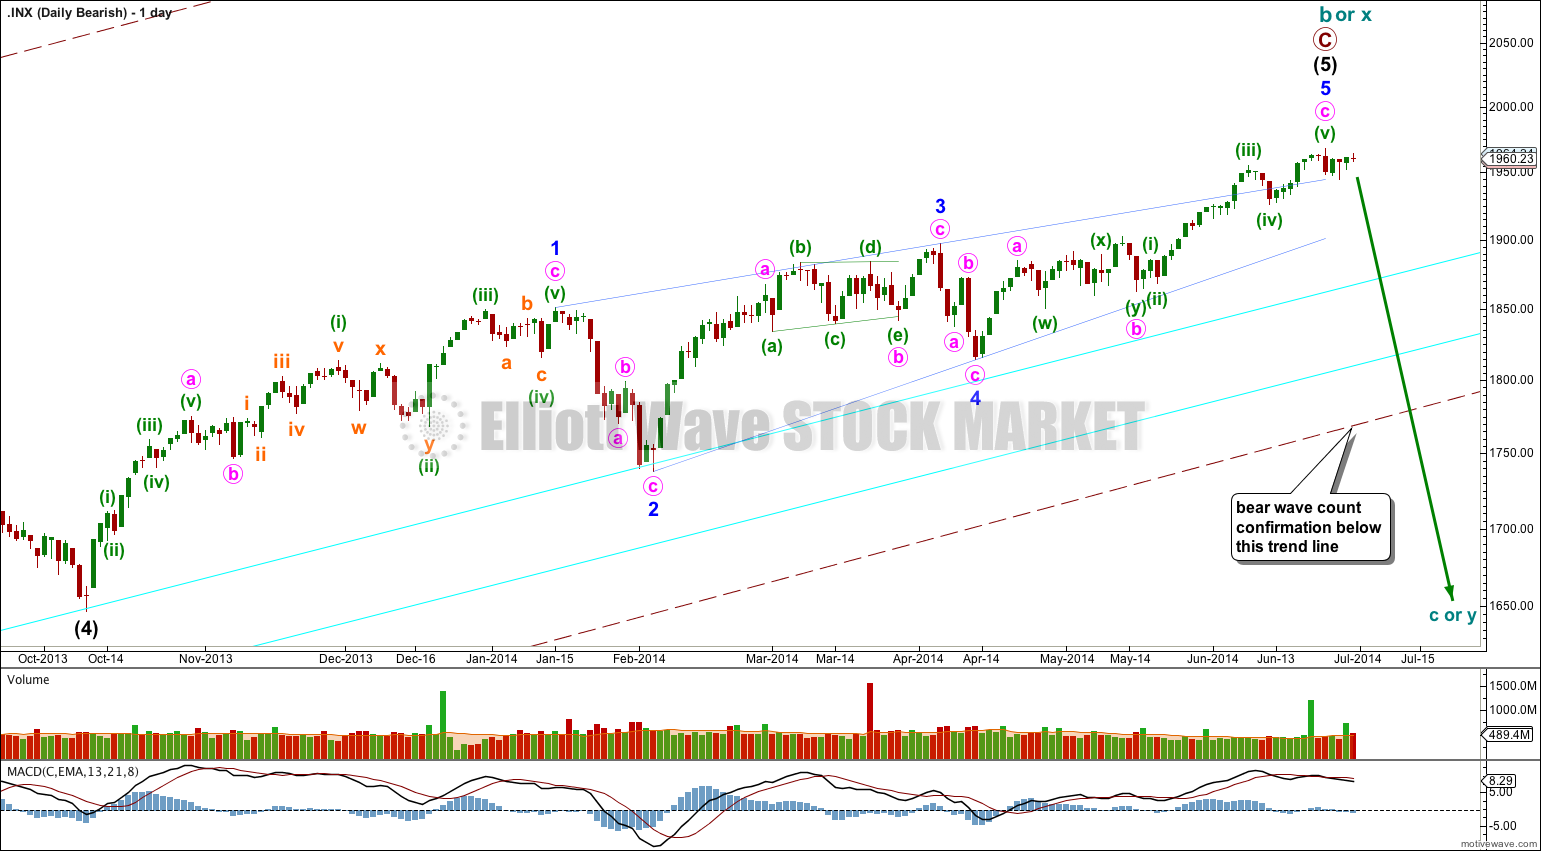
This bearish alternate wave count expects that the correction is not over. The flat correction which ended at 666.79 was only cycle wave a (or w) of a larger super cycle second wave correction.
Cycle wave b (or x) is now longer than the maximum common length of 138% for a B wave of a flat correction, at 150%.
A clear breach of the large maroon – – – channel on the monthly and weekly charts is required for confirmation of this wave count. If that happens then this would be my main wave count and would be strongly favoured. Only once this wave count is confirmed will I calculate downwards targets for cycle wave c (or y) for you; it would be premature to do that prior to confirmation.
Within cycle wave c no second wave correction may move beyond the start of its first wave. Once a trend change is confirmed then this bearish wave count will have an invalidation point at 1,968.17.
This analysis is published about 06:55 p.m. EST.
Nice wave Lara !
What part of NZ is that?
That’s Langs Beach, a short drive north of where I live. I surf there often, but it rarely gets as good as that picture.
Its got golden sand and pohutukawa trees fringing the beach. It is very beautiful!