
Yesterday’s Elliott wave count expected downwards movement towards a short term target. Price has moved lower producing a red candlestick, and the channel on the hourly chart may be providing some resistance to upwards movement.
Summary: A new low below 1,925.78 would be first confirmation of a trend change. I am expecting overall downwards movement for about five weeks or a bit longer from this point. In the short term the target for a third wave down is at 1,927, which may be met in another three or four days time.
Click on charts to enlarge.
The aqua blue trend lines are critical. Draw the first trend line from the low of 1,158.66 on 25th November, 2011 to the next swing low at 1,266.74 on 4th June, 2012. Create a parallel copy and place it on the low at 1,560.33 on 24th June, 2013. While price remains above the lower of these two aqua blue trend lines we must assume the trend remains upwards. This is the main reason for the bullish wave count being my main wave count.
Bullish Wave Count.
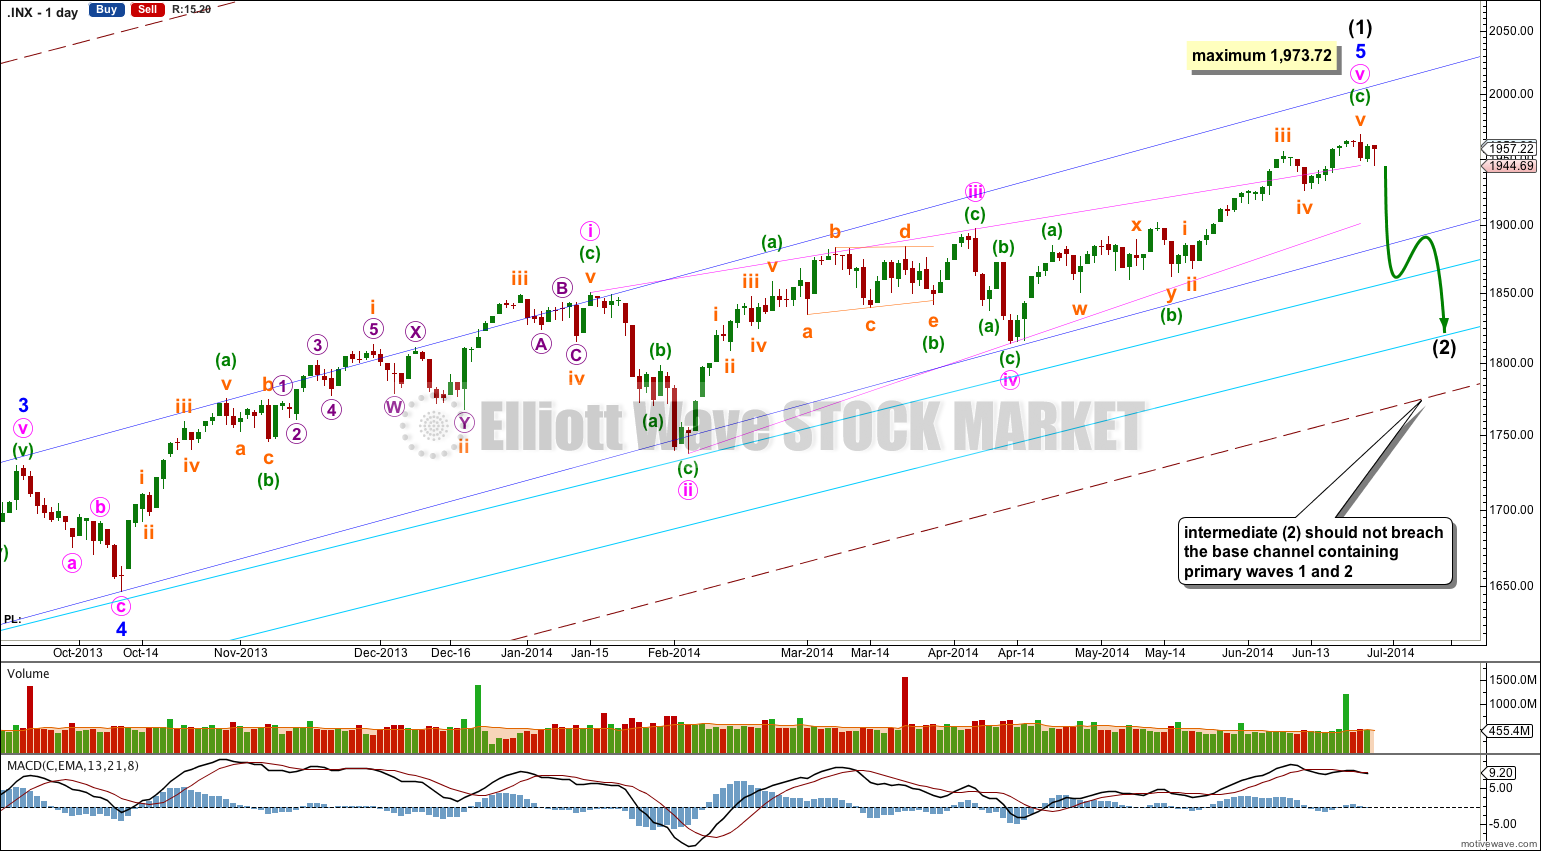
This bullish wave count expects a cycle degree correction was over at 666.79 for a fourth wave, and a new cycle degree bull market began there for a fifth wave. Within cycle wave V primary waves 1 and 2 are complete. Within primary wave 3 intermediate wave (1) may be over here.
Minor wave 5 is a complete ending contracting diagonal. Within an ending diagonal all the subwaves must be single zigzags, and the fourth wave should overlap first wave price territory.
Contracting diagonals commonly end with an overshoot of the 1-3 trend line. Apparently (according to Frost and Prechter, EWP page 38) the overshoot always occurs with a volume spike (I have not noticed this to be so). The S&P 500 reliably has a volume spike on the 20th of each third month, and Friday continued this pattern. Is this the final piece of the puzzle for this structure? It may end here.
But while we have no confirmation of a high in place we must accept the possibility of more upwards movement.
The diagonal is contracting because minute wave iii is shorter than minute wave i. Minute wave v may not be longer than equality with minute wave iii at 1,973.72 because a third wave may never be the shortest wave. So if we see more upwards movement and new highs I do not expect to see movement above 1,973.72 in the mid term.
There is divergence with price trending higher and MACD trending lower on the weekly chart, and a little on the daily chart for most recent movement. This classic technical divergence supports this wave count and indicates that at least a reasonably sized correction should arrive soon. By reasonably sized I mean in fitting with this bullish wave count: Intermediate wave (2) should last at least two weeks, and more likely about five weeks. It should not breach the lower aqua blue trend line nor the lower edge of the maroon – – – channel. The wave count remains bullish at primary degree.
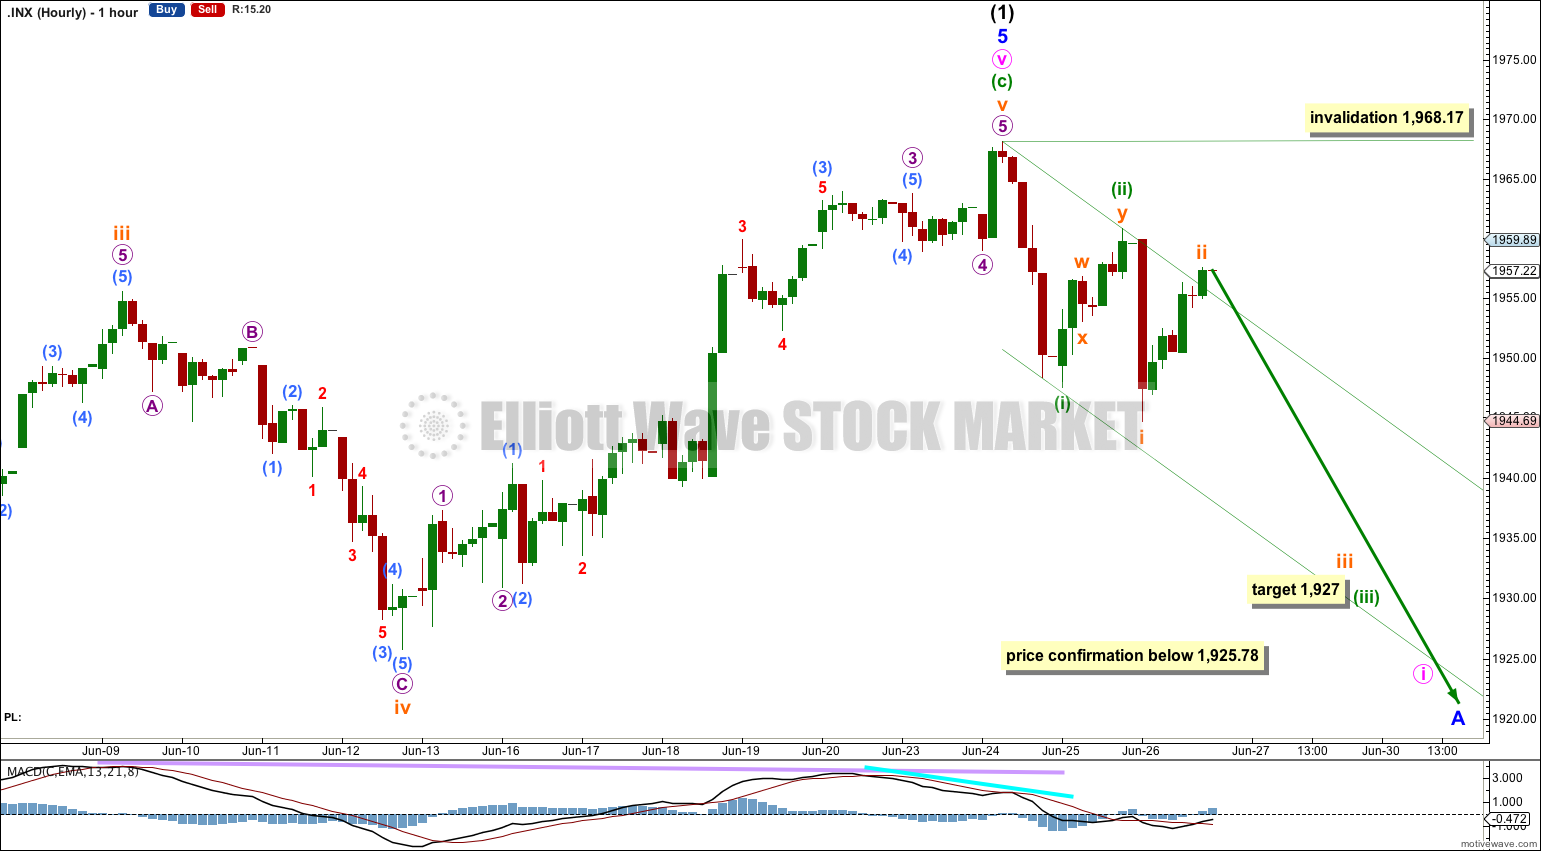
I have moved the degree of labeling within downwards movement up one degree today because the upwards movement labeled subminuette wave ii is larger than a micro degree wave.
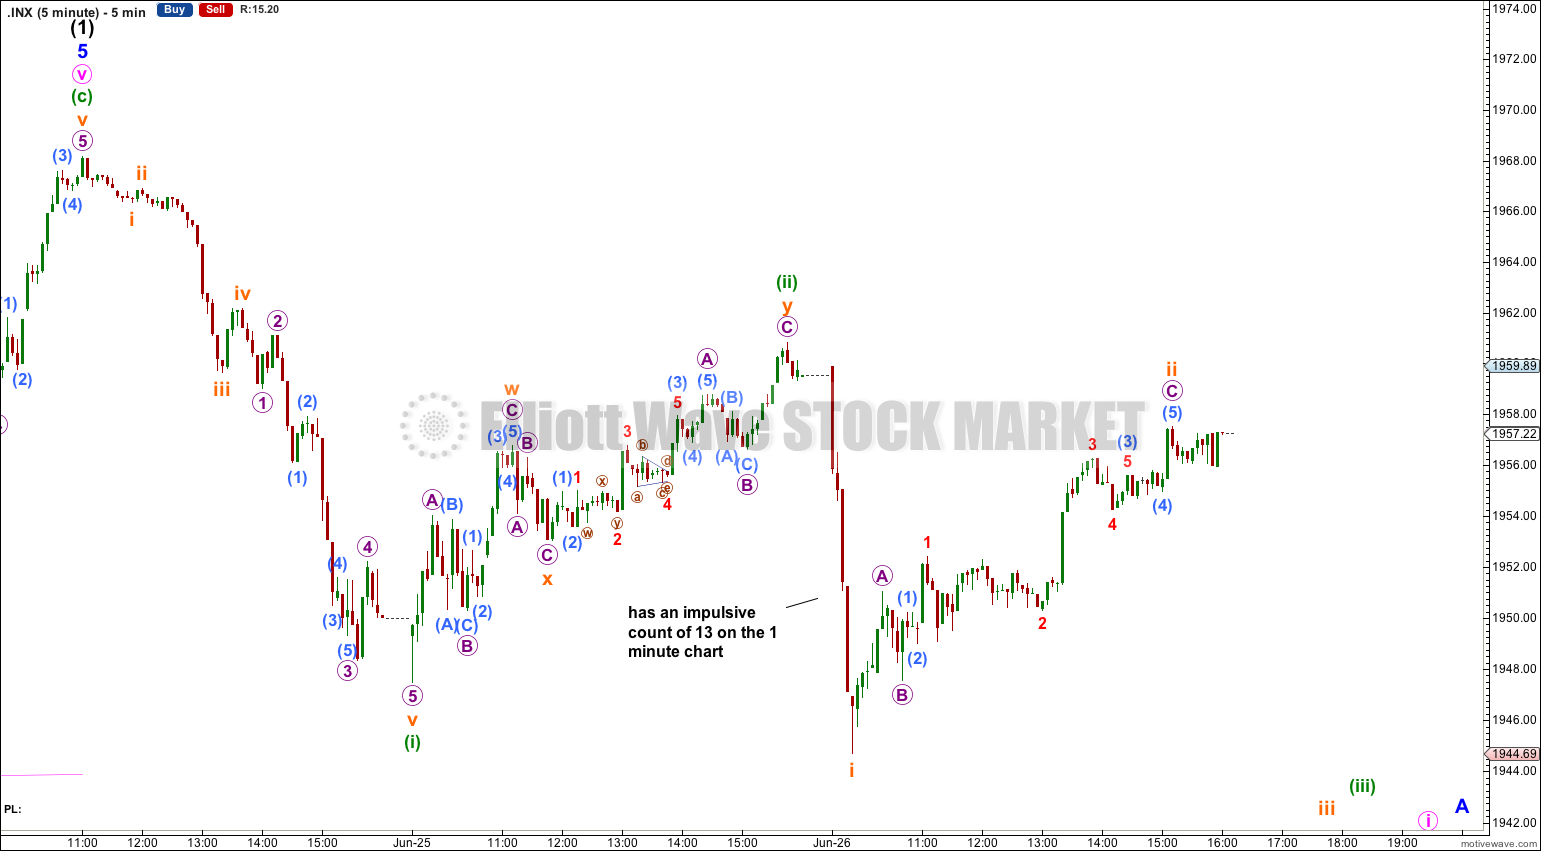
So far we do not have a clear five down to the downside and there is only a three wave movement.
In order to have confidence in this wave count at this stage I want to see a clear five down develop on the hourly chart. I also want to see price move below 1,925.78. While price remains above this point it is possible that subminuette wave v within intermediate wave (1) is not over and we may yet see new highs, although this possibility does seem rather unlikely.
This wave count expects to see downwards momentum increase strongly tomorrow and over the next few days as the middle of a third wave down unfolds. At 1,927 minuette wave (iii) would reach 1.618 the length of minuette wave (i). Corrections along the way should find resistance at the upper edge of the base channel, and so subminuette wave ii should be over there.
It is also possible that minuette wave (ii) is incomplete and unfolding as an expanded flat correction. If tomorrow begins with upwards movement the invalidation point is at 1,968.17 because minuette wave (ii) may not move beyond the start of minuette wave (i).
Bearish Alternate Wave Count.
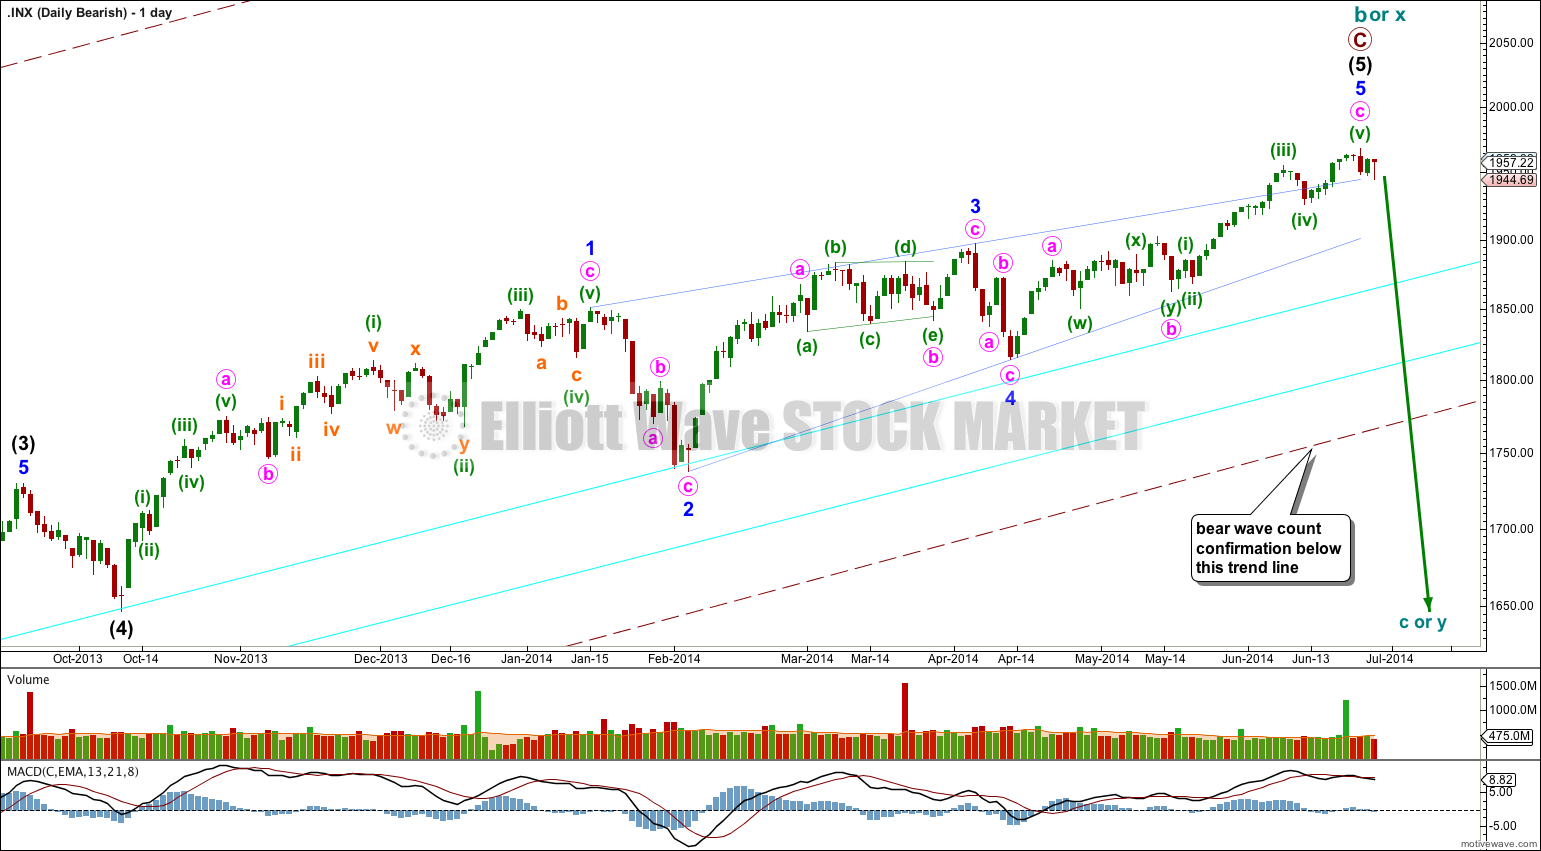
This bearish alternate wave count expects that the correction is not over. The flat correction which ended at 666.79 was only cycle wave a (or w) of a larger super cycle second wave correction.
Cycle wave b (or x) is now longer than the maximum common length of 138% for a B wave of a flat correction, at 150%.
A clear breach of the large maroon – – – channel on the monthly and weekly charts is required for confirmation of this wave count. If that happens then this would be my main wave count and would be strongly favoured. Only once this wave count is confirmed will I calculate downwards targets for cycle wave c (or y) for you; it would be premature to do that prior to confirmation.
Within cycle wave c no second wave correction may move beyond the start of its first wave. Once a trend change is confirmed then this bearish wave count will have an invalidation point at 1,968.17.
This analysis is published about 06:20 p.m. EST.
Hi Lara-
Don’t take this the wrong way but almost every time you’ve posted a very bearish 1-2 count, the third wave down has never transpired. I rememeber you nailed it with gold back in nov/dec. There may be some traders trying to trade a third wave down as it can be very profitable. I’m only pointing it out to see if it makes sense to never assume a bearish 1-2 count in a bull market like this one until there’s more evidence of a trend change. A bullish 1-2 count on the other hand makes sense when it arises. I realize Analyzing the S&P 500 has been extremely difficult of late.
I tend to agree. This market is being artificially supported by the unprecedented printing of free money. That seems to have made normal Elliott wave prognostics useless. These waves are based on human behavior and market efficiencies, but these factors can and do change over time. We may be witnessing such a time in history.
I don’t think so though. I think the printing of money is part of social mood, not separated from it.
Yes, it has propped up stock markets as that seems to be where most of the money is going.
I don’t think we are going to see a fundamental change in human behaviour, I think this long drawn out bull market is totally an expression of our herd behaviour and our collective social mood.
I see your point, but one could argue that Elliott wave theory allows for revisionist retro-fitting of many different possibilities, so how predictive can it really be? For example, the S&P could certainly plunge into a short term intermediate level correction and fit with your wave count. However, it could also go sideways or even make a new high above 1973.72 next week and I’m sure it would still be possible to find a wave count that fits such movement.
Sammy, I have to say if you think EW has no predictive qualities and you’re not finding this service useful, exactly why are you a member?
Yes, you can fit a wave count into any movement you like. Yes, that will have no predictive value. Yes, corrections are notoriously difficult to get right, and I often don’t get it right until the end or just after when it is clearer.
EW analysis is only ever going to be as good as the person applying it. There is an enormous amount of rubbish online calling itself Elliott wave which does not follow the clear rules and guidelines. That does not mean EW is useless, it just means you have to be careful when you judge the value of an analyst.
I’m currently studying for my CMT and am reading a lot of technical analysis text books. So far I have found nothing which is as detailed and prescriptive as Elliott wave. For example, the guidelines on how to identify traditional technical analysis chart patterns like Head and Shoulders are not as clearly defined as EW rules for the same situation.
Your main problem seems to be with corrections. You will not find any other method which will identify how corrections evolve and when they are over any earlier or with any better probability than Elliott wave. You will find other TA methods which come close, and some ideas which should always be used (like trend lines and channels, support and resistance) but nothing will always beat EW. They all have their problems, because corrections are notoriously difficult for all methods.
Good explanation, thanks. I think the way to use your analysis is to wait for either your validation or invalidation points to assess future market direction. In between, almost anything can happen short term.
Indeed, anything can happen, and usually does! (Sod’s Law, a close relative of Murphy).
Times of trend changes are particularly difficult for any and all analysis methods.
If we were being more conservative we would not expect to see a correction confirmed until there is a new low below the last swing low at 1,814.36. At which time the correction would be pretty much over.
During trend changes and corrections I strongly advise all members to use their own preferred TA methods in conjunction with my EW analysis. Which everyone should be doing all the time anyway.
The idea is you pay me to do the EW analysis because its more difficult and time consuming. But don’t use just one method, use a range. If my EW analysis agrees with what you see you have a clearer picture. If it does not then its up to you to judge if you think I’m right or wrong.
And finally, I should be right more often than wrong otherwise members cancel. I have a strong motivation to get it right, apart from my own pride.
I agree. We have been here before.
That is why I have a price point to confirm a trend change, and why I keep stating that while price has not breached 1,925.78 we could see new highs.