
Yesterday I expected a little upwards movement to about 1,949.63 before more downwards movement, but this did not happen. Downwards movement just continued, but this does still fit the wave count.
Summary: A very clear breach of the channel on the hourly chart gives me confidence the trend is down. Tomorrow I expect shall begin with a little upwards movement, and then more downwards movement to a short term target at 1,920.
Click on charts to enlarge.
The aqua blue trend lines are critical. Draw the first trend line from the low of 1,158.66 on 25th November, 2011 to the next swing low at 1,266.74 on 4th June, 2012. Create a parallel copy and place it on the low at 1,560.33 on 24th June, 2013. While price remains above the lower of these two aqua blue trend lines we must assume the trend remains upwards. This is the main reason for the bullish wave count being my main wave count.
Bullish Wave Count.
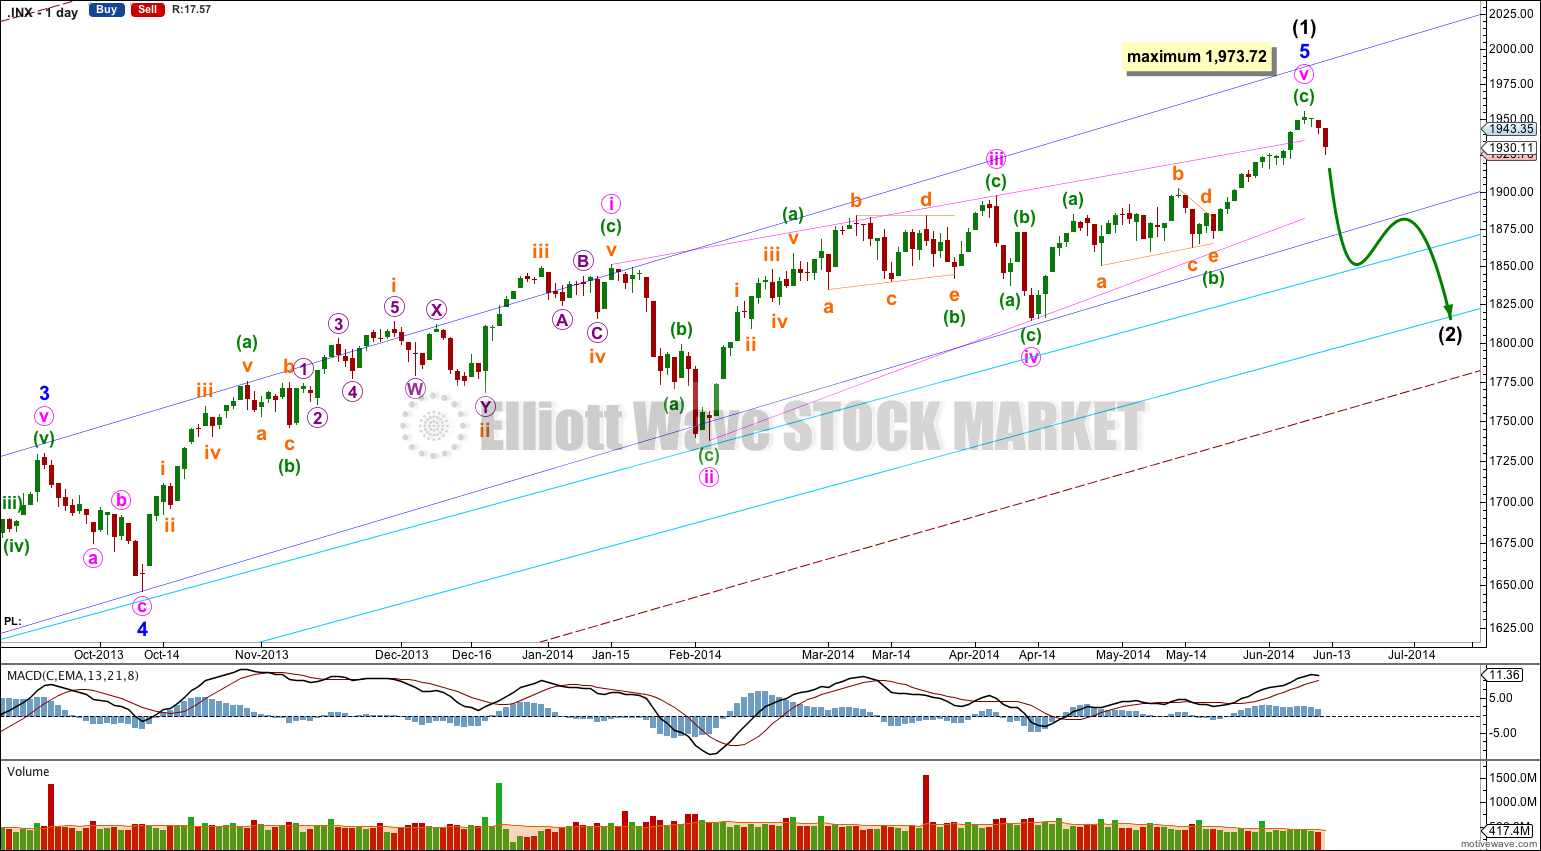
This bullish wave count expects a cycle degree correction was over at 666.79 for a fourth wave, and a new cycle degree bull market began there for a fifth wave. Within cycle wave V primary waves 1 and 2 are complete. Within primary wave 3 intermediate wave (1) may be just now complete.
Minor wave 5 is a complete ending contracting diagonal. Within an ending diagonal all the subwaves must be single zigzags, and the fourth wave should overlap first wave price territory.
The final fifth wave of this diagonal may have ended with an overshoot the upper i-iii trend line of the contracting diagonal. This is the most common place for fifth waves of ending contracting diagonals to end. This gives the wave count a very typical look, if it is over here.
The diagonal is contracting because minute wave iii is shorter than minute wave i. Minute wave v may not be longer than equality with minute wave iii at 1,973.72 because a third wave may never be the shortest wave. At this stage it is not confirmed that the final fifth wave of the diagonal is over.
There is still divergence with price trending higher and MACD trending lower. This classic technical divergence supports this wave count and indicates that at least a reasonably sized correction should arrive soon. By reasonably sized I mean in fitting with this bullish wave count: Intermediate wave (2) should last at least two or four weeks, probably longer, and should not breach the lower aqua blue trend line nor the lower edge of the maroon – – – channel. The wave count remains bullish at primary degree.
At this stage there is absolutely no confirmation of a trend change. To have any confidence in this analysis I first want to see three things:
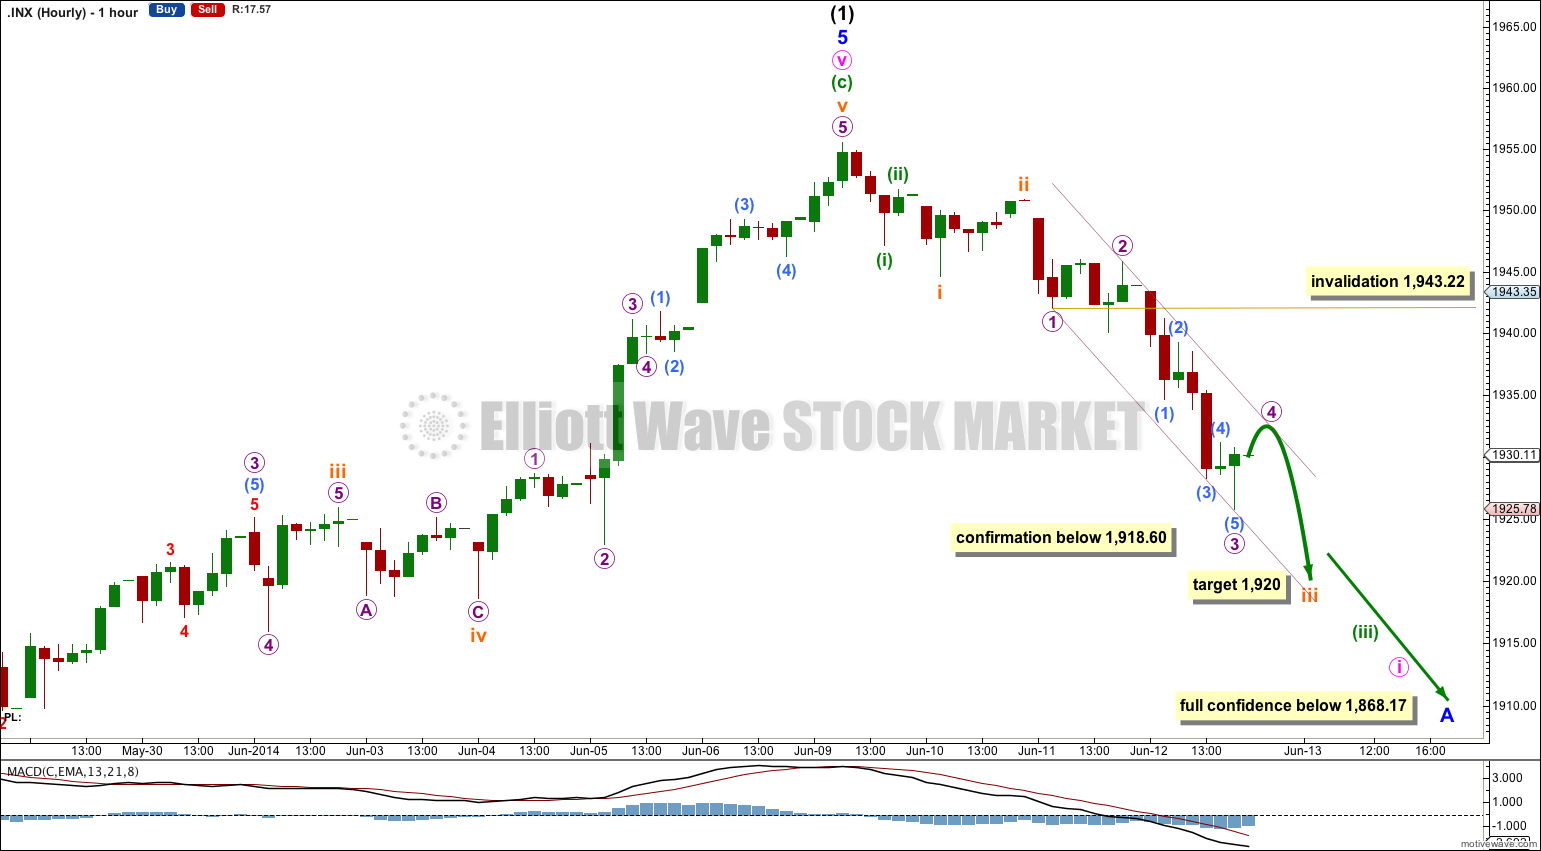
1. The clear breach on the hourly chart with downwards movement of the channel which was drawn about the prior upwards wave has given me some confidence in a trend change. This first requirement has now been well met.
2. Price movement below 1,918.60. At that stage downwards movement could not be a second wave correction within subminuette wave v, and so subminuette wave v would have to be over.
3. Price movement below 1,868.17. At that stage downwards movement could not be a second wave correction within minuette wave (c) and so minuette wave (c) would have to be over.
A clear five down on the daily chart would also provide full confidence in this wave count. This may come before or after 1,868.17 is breached, and at this stage it is impossible to tell how deep the first five down may be.
Once price breaches 1,868.17 I would have full and final confidence that the S&P is in an intermediate degree correction.
An increase in downwards momentum suggests the middle of a third wave is unfolding. Yesterday I had a leading diagonal complete and was expecting a deep second wave correction to follow that. There was no deep second wave correction, and so it is very unlikely there was a leading diagonal. Momentum suggests a more common situation of an impulse unfolding.
At 1,920 subminuette wave iii would reach 4.236 the length of subminuette wave i.
In the very short term I would expect tomorrow to open with a little upwards movement to complete micro wave 4. It should find resistance at the upper edge of the channel. Thereafter, the downwards trend should continue.
Micro wave 4 may not move into micro wave 1 price territory above 1,943.22. It may not move much higher at all and may move mostly sideways.

Bearish Alternate Wave Count.
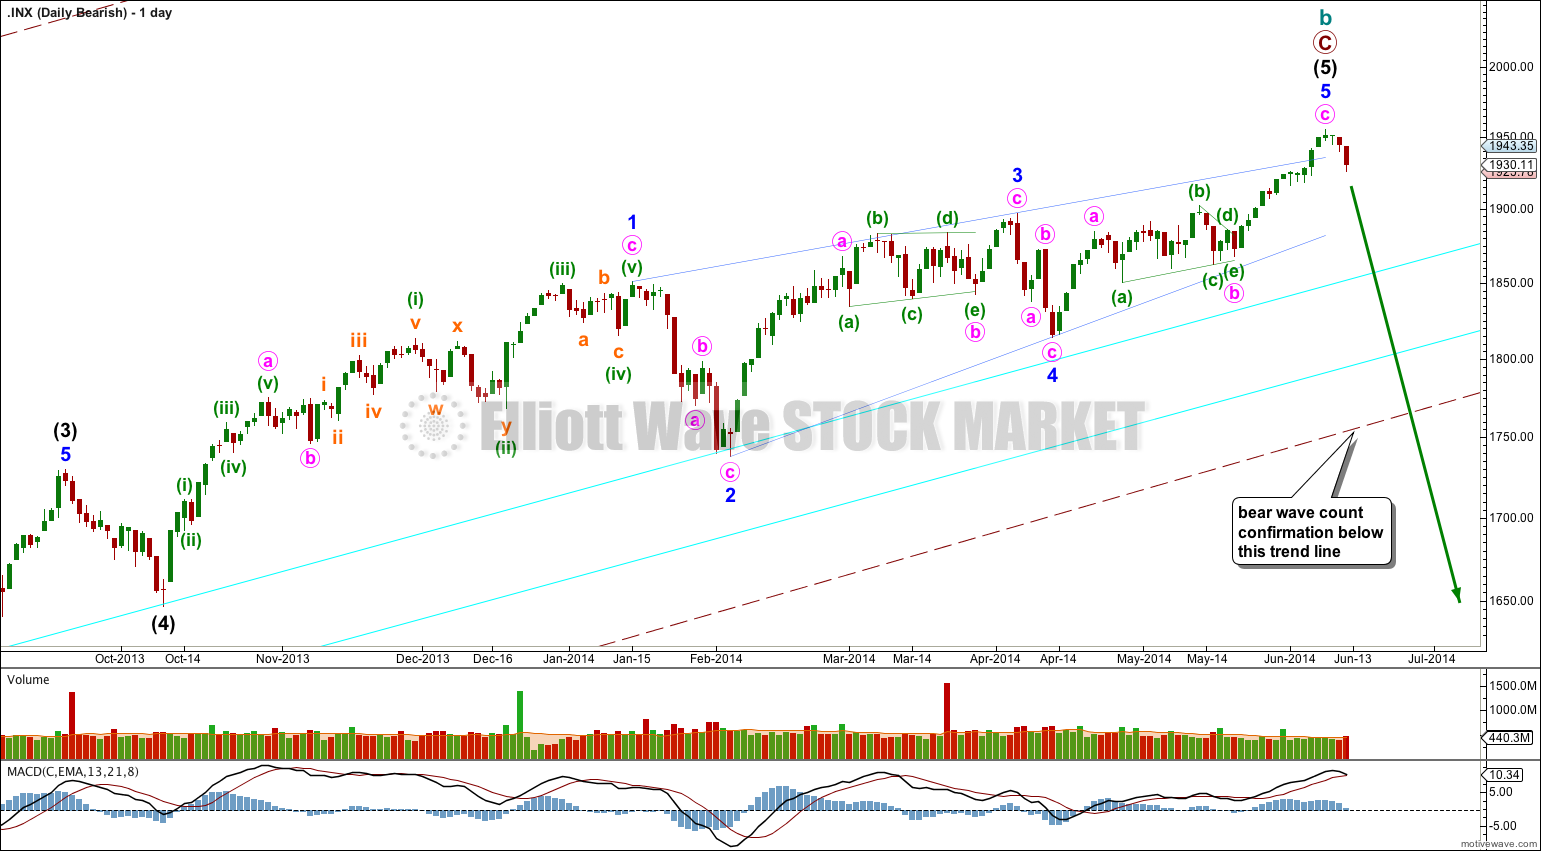
This bearish alternate wave count expects that the correction is not over. The flat correction which ended at 666.79 was only cycle wave a of a larger super cycle second wave correction.
Cycle wave b is now longer than the maximum common length of 138% for a B wave of a flat correction, it is 149%.
Cycle wave b may again be a complete zigzag structure.
A clear breach of the large maroon – – – channel on the monthly and weekly charts is required for confirmation of this wave count. If that happens then this would be my main wave count and would be strongly favoured. Only once this wave count is confirmed will I calculate downwards targets for cycle wave c for you; it would be premature to do that prior to confirmation.
This analysis is published about 07:40 p.m. EST.