
A new high was expected. The structure is incomplete and a target can now be calculated at two wave degrees.
Summary: Upwards movement is incomplete. The target is at 1,939 to 1,940. Upwards movement is most likely to end when the upper i-iii pink trend line is overshot.
This analysis is published about 07:00 p.m. EST. Click on charts to enlarge.
The aqua blue trend lines are critical. Draw the first trend line from the low of 1,158.66 on 25th November, 2011 to the next swing low at 1,266.74 on 4th June, 2012. Create a parallel copy and place it on the low at 1,560.33 on 24th June, 2013. While price remains above the lower of these two aqua blue trend lines we must assume the trend remains upwards. This is the main reason for the bullish wave count being my main wave count.
Bullish Wave Count.
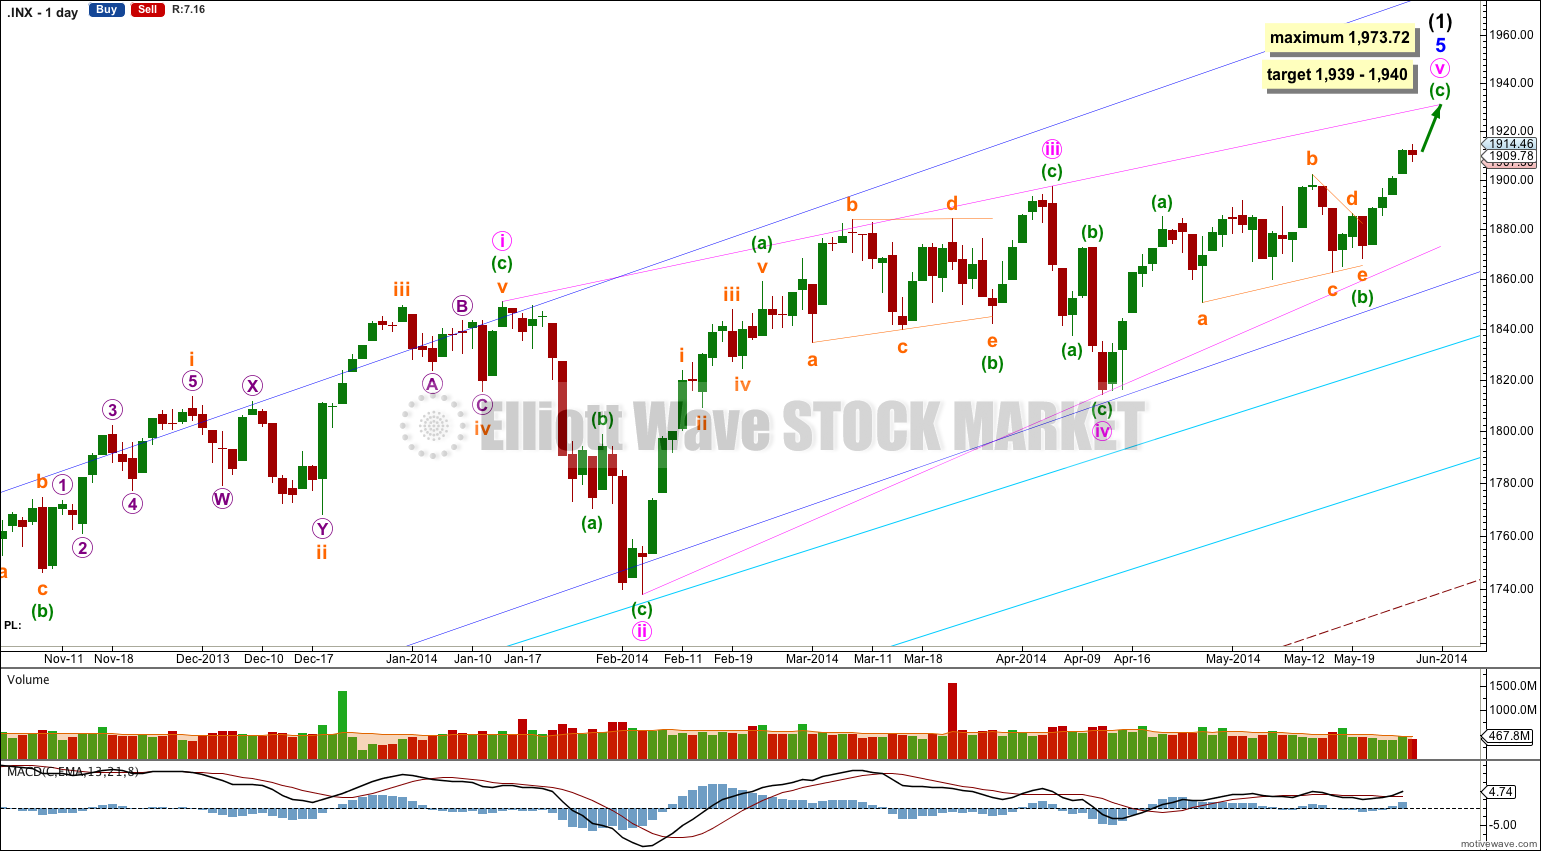
This bullish wave count expects a cycle degree correction was over at 666.79 for a fourth wave, and a new cycle degree bull market began there for a fifth wave. Within cycle wave V primary waves 1 and 2 are complete. Within primary wave 3 intermediate wave (1) is almost complete.
Minor wave 5 is an almost complete ending contracting diagonal. Within an ending diagonal all the subwaves must be single zigzags, and the fourth wave should overlap first wave price territory.
Within the final fifth wave of this diagonal minuette wave (b) is a running contracting triangle. Minuette wave (c) is an incomplete impulse.
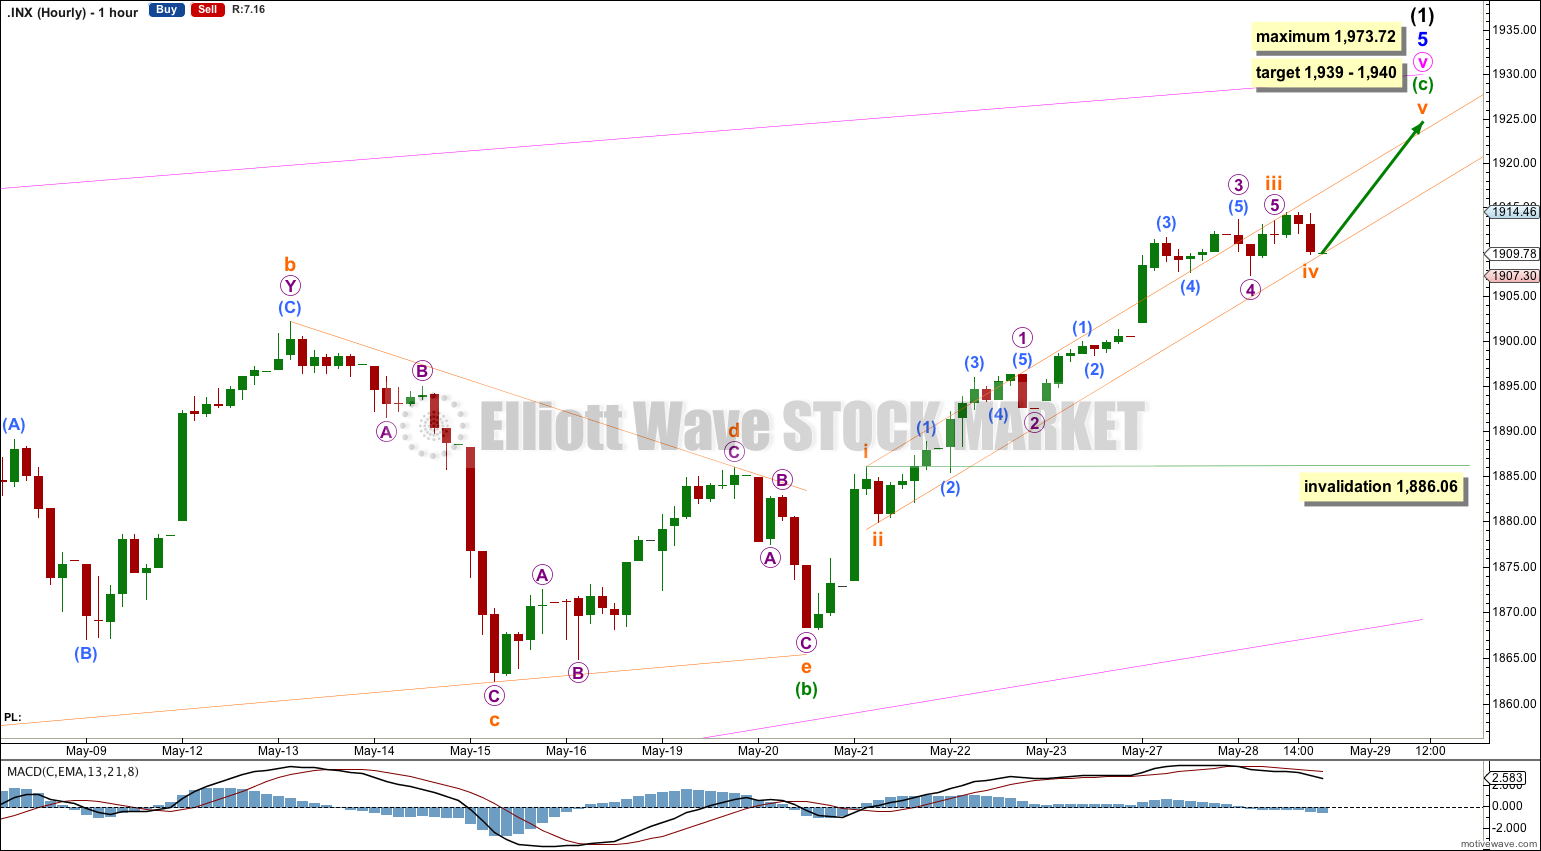
I would expect the final fifth wave of this diagonal to end at the upper i-iii trend line, or maybe to overshoot this trend line.
The diagonal is contracting because minute wave iii is shorter than minute wave i. Minute wave v may not be longer than equality with minute wave iii at 1,973.72 because a third wave may never be the shortest wave.
At 1,939 minuette wave (c) would reach equality with minuette wave (a).
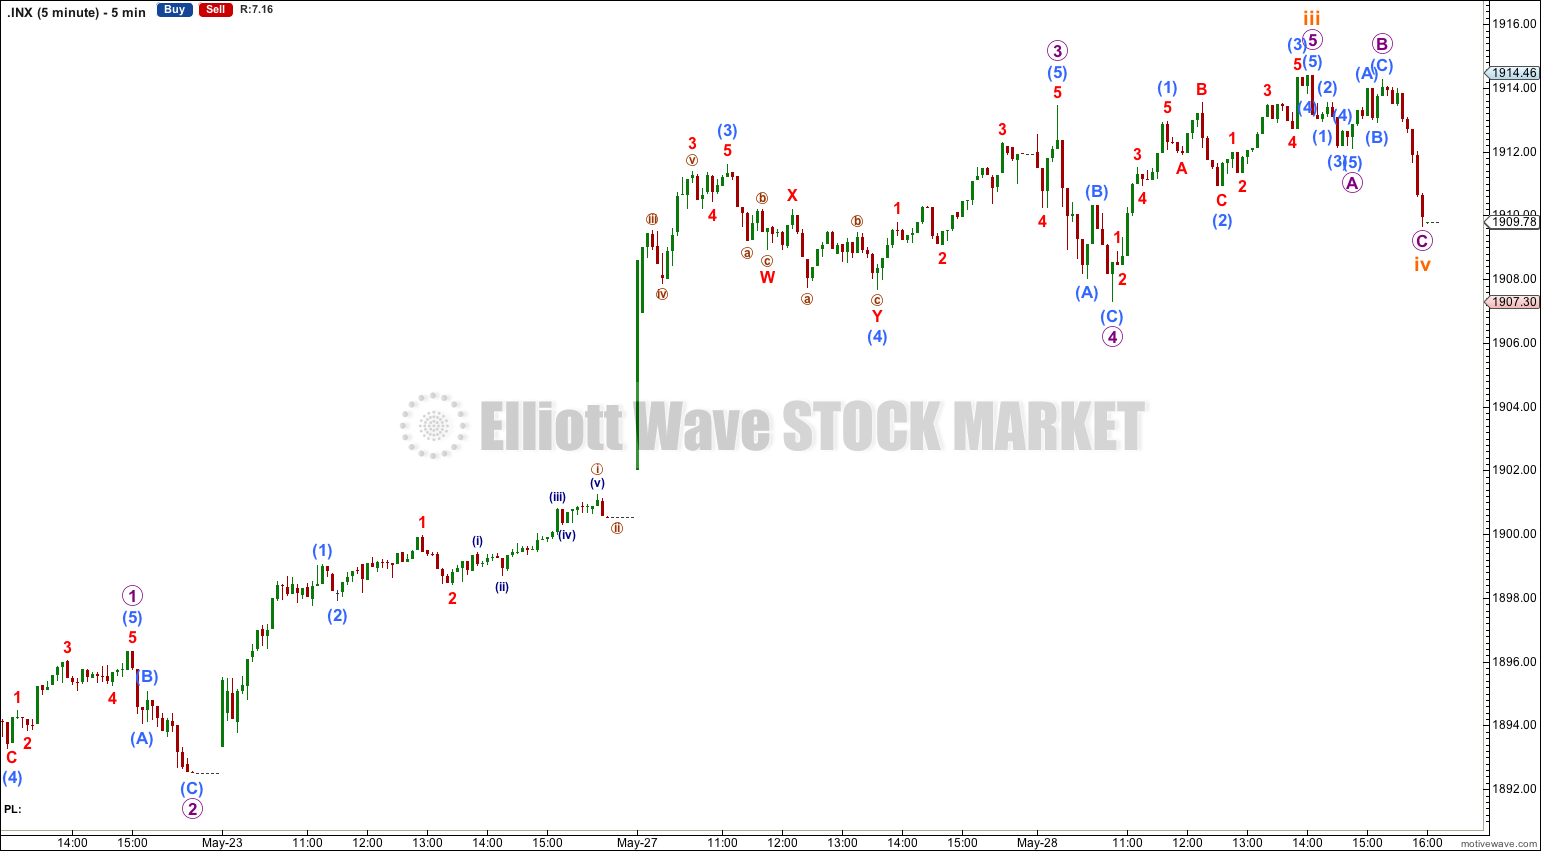
A slight decrease in momentum for Wednesday’s session indicates that subminuette wave iii within minute wave (c) may be complete.
I have moved the labeling of the end of subminuette wave iii to the high for Wednesday’s session. It still has no Fibonacci ratio to subminuette wave i.
Ratios within subminuette wave iii are slightly improved though. There is no Fibonacci ratio between micro waves 3 and 1, and micro wave 5 is just 0.05 short of 0.382 the length of micro wave 1.
Draw a channel about minuette wave (c) using Elliott’s first technique: draw the first trend line from the highs labeled subminuette waves i to iii, then place a parallel copy upon the low labeled subminuette wave ii. So far subminuette wave iv is contained within this channel and it should continue to be so. If it overshoots the channel when the market opens tomorrow then redraw the channel using Elliott’s second technique: the first trend line from ii to iv, then a copy upon iii. I would expect subminuette wave v to remain contained within an Elliott channel.
At 1,940 subminuette wave v would reach equality in length with subminuette wave iii. If subminuette wave iv moves lower this target must move correspondingly lower.
At 1,939 minuette wave (c) would reach equality in length with minuette wave (a).
There is not enough upwards movement at the end of Wednesday’s session to confirm that subminuette wave iv is over. It may move lower tomorrow, but it should not produce another red candlestick.
If we see another red candlestick tomorrow then I would consider the possibility that only subminuette wave i is complete and that downwards movement could be subminuette wave ii.
At this stage I would not expect that the entire structure is complete because the upper pink i-iii trend line of the contracting diagonal has not yet been reached.
Subminuette wave iv may not move into subminuette wave i price territory. This wave count is invalidated with movement below 1,886.06.
Bearish Alternate Wave Count.
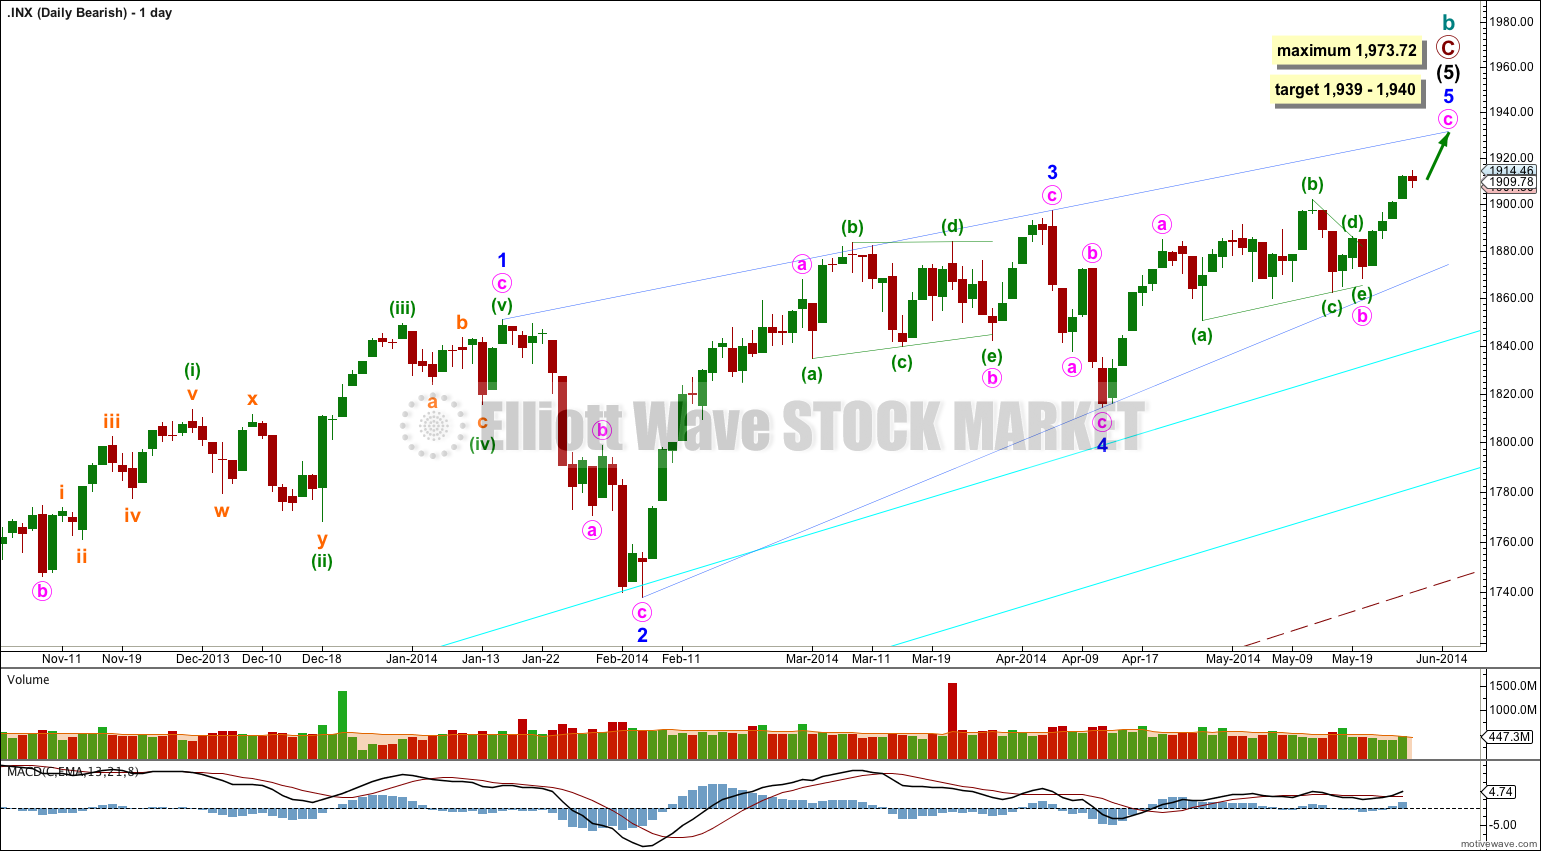
This bearish alternate wave count expects that the correction is not over. The flat correction which ended at 666.79 was only cycle wave a of a larger super cycle second wave correction.
Cycle wave b is now longer than the maximum common length of 138% for a B wave of a flat correction.
Cycle wave b is an almost complete zigzag structure.
A clear breach of the large maroon – – – channel on the monthly and weekly charts is required for confirmation of this wave count. If that happens then this would be my main wave count and would be strongly favoured. Only once this wave count is confirmed will I calculate downwards targets for cycle wave c for you; it would be premature to do that prior to confirmation.
This is a test post.