
Upwards movement was expected. The second target is widened to a zone and now has a higher probability than the first target.
Summary: The first target is 1,911. The second target is 1,931 to 1,938. At this stage I expect the second target has a higher probability.
This analysis is published about 09:32 p.m. EST. Click on charts to enlarge.
Bullish Wave Count.
The aqua blue trend lines are critical. Draw the first trend line from the low of 1,158.66 on 25th November, 2011 to the next swing low at 1,266.74 on 4th June, 2012. Create a parallel copy and place it on the low at 1,560.33 on 24th June, 2013. While price remains above the lower of these two aqua blue trend lines we must assume the trend remains upwards. This is the main reason for the bullish wave count being my main wave count.
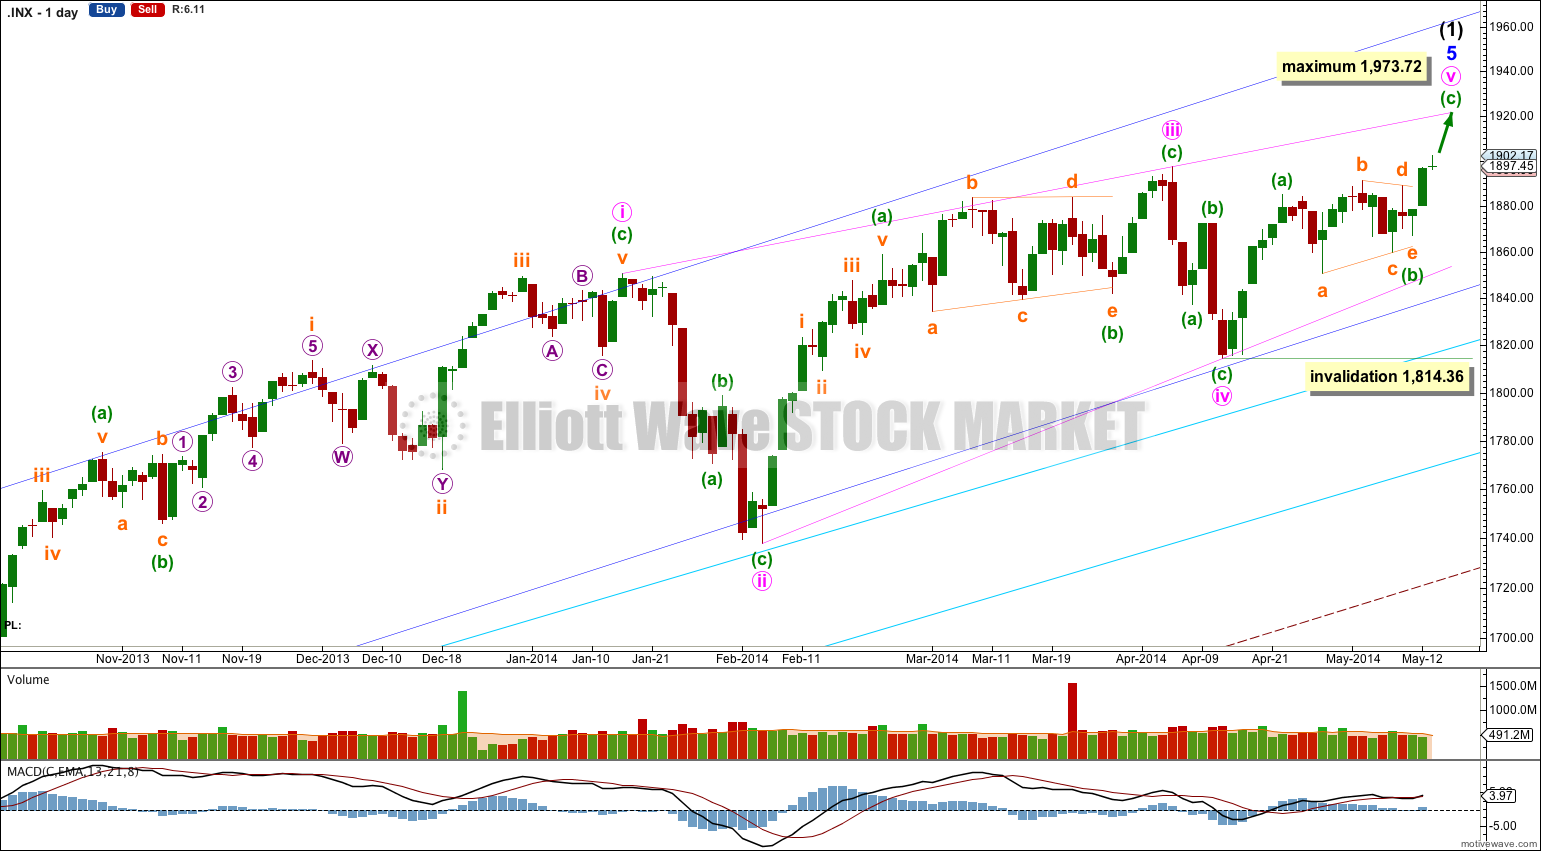
This bullish wave count expects a new bull market began at 666.79 for a cycle wave V. Within cycle wave V primary waves 1 and 2 are complete. Within primary wave 3 intermediate wave (1) is incomplete.
Within intermediate wave (1) the final fifth wave of minor wave 5 is an almost complete ending contracting diagonal. Although minute waves ii and iv within the diagonal are shallower than normal, all the subdivisions fit perfectly. The diagonal is contracting and the final fifth wave may not be longer than equality with the third at 1,973.72.
Within an ending diagonal all the subwaves may only subdivide as single zigzags. The fourth wave should overlap back into first wave price territory. Minute wave v should end when price comes to touch the upper 1-3 trend line of the diagonal. Alternately, it may overshoot this trend line, but that has a lower probability.
Within the zigzag of minute wave v minuette wave (b) may not move beyond the start of minuette wave (a) at 1,814.36.
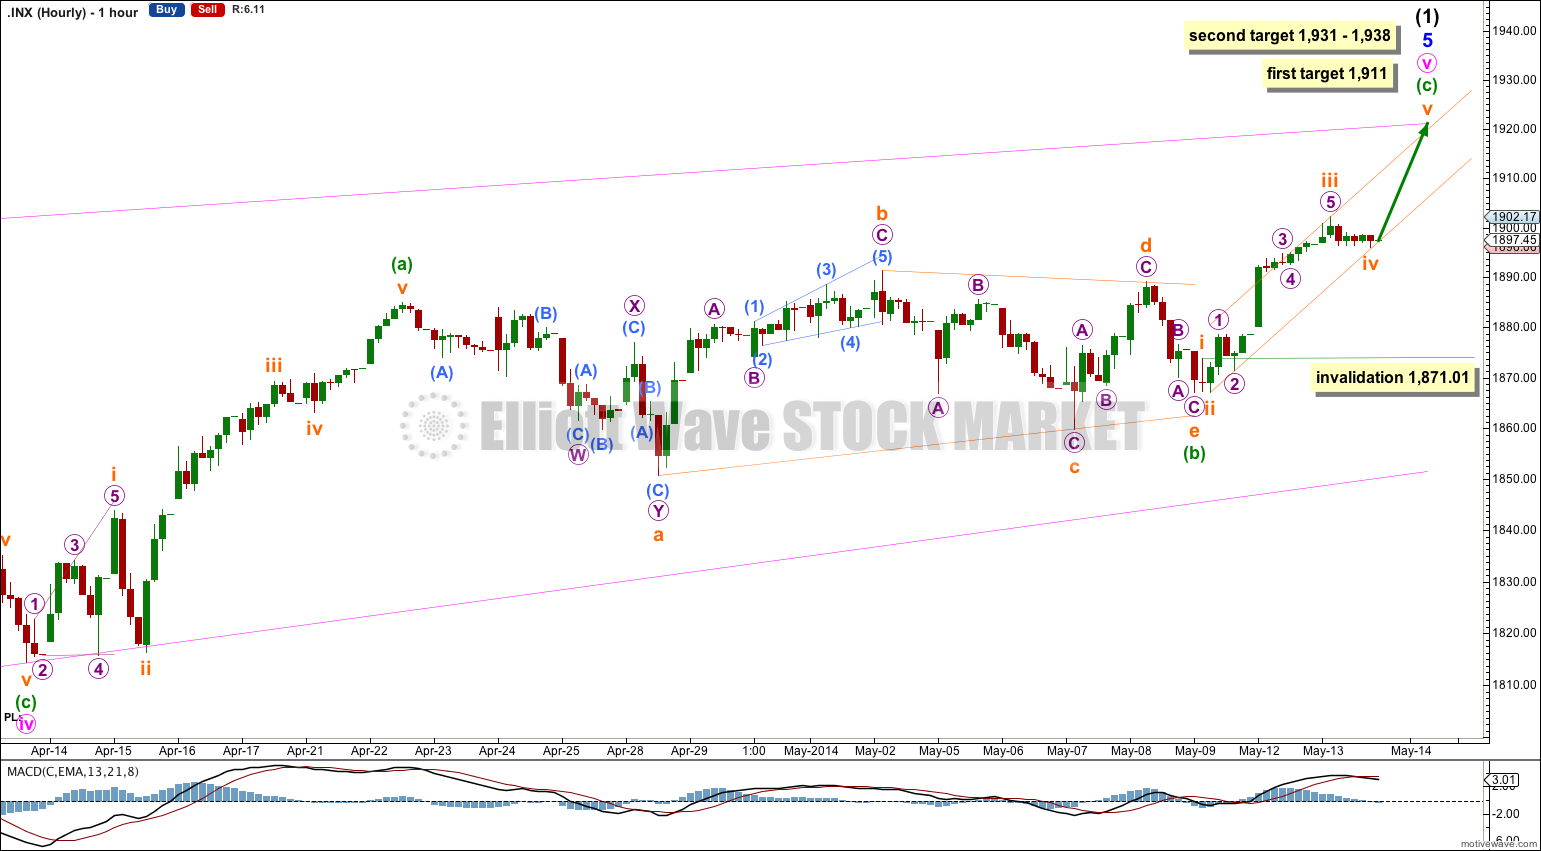
Within minuette wave (c) the structure is incomplete so I expect to see more upwards movement yet.
At 1,911 minuette wave (c) would reach 0.618 the length of minuette wave (a). Because at this stage that would probably not bring price up to touch the pink i-iii trend line of the diagonal I expect this target has a low probability.
At 1,938 minuette wave (c) would reach equality in length with minuette wave (a), and at 1,931 subminuette wave v would reach equality in length with subminuette wave i. This second target zone would bring price up to touch the i-iii trend line and so it has a higher probability. This would see subminuette wave v extended. Because it is calculated at a lower wave degree I favour the lower end of this target zone.
This second target may be reached in about three days.
I have drawn a small channel about this upwards movement. Draw the first trend line from the lows of subminuette waves ii to iv, then place a parallel channel on the high of subminuette wave iii. If subminuette wave iv continues lower redraw the channel. I would expect subminuette wave v to move higher within the channel.
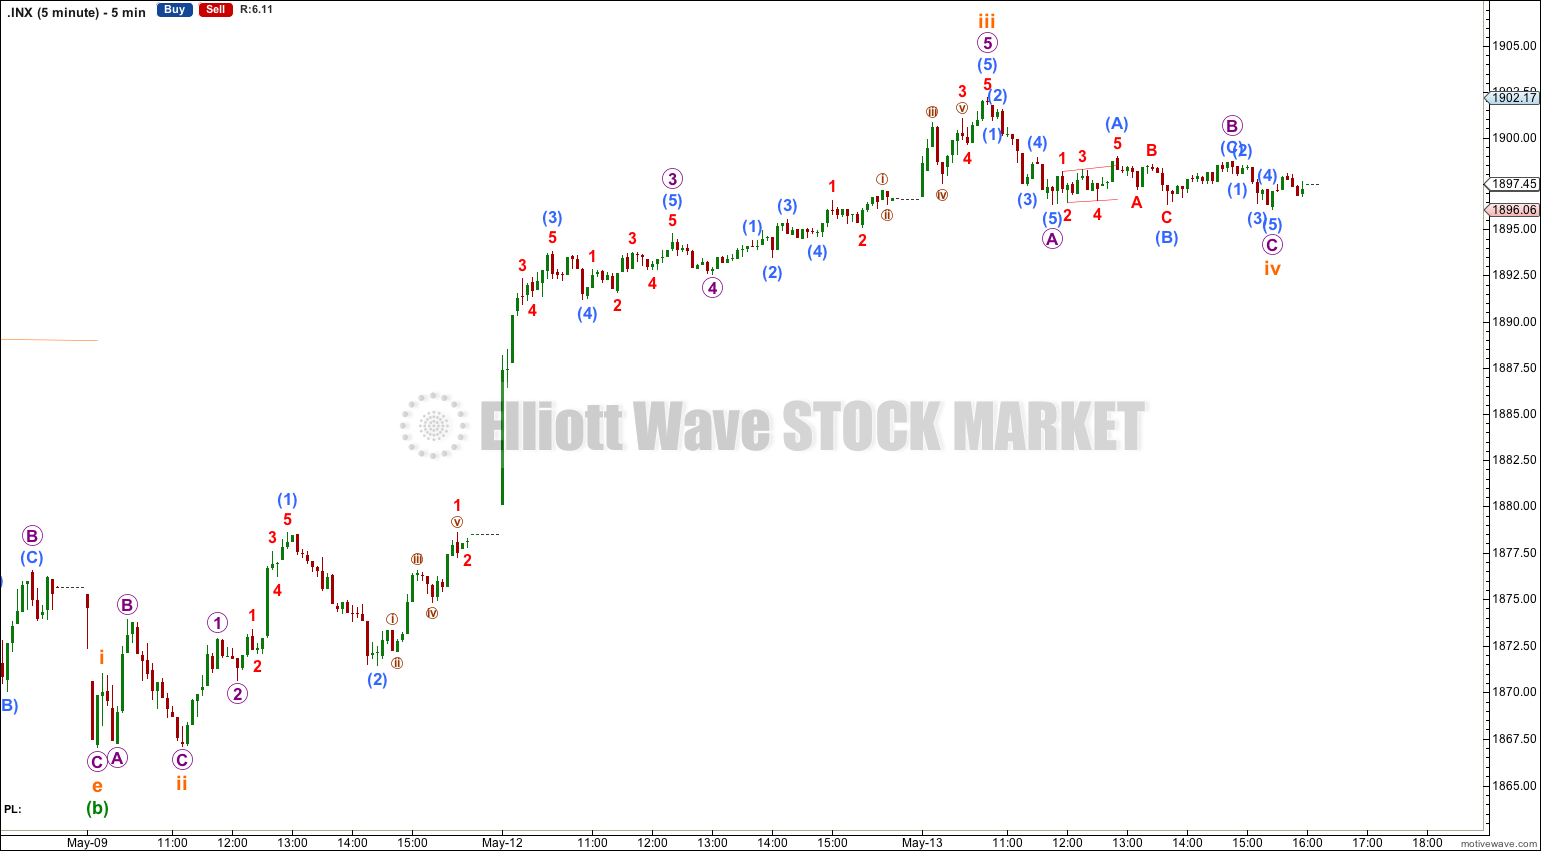
Subminuette wave iv may not move into subminuette wave i price territory below 1,871.01 (this price point was determined on the five minute chart).
Bearish Alternate Wave Count.
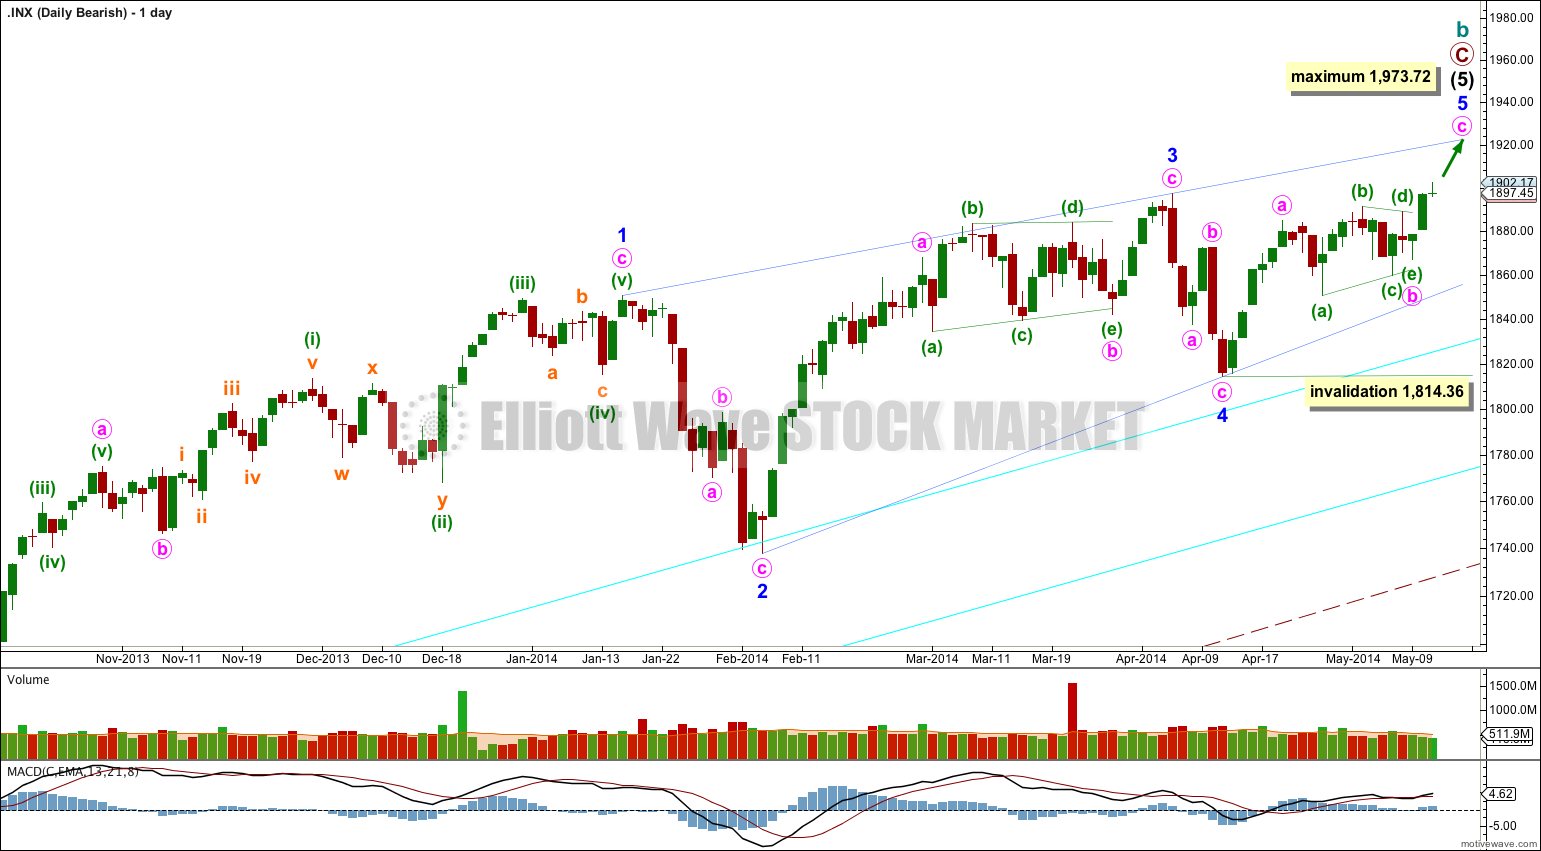
This bearish wave count expects that the correction was not over at 666.79, and that may have been just cycle wave a of a huge expanded flat for a super cycle wave II. Cycle wave b upwards is a close to complete zigzag.
Within flat corrections the maximum common length of B waves in relation to A waves is 138%. So far cycle wave b is a 141% correction of cycle wave a. For this reason also this wave count is an alternate.
Within primary wave C the subdivisions are seen here in exactly the same way as the main wave count, both are seen as incomplete five wave impulses with the final fifth wave an almost complete ending contracting diagonal. This bearish wave count would expect a cycle degree trend change to come in a few days.
Alternatively, it is possible that primary wave C is not close to completion. There are several ways to see the many subdivisions within this long movement. The depth of the next downwards correction will tell us what degree the trend change may be: if downwards movement breaches the lower of the two aqua blue trend lines by more than 3% of market value then I would consider a trend change at cycle degree, and if downwards movement breaches the lower edge of the wider maroon – – – channel on the monthly chart then a cycle degree trend change would be confirmed.