
With price drifting sideways in a narrow range the wave counts all remain the same.
Summary: A third wave downwards may have begun. It is either a third wave within an impulse, or a third wave of an ending expanding diagonal. I still want to see the channel on the hourly chart clearly breached before I have confidence the trend is down. If we see a new low below 1,814.36 this week then the trend at minor degree will be confirmed as downwards.
This analysis is published about 06:10 p.m. EST. Click on charts to enlarge.
Bullish Wave Count.
The aqua blue trend lines are critical for all wave counts. Draw the first trend line from the low of 1,158.66 on 25th November, 2011 to the next swing low at 1,266.74 on 4th June, 2012. Create a parallel copy and place it on the low at 1,560.33 on 24th June, 2013. While price remains above the lower of these two aqua blue trend lines we must assume the trend remains upwards. This is the main reason for the bullish wave count being my main wave count.
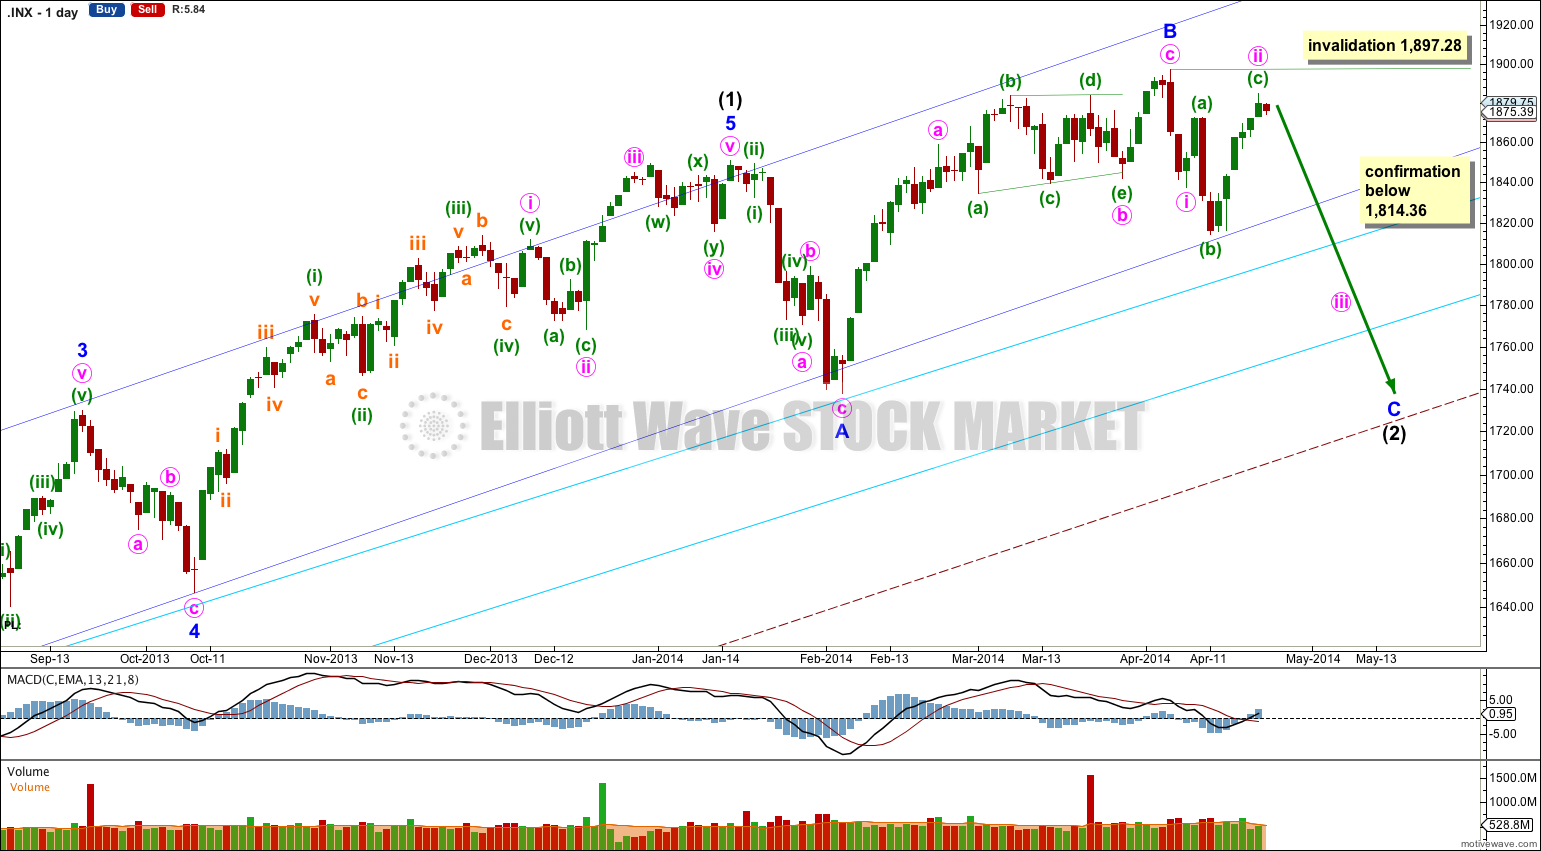
This bullish wave count expects a new bull market began at 666.79 for a cycle wave V. Within cycle wave V primary waves 1 and 2 are complete. Within primary wave 3 intermediate wave (1) is complete at 1,850.84.
Intermediate wave (2) should find some support about the lower of the two aqua blue trend lines.
Intermediate wave (2) is most likely an expanded flat. Downwards movement for minor wave C is highly likely to make a new low below the end of minor wave A at 1,737.92 to avoid a truncation and a rare running flat. This would see the lower of the double aqua blue trend lines breached by an overshoot. In this instance I will apply the classic technical analysis guideline of allowing for a breach of up to 3% of market value (56.92 points). If downwards movement continues beyond this point the wave count would be in doubt and a huge trend change would be indicated.
There is some precedent for a small breach of the lower aqua blue trend line: in November 2012 it was breached by 1.5% of market value. Small overshoots like this can happen.
I do not have a target for minor wave C downwards for you. If it were to reach 1.618 the length of minor wave A then downwards movement would breach the lower aqua blue trend line by more than 3%. If this wave count is correct then that should not happen. We may not see a ratio between minor waves A and C, which is not unusual for the S&P.
When I know where minute waves iii and iv within minor wave C have ended then I will use the ratios within minor wave C between minute waves i, iii and v to calculate a target for it to end. I will only be able to do this for you towards the end of minor wave C.
Minor wave A lasted 14 sessions and minor wave B lasted 41 sessions. If minor wave C lasts about three to five weeks it would be in proportion and the wave count would have the “right look”.
For this bullish wave count when intermediate wave (2) is complete then very strong sustained upwards movement would be expected as an intermediate degree third wave within a primary degree third wave upwards unfolds.
Main Hourly Wave Count.
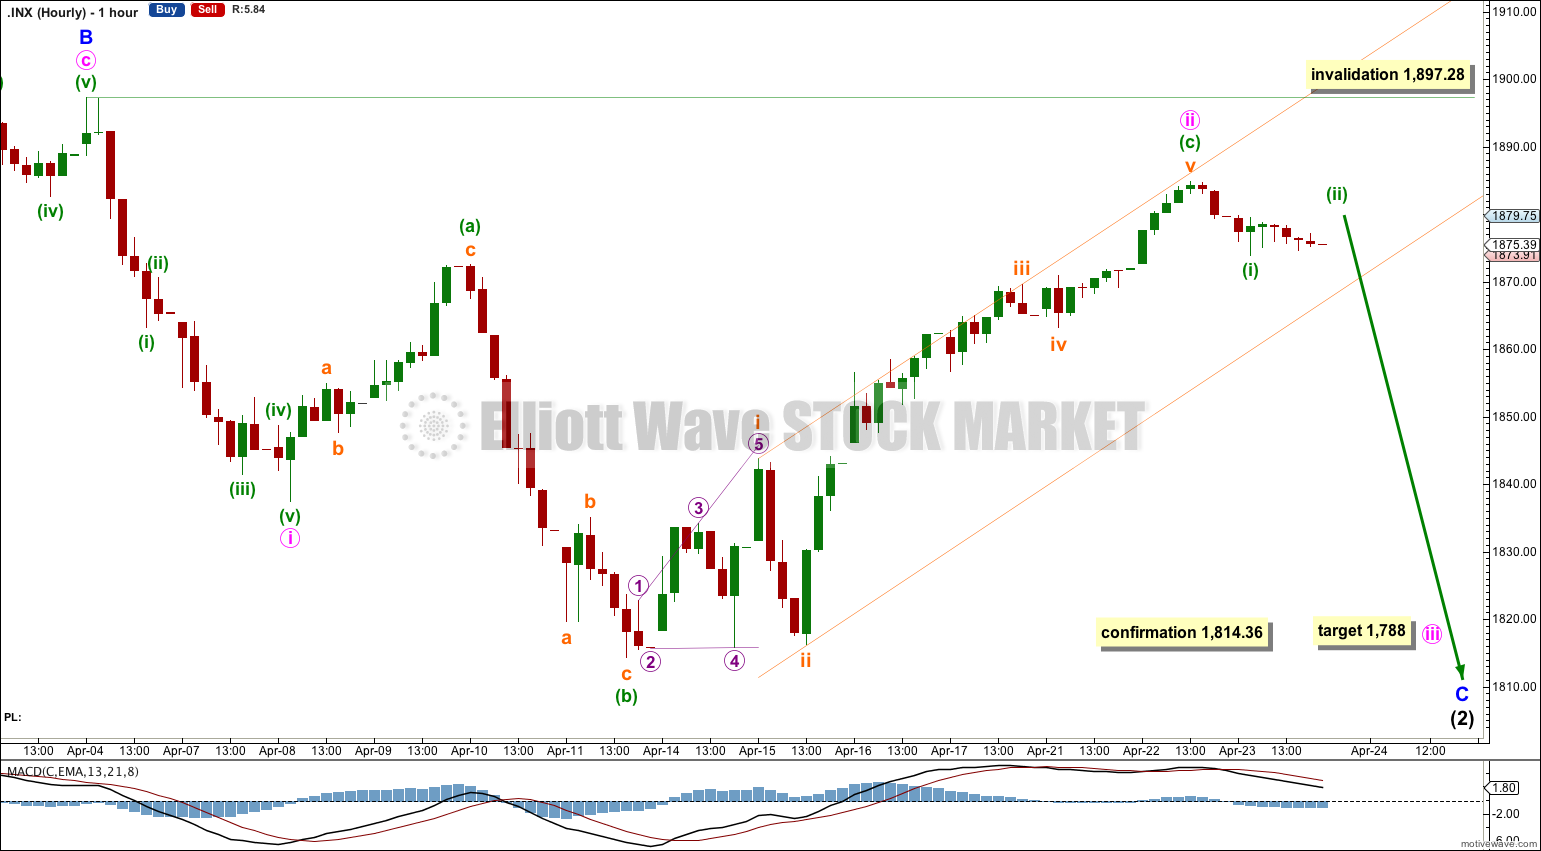
This main hourly wave count looks at the structure of minor wave C downwards as an impulse. This is more likely as impulses for C waves are more common than ending diagonals (alternate below). This main wave count also fits best with seeing the downwards wave labeled minuette wave (b) as a three.
Expanded flat corrections do not fit into parallel channels, so I will use a channel about the C wave of this flat to indicate when it is over. Draw the channel using Elliott’s first technique: draw the first trend line from the highs of subminuette waves i to iii, then place a parallel copy upon the low of subminuette wave ii. When this channel is clearly breached by downwards movement then we shall have confirmation that minuette wave (c) should be over. Wednesday’s sideways movement has not breached the channel.
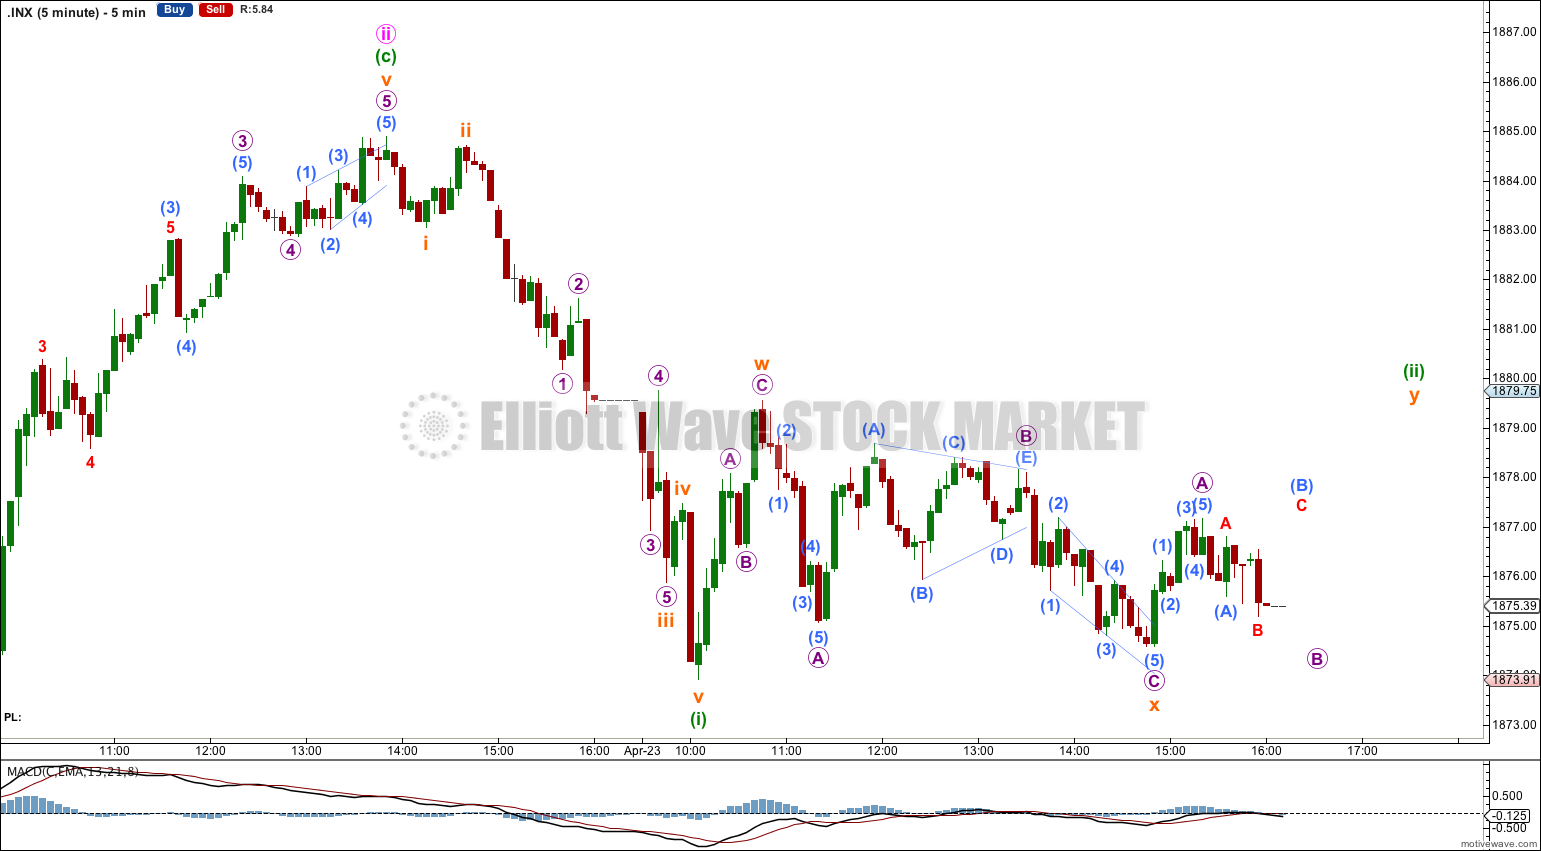
So far within downwards movement minuette wave (i) subdivides perfectly as a five wave impulse. Minuette wave (ii) is an incomplete double zigzag and should move price a little higher tomorrow before it is over. Thereafter, downwards movement should start to show an increase in momentum and the channel should be breached.
Movement below 1,814.36 would invalidate the alternate daily wave count below and provide confirmation that the trend at minor degree is downwards.
Minor wave C downwards may last a total of about another four weeks or so.
While price remains within the channel we have no confirmation that minute wave ii is over. Minute wave ii may not move beyond the start of minute wave i. This wave count is invalidated with movement above 1,897.28.
Alternate Hourly Wave Count.
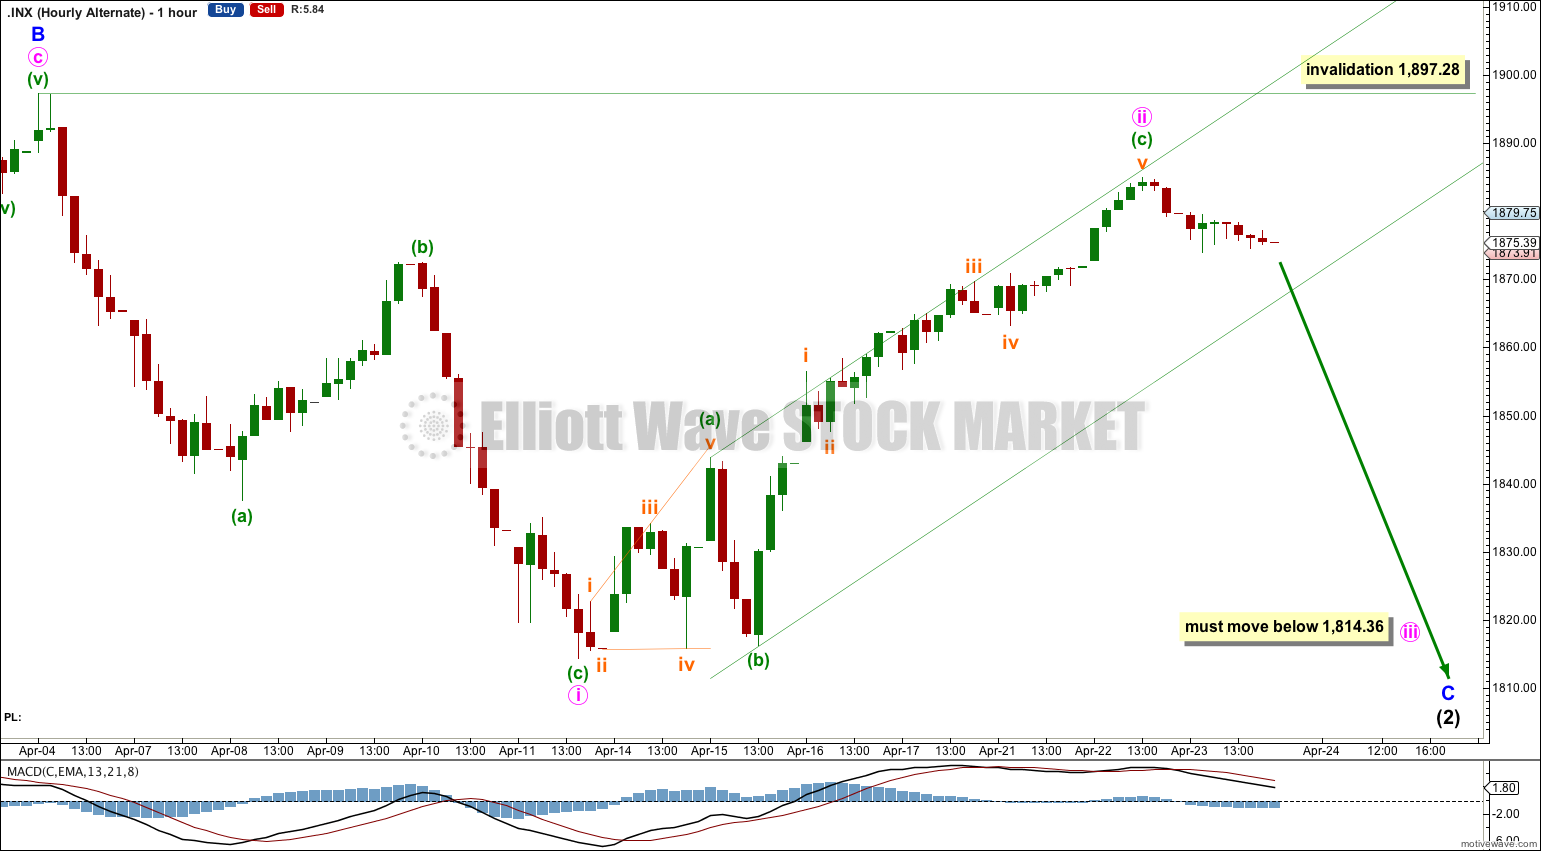
The other possible structure for minor wave C downwards is an ending diagonal.
Within an ending diagonal all the sub waves must subdivide as single zigzags. This fits for minute wave i downwards, although within it minuette wave (c) does not fit as well as a five wave structure.
Minute wave ii may be complete as an 85% correction of minute wave i. This is just longer than the common length for second and fourth waves within diagonals as between 66% to 81%. For this alternate it would now be very likely minute wave ii is over here.
Minute wave ii may not move beyond the start of minute wave i above 1,897.28.
The channel drawn about minuette wave (c) is here a best fit channel (it is drawn in the same way on both hourly wave counts). I would want to see this channel clearly breached by downwards movement to have confidence that minute wave ii is over and minute wave iii is underway.
Minute wave iii downwards must subdivide as a single zigzag and must move beyond the end of minute wave i below 1,814.36. There is not normally a Fibonacci ratio between first, third and fifth waves of diagonals. For this alternate I have to wait until minuette waves (a) and (b) within the zigzag of minute wave iii are complete before I can calculate a target for it to end for you.
The diagonal must be expanding in order for minor wave C to reach below the end of minor wave A at 1,737.92. This would require minute wave iii to be longer than 82.92 points, the length of minute wave i.
Daily Alternate Wave Count.
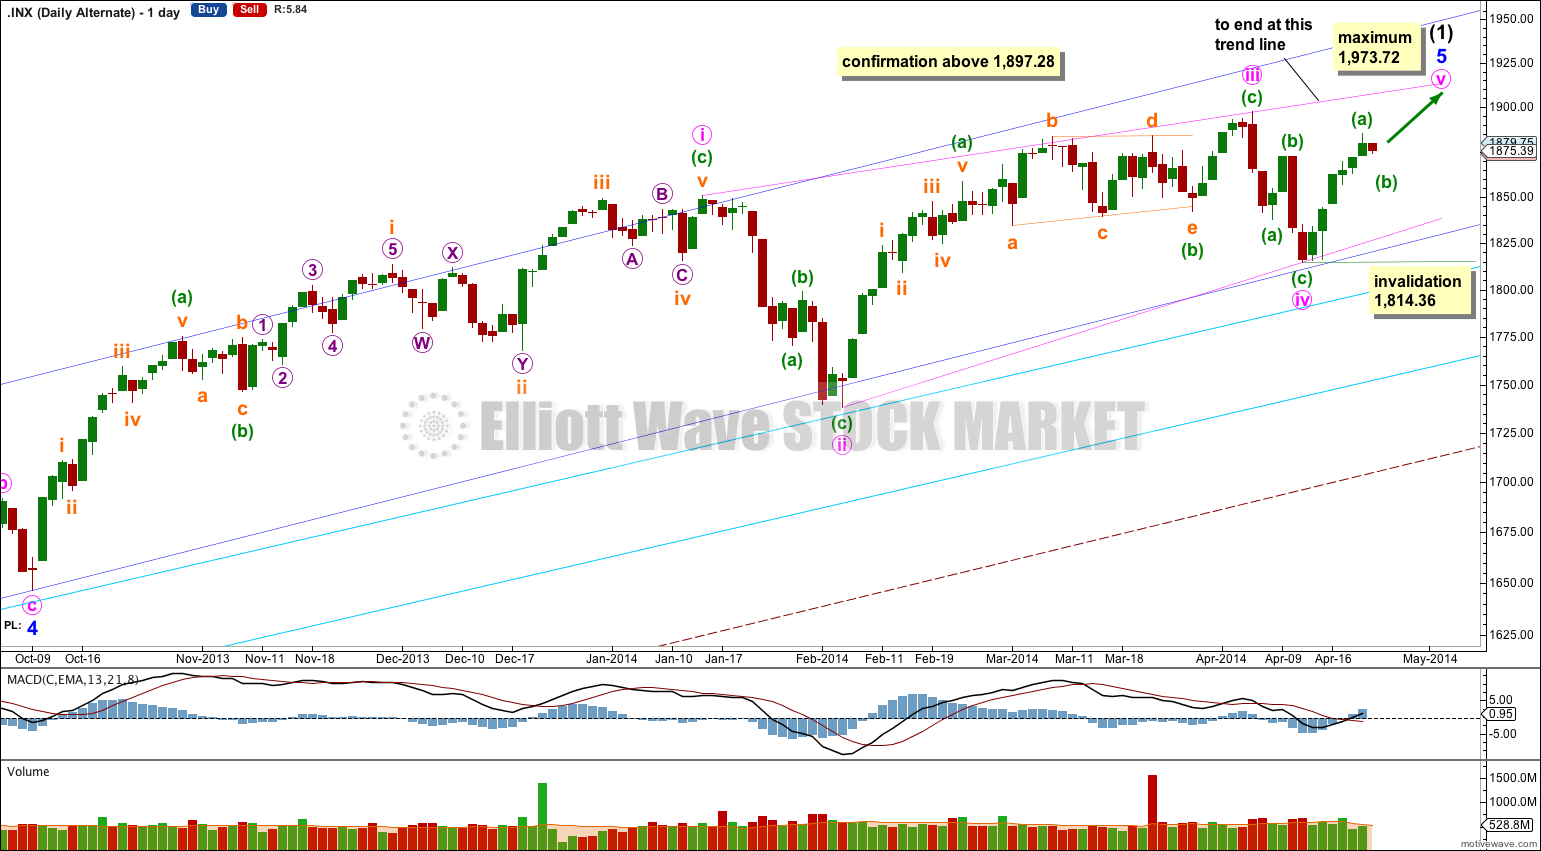
It is possible that intermediate wave (1) is not over and that within it minor wave 5 is unfolding as an ending contracting diagonal.
Within an ending diagonal all the subwaves may only subdivide as single zigzags.
The diagonal is contracting because minute wave iii is shorter than minute wave i, and minute wave iv is shorter than minute wave ii. The trend lines converge.
Minute wave ii was 55% correction of minute wave i, and minute wave iv was a 52% correction of minute wave iii. Both of these corrections are less than the common length for second and fourth waves within diagonals of between 66% to 81%. This reduces the probability of this alternate wave count, and it gives the possible diagonal an atypical look.
This wave count would be confirmed with movement above 1,897.28. If the last upwards wave for minute wave v subdivides clearly as a single zigzag then this would be my only wave count.
Because the diagonal is contracting, and because minute wave iii is shorter than minute wave i, minute wave v may not be longer than equality with minute wave iii. This maximum limit is at 1,973.72.
Minute wave v would most likely end at the upper 1-3 trend line of the diagonal.
Bearish Alternate Wave Count.
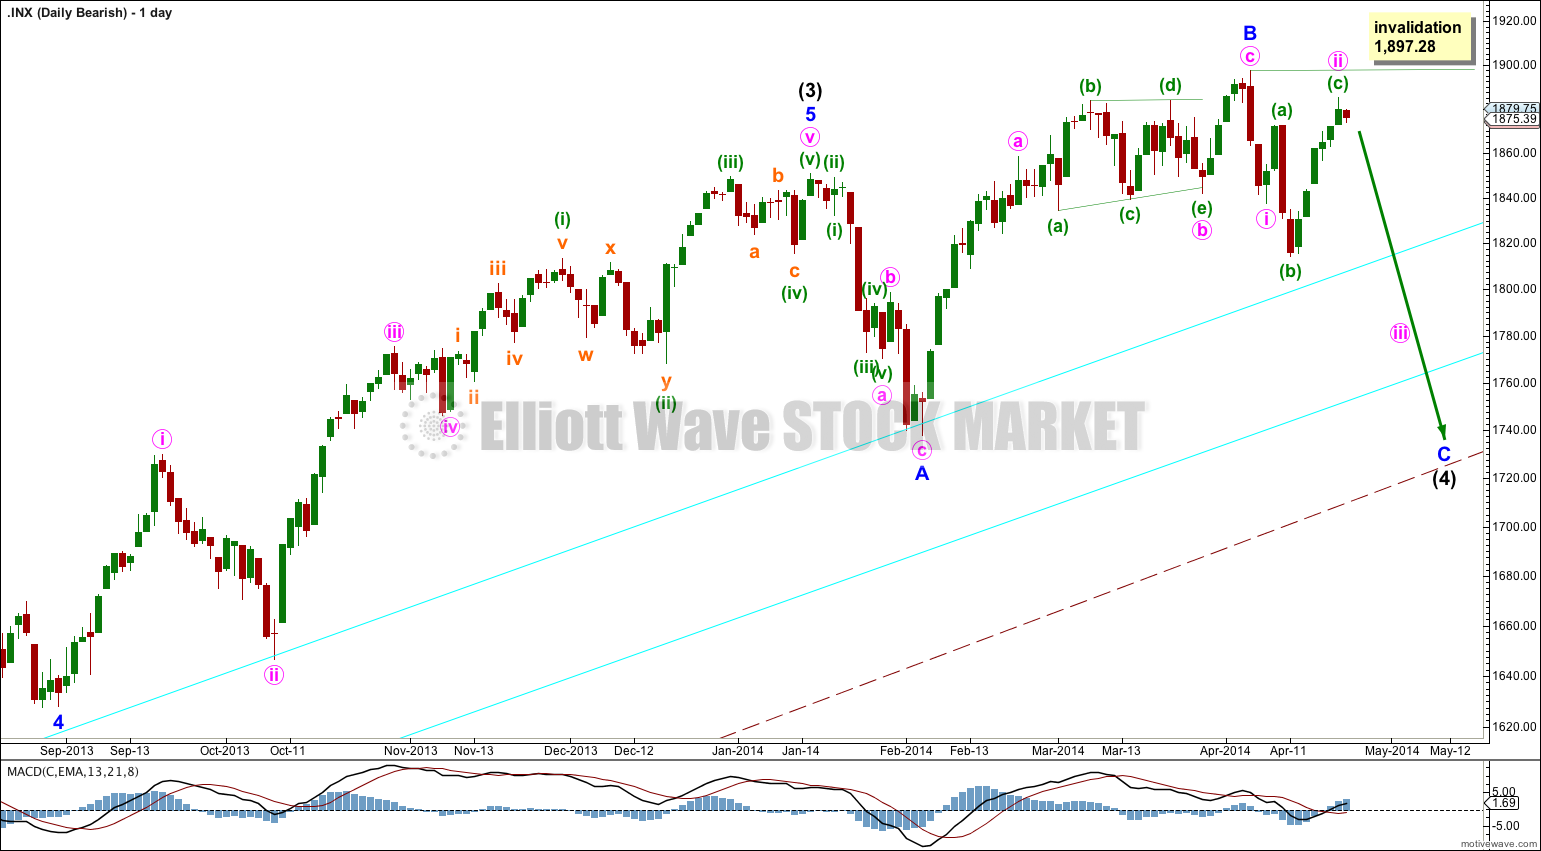
This bearish wave count expects that the correction was not over at 666.79, and that may have been just cycle wave a of a huge expanded flat for a super cycle wave II. Cycle wave b upwards is a close to complete zigzag.
Within flat corrections the maximum common length of B waves in relation to A waves is 138%. So far cycle wave b is a 141% correction of cycle wave a. For this reason only this wave count is an alternate.
Within primary wave C of the zigzag intermediate wave (4) would be incomplete.
The subdivisions for intermediate wave (4) would be the same as the main wave count for intermediate wave (2). I would expect it to end at the lower aqua blue trend line.
At 2,190 primary wave C would reach 1.618 the length of primary wave A. When intermediate wave (4) is complete I would recalculate this target at intermediate degree. I have found Fibonacci ratios between actionary waves (1, 3 and 5) of impulses are more reliable than between A and C waves within zigzags for the S&P500.
If intermediate wave (5) lasts about five to six months it may end about October this year.