
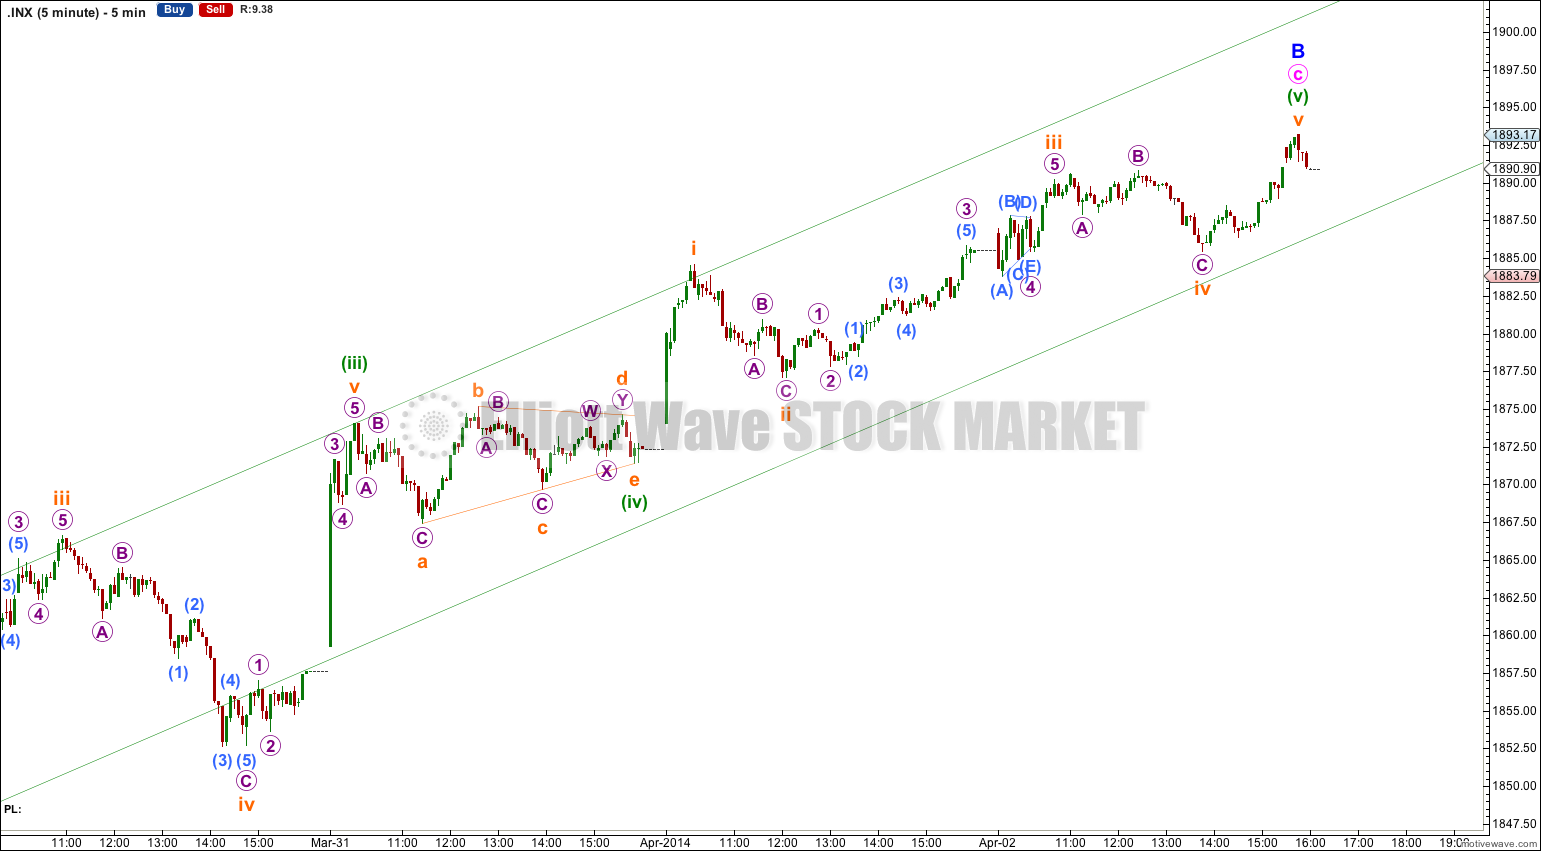
Upwards movement continued just a little higher as expected for Wednesday’s session. The target at 1,890 to 1,891 was reached and passed.
The maximum expected limit at 1,894 has not been exceeded, yet.
Summary: It is likely now that upwards movement has ended for the mid term. I want to see a clear breach of the small channel on the hourly chart, followed by a new low below 1,842.11 within the next few days to have confidence in this minor degree trend change.
This analysis is published about 06:00 p.m. EST. Click on charts to enlarge.
Bullish Wave Count.
The aqua blue trend lines are critical for all wave counts. Draw the first trend line from the low of 1,158.66 on 25th November, 2011 to the next swing low at 1,266.74 on 4th June, 2012. Create a parallel copy and place it on the low at 1,560.33 on 24th June, 2013. While price remains above the lower of these two aqua blue trend lines we must assume the trend remains upwards. This is the main reason for the bullish wave count being my main wave count.
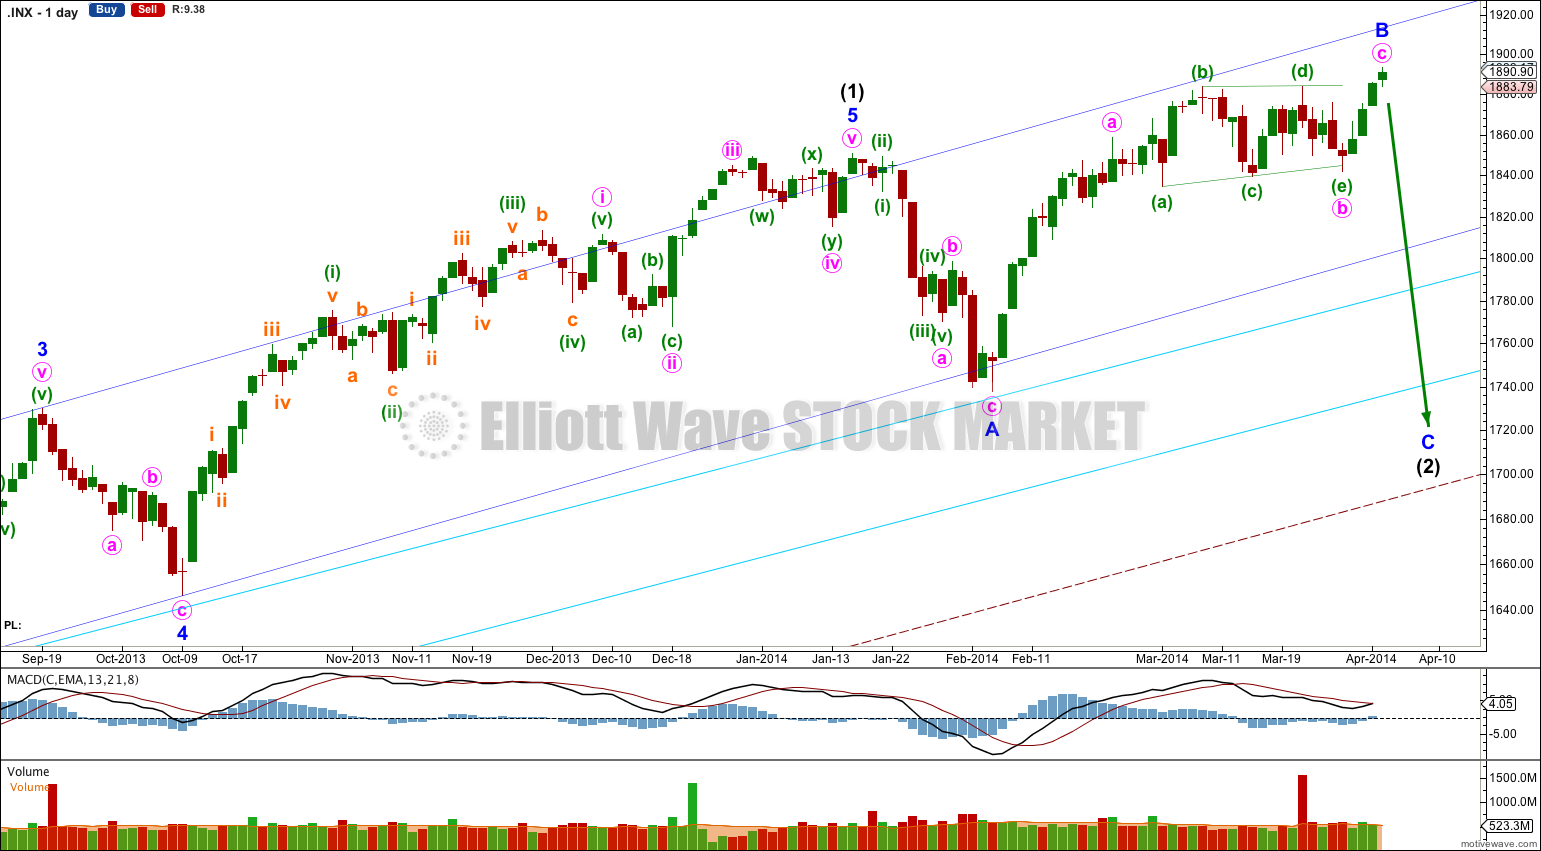
This bullish wave count expects a new bull market began at 666.79 for a cycle wave V. Within cycle wave V primary waves 1 and 2 are complete. Within primary wave 3 intermediate wave (1) is complete at 1,850.84. Intermediate wave (2) is continuing as an expanded flat correction.
Intermediate wave (2) should find strong support about the lower of the two aqua blue trend lines. It is very unlikely to be over at the low labeled minor wave A because it would not have breached the dark blue channel containing intermediate wave (1), and it would be a remarkably brief intermediate degree correction.
Intermediate wave (2) is most likely an expanded flat. Downwards movement for minor wave C is highly likely to make a new low below the end of minor wave A at 1,737.92 to avoid a truncation and a rare running flat. This would see the lower of the double aqua blue trend lines breached by an overshoot. In this instance I will apply the classic technical analysis guideline of allowing for a breach of up to 3% of market value. If downwards movement continues beyond this point the wave count would be in doubt and a huge trend change would be indicated.
There is some precedent for a small breach of the lower aqua blue trend line: in November 2012 it was breached by 1.5% of market value. Small overshoots like this can happen.
For this bullish wave count when intermediate wave (2) is complete then very strong sustained upwards movement would be expected as an intermediate degree third wave within a primary degree third wave upwards unfolds.
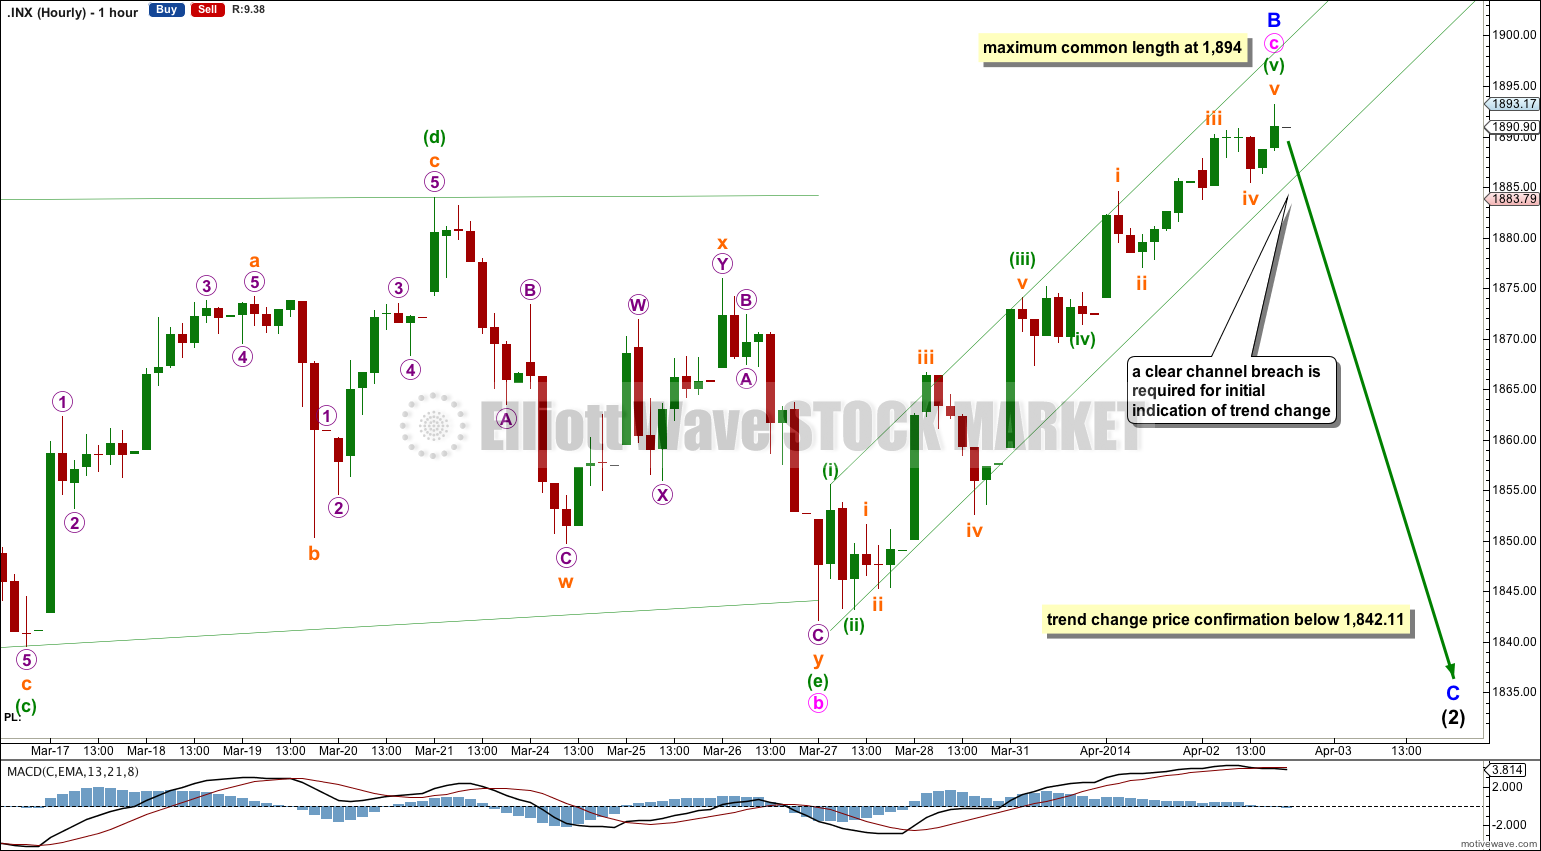
Minor wave B is most likely to be over as a 137% correction of minor wave A. This is just below the maximum common length of 138% for a B wave within a flat correction. The structure is now complete.
Within minor wave B minute wave c is 4.92 points longer than 0.382 the length of minute wave a.
Ratios within minute wave c are: there is no Fibonacci ratio between minuette waves (iii) and (i), and minuette wave (v) is just 0.02 points longer than 1.618 the length of minuette wave (i).
Draw a channel about minute wave c using Elliott’s first technique: draw the first trend line from the ends of the first and third waves, place a parallel copy upon the end of the second wave. When this channel is clearly breached by downwards movement we shall have the first indication of a trend change which may be at minor degree.
Movement below 1,842.11 to a new low would confirm the trend change is at minor degree because at that point downwards movement could not be a second wave correction within a continuing upwards trend. Only at this stage will I have full confidence that minor wave C has begun.
I do not have a target for minor wave C downwards for you. If it were to reach 1.618 the length of minor wave A then downwards movement would breach the lower aqua blue trend line by more than 3%. If this wave count is correct then that should not happen. We may not see a ratio between minor waves A and C, which is not unusual for the S&P.
When I know where minute waves iii and iv within minor wave C have ended then I will use the ratios within minor wave C between minute waves i, iii and v to calculate a target for it to end. I will only be able to do this for you towards the end of the movement.
I would expect minor wave C downwards to last for about three to four weeks.
Because price remains within the channel and there is no confirmation of a trend change I will not add an invalidation point to the hourly chart. We must accept the possibility of more upwards movement, although it does have a lower probability today.
Bearish Alternate Wave Count.
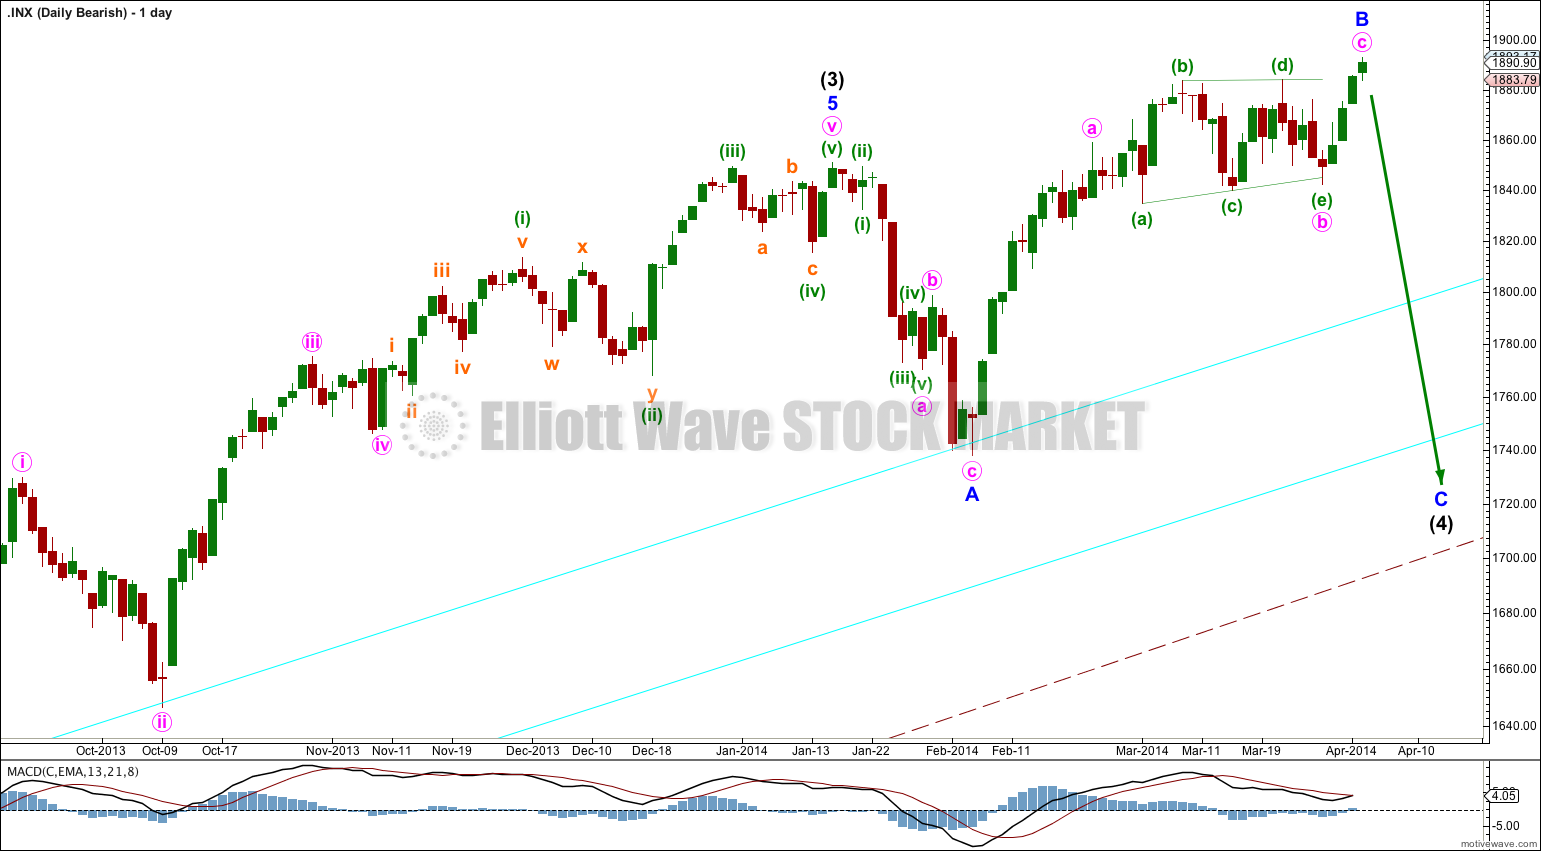
This bearish wave count expects that the correction was not over at 666.79, and that may have been just cycle wave a of a huge expanded flat for a super cycle wave II. Cycle wave b upwards is a close to complete zigzag.
Within flat corrections the maximum common length of B waves in relation to A waves is 138%. So far cycle wave b is a 141% correction of cycle wave a. For this reason only this wave count is an alternate.
Within primary wave C of the zigzag intermediate wave (4) would be incomplete.
The subdivisions for intermediate wave (4) would be the same as the main wave count for intermediate wave (2). I would expect it to end at the lower aqua blue trend line.
At 2,190 primary wave C would reach 1.618 the length of primary wave A. When intermediate wave (4) is complete I would recalculate this target at intermediate degree. I have found Fibonacci ratios between actionary waves (1, 3 and 5) of impulses are more reliable than between A and C waves within zigzags for the S&P500.
If intermediate wave (5) lasts about five to six months it may end about October this year.
Can you please explain… on the one hand, you expect price to remain above the lower of the two aqua blue trend lines. But you also expect minor wave C to be below the minor wave A low 1737.92. Since the lower blue line is at 1740, both can’t be true?
Sorry I re-read it and saw the part about the 3% overshoot.
a 3% overshoot of 1740 would be 52.2 points.