
Upwards movement invalidated the hourly wave count. This continuing sideways movement in an ever decreasing range suggests a triangle may be forming, and I will revert again to that idea as an alternate.
Summary: With the hourly wave count invalidated I do not have confidence that the trend is down. We may see a new high before the downwards trend for minor wave C.
This analysis is published about 06:30 p.m. EST. Click on charts to enlarge.
Bullish Wave Count.
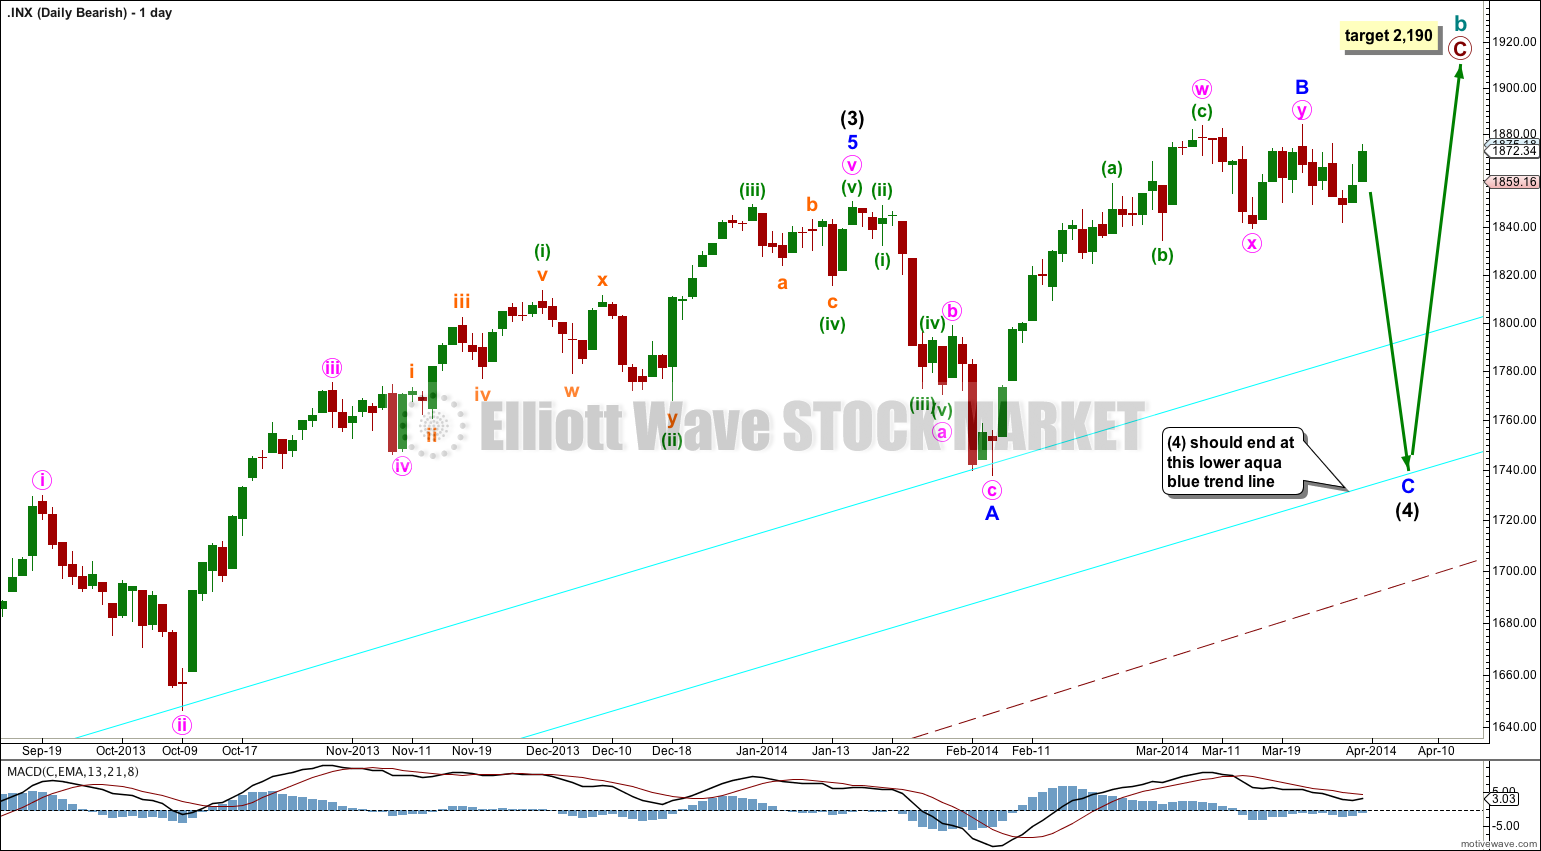
The aqua blue trend lines are critical for all wave counts. Draw the first trend line from the low of 1,158.66 on 25th November, 2011 to the next swing low at 1,266.74 on 4th June, 2012. Create a parallel copy and place it on the low at 1,560.33 on 24th June, 2013. While price remains above the lower of these two aqua blue trend lines we must assume the trend remains upwards. This is the main reason for the bullish wave count being my main wave count.
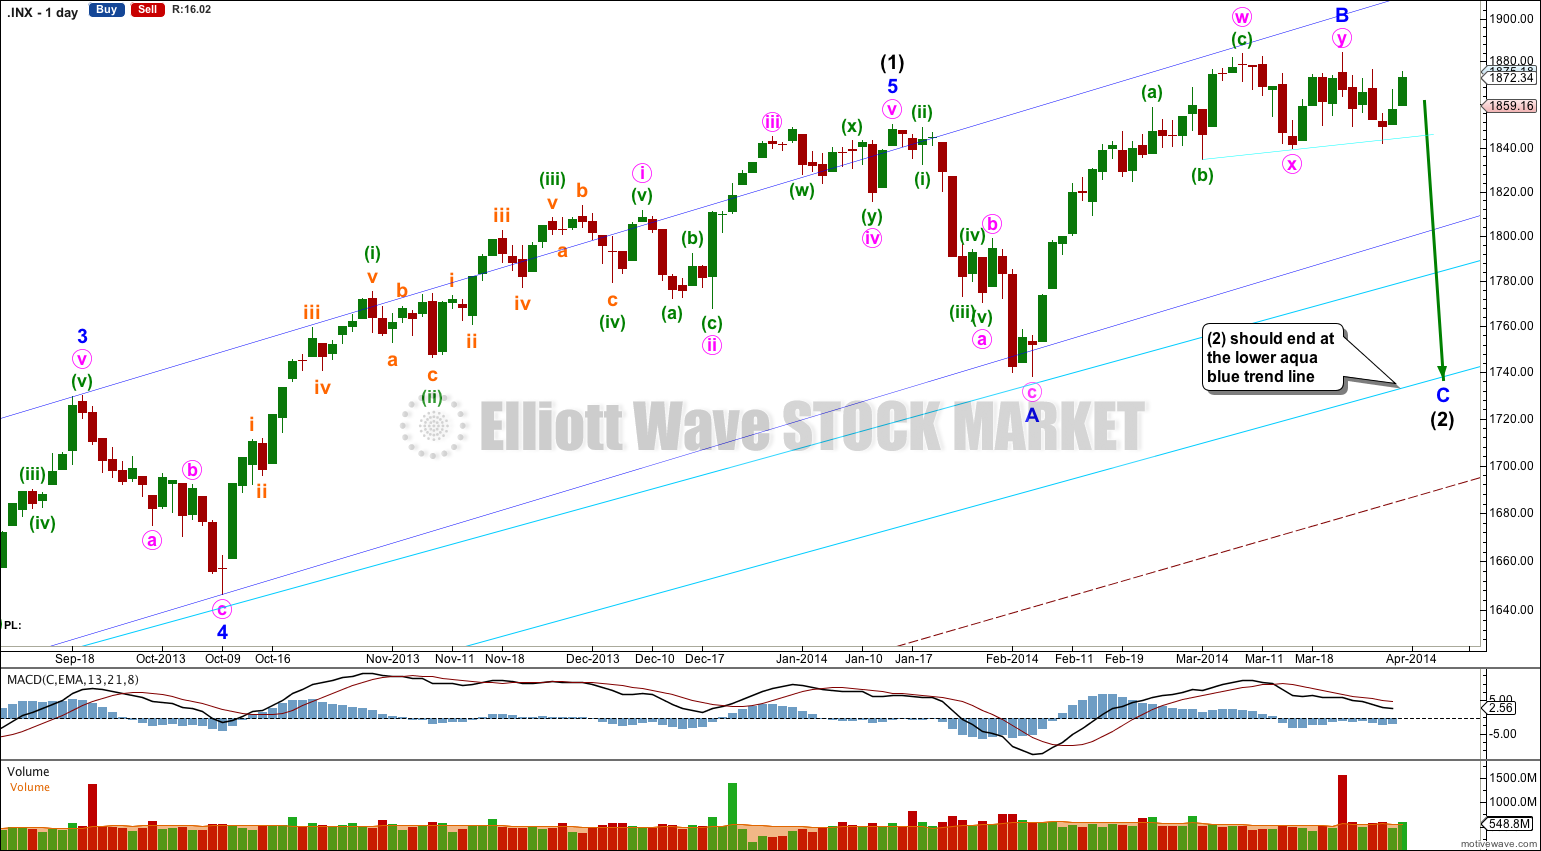
This bullish wave count expects a new bull market began at 666.79 for a cycle wave V. Within cycle wave V primary waves 1 and 2 are complete. Within primary wave 3 intermediate wave (1) is complete at 1,850.84. Intermediate wave (2) is continuing as an expanded flat correction.
Intermediate wave (2) should find strong support at the lower of the two aqua blue trend lines. Minor wave A lasted 14 days and minor wave B lasted 31 days. I would expect minor wave C to be of a similar duration and to last about three to four weeks in total.
For this bullish wave count when intermediate wave (2) is complete then very strong sustained upwards movement would be expected as an intermediate degree third wave within a primary degree third wave upwards unfolds.
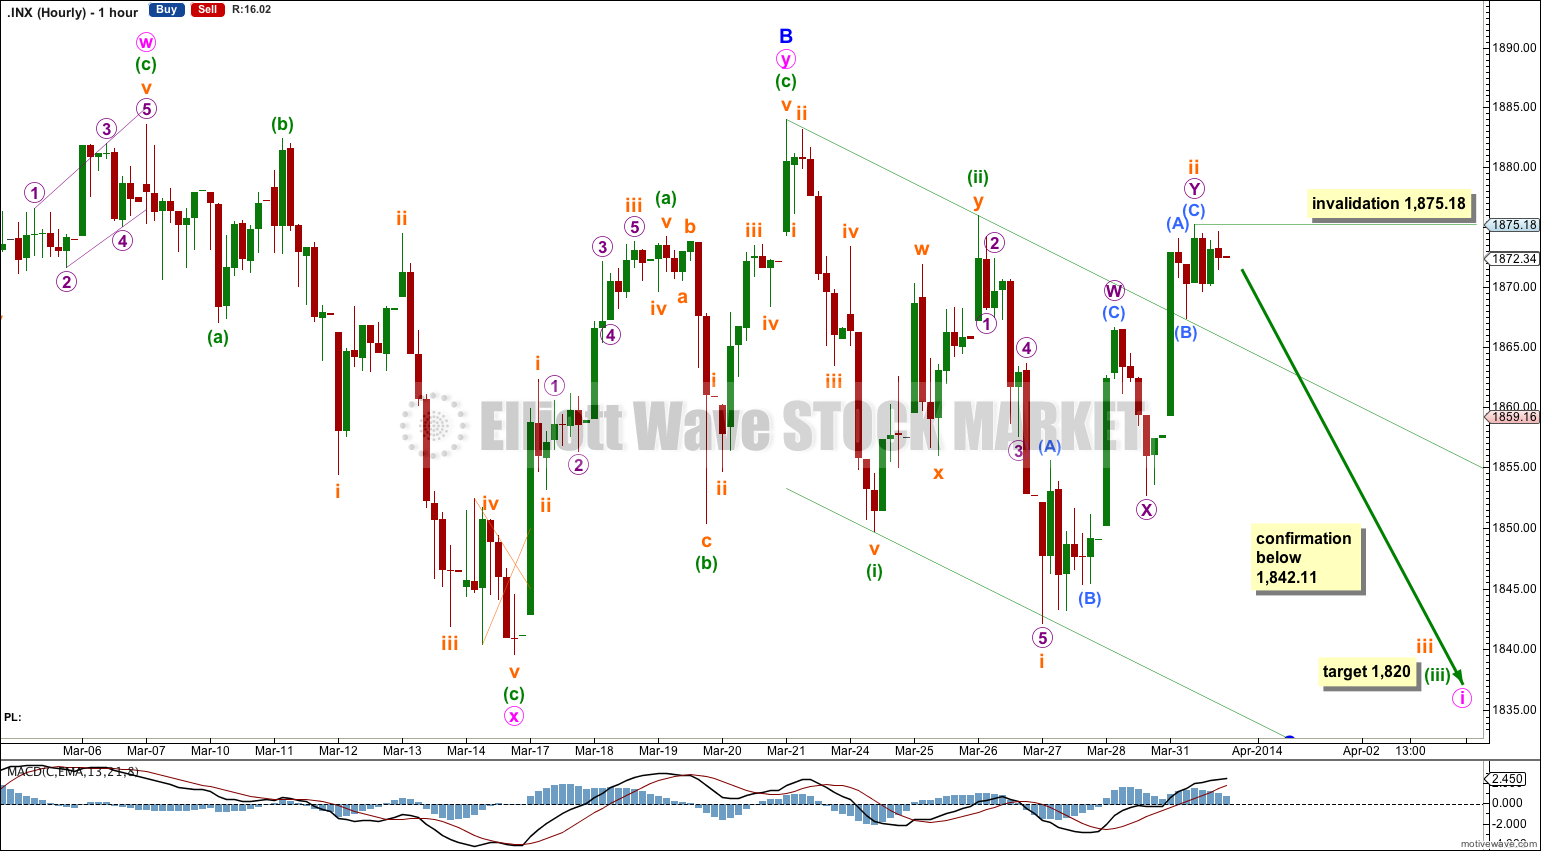
Minor wave C must subdivide as a five wave motive structure, either an impulse or an ending diagonal. An impulse is much more likely as it is more common.
However, subminuette wave ii now breaches the upper edge of the base channel drawn about minuette waves (i) and (ii) one degree higher which reduces the probability of this wave count. For this reason I am again considering the possibility of a triangle (alternate wave count below).
This wave count requires movement below 1,842.11 along with an increase in downwards momentum.
At 1,820 minuette wave (iii) would reach 1.618 the length of minuette wave (i).
Within subminuette wave iii no second wave correction may move beyond the start of its first wave. This wave count is invalidated with movement above 1,875.18.
Alternate Hourly Wave Count.
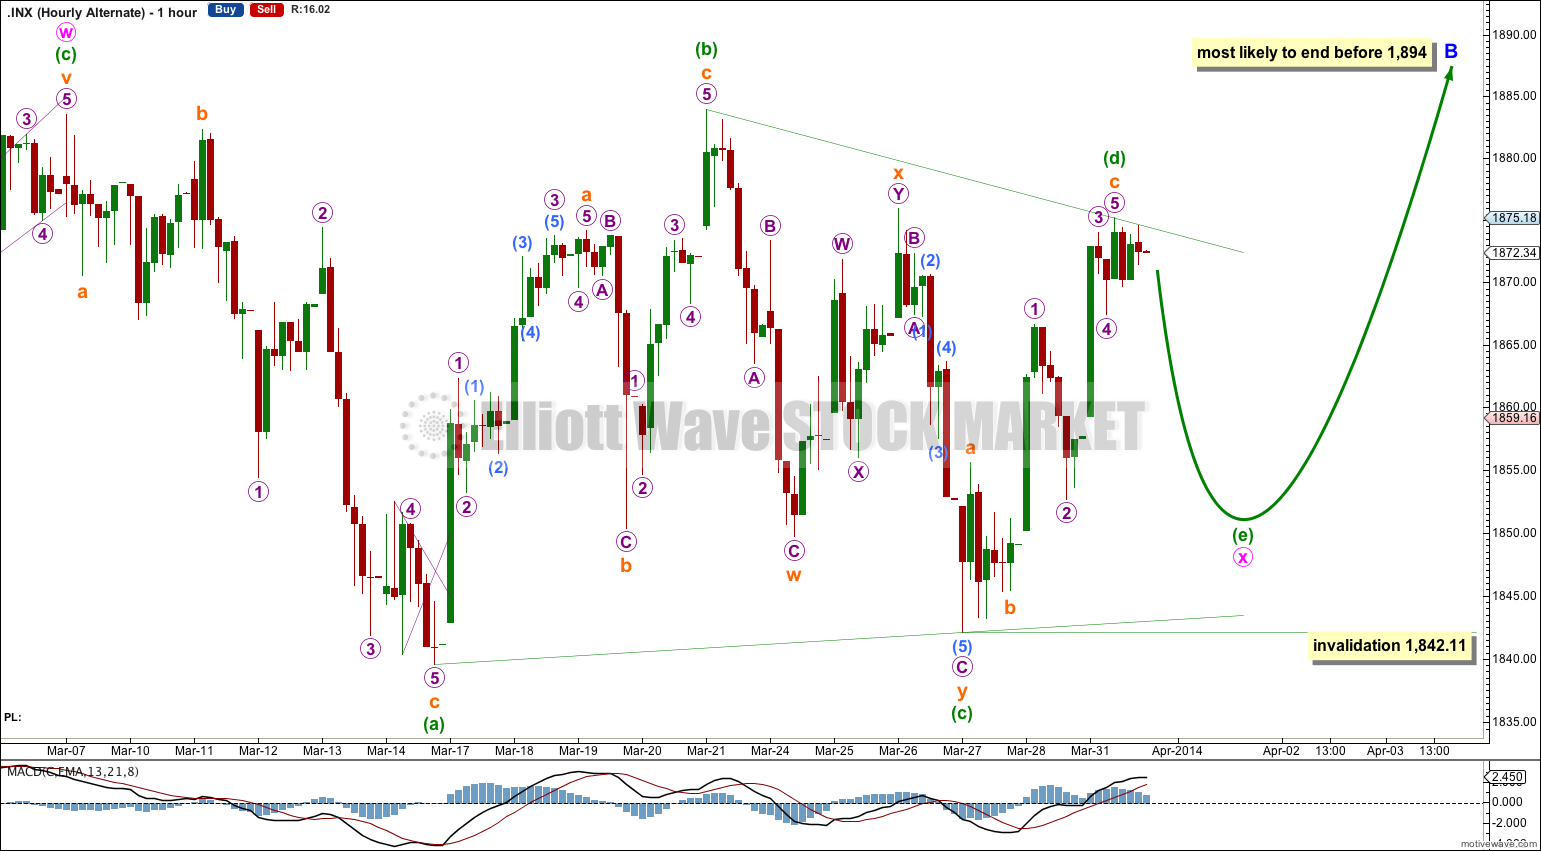
It is still possible that minor wave B is not over and is subdividing as a double zigzag, with minute wave x within it a contracting triangle.
This triangle is not supported by MACD; normally MACD hovers about zero while triangles unfold. This reduces the probability of this wave count to an alternate.
Within the triangle all subwaves are corrective structures, three are single zigzags and minuette wave (c) is a double zigzag. Minuette wave (e) downwards must be a zigzag and it may not move beyond the end of minuette wave (c) below 1,842.11.
Bearish Alternate Wave Count.
This bearish wave count expects that the correction was not over at 666.79, and that may have been just cycle wave a of a huge expanded flat for a super cycle wave II. Cycle wave b upwards is a close to complete zigzag.
Within flat corrections the maximum common length of B waves in relation to A waves is 138%. So far cycle wave b is a 141% correction of cycle wave a. For this reason only this wave count is an alternate.
Within primary wave C of the zigzag intermediate wave (4) would be incomplete.
The subdivisions for intermediate wave (4) would be the same as the main wave count for intermediate wave (2). I would expect it to end at the lower aqua blue trend line.
At 2,190 primary wave C would reach 1.618 the length of primary wave A. When intermediate wave (4) is complete I would recalculate this target at intermediate degree. I have found Fibonacci ratios between actionary waves (1, 3 and 5) of impulses are more reliable than between A and C waves within zigzags for the S&P500.
If intermediate wave (5) lasts about five to six months it may end about October this year.
Lara,
Please remind me why you think this recent advance of the S&P should end before 1894. Also, is there an invalidation point for upside movement in the alternate hourly wave count?
Thanks,
Rodney
that’s the maximum common length of a B wave within a flat correction
so minor wave B is most likely to end before that, to be within the most common range.