
Downwards movement was expected from the main wave count. The alternate is now invalidated and I have some confidence in the main wave count.
Price has not moved low enough for confidence in this wave count yet. The outlook is unchanged.
Summary: I have some confidence today that the trend is down. A clear breach of the small aqua blue trend line on the daily chart would provide further confidence. The mid term target is 1,820.
This analysis is published about 05:40 p.m. EST. Click on charts to enlarge.
Bullish Wave Count.
The aqua blue trend lines are critical for all wave counts. Draw the first trend line from the low of 1,158.66 on 25th November, 2011 to the next swing low at 1,266.74 on 4th June, 2012. Create a parallel copy and place it on the low at 1,560.33 on 24th June, 2013. While price remains above the lower of these two aqua blue trend lines we must assume the trend remains upwards. This is the main reason for the bullish wave count being my main wave count.
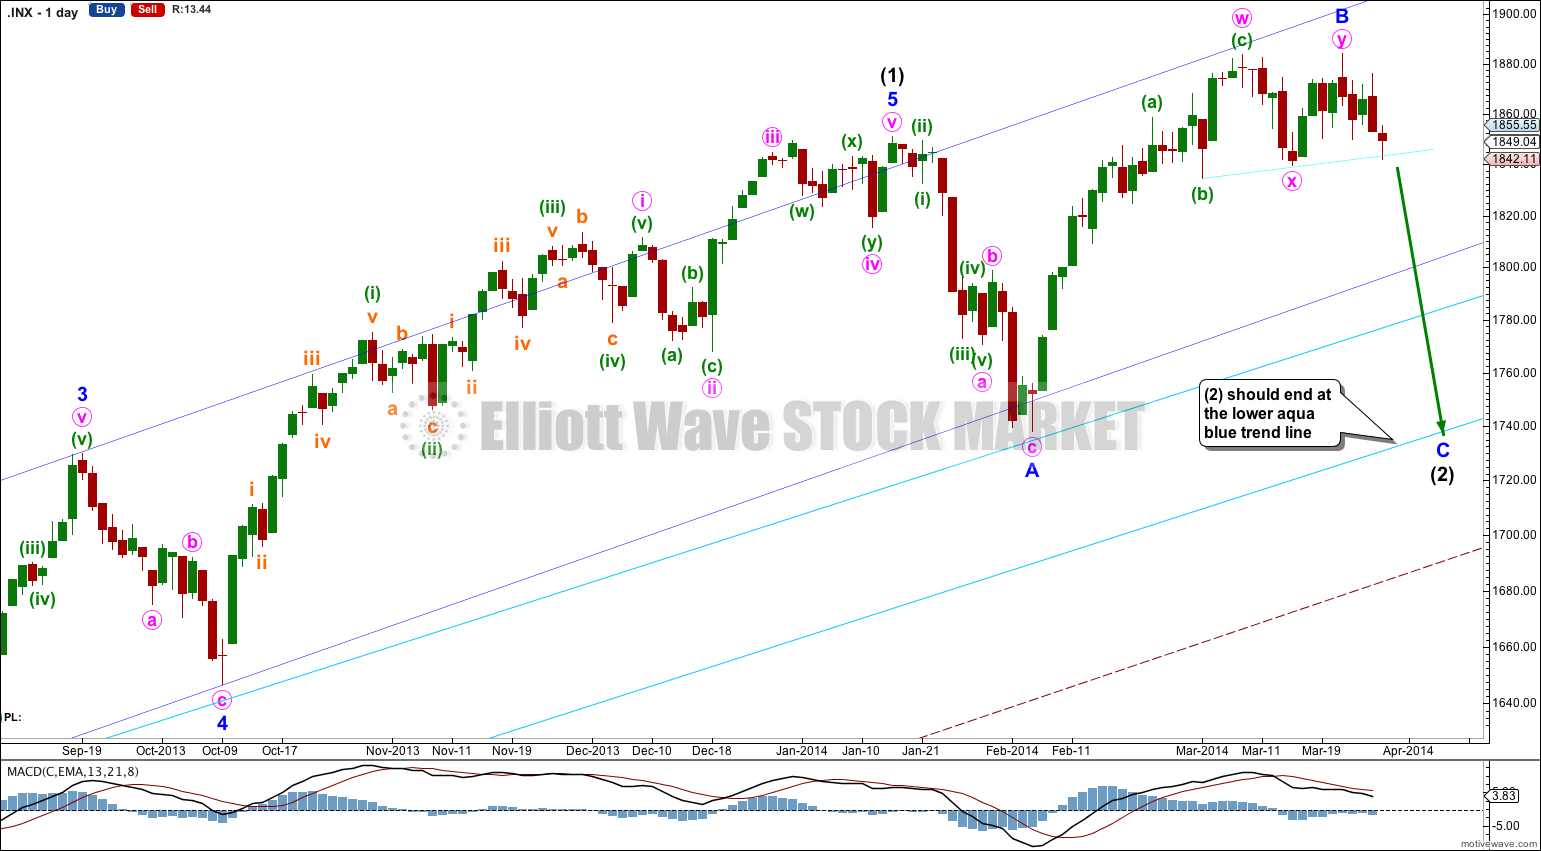
This bullish wave count expects a new bull market began at 666.79 for a cycle wave V. Within cycle wave V primary waves 1 and 2 are complete. Within primary wave 3 intermediate wave (1) is complete at 1,850.84. Intermediate wave (2) is continuing as an expanded flat correction.
Intermediate wave (2) should find strong support at the lower of the two aqua blue trend lines. Minor wave A lasted 14 days and minor wave B lasted 31 days. I would expect minor wave C to be of a similar duration and to last about three to four weeks in total.
For this bullish wave count when intermediate wave (2) is complete then very strong sustained upwards movement would be expected as an intermediate degree third wave within a primary degree third wave upwards unfolds.
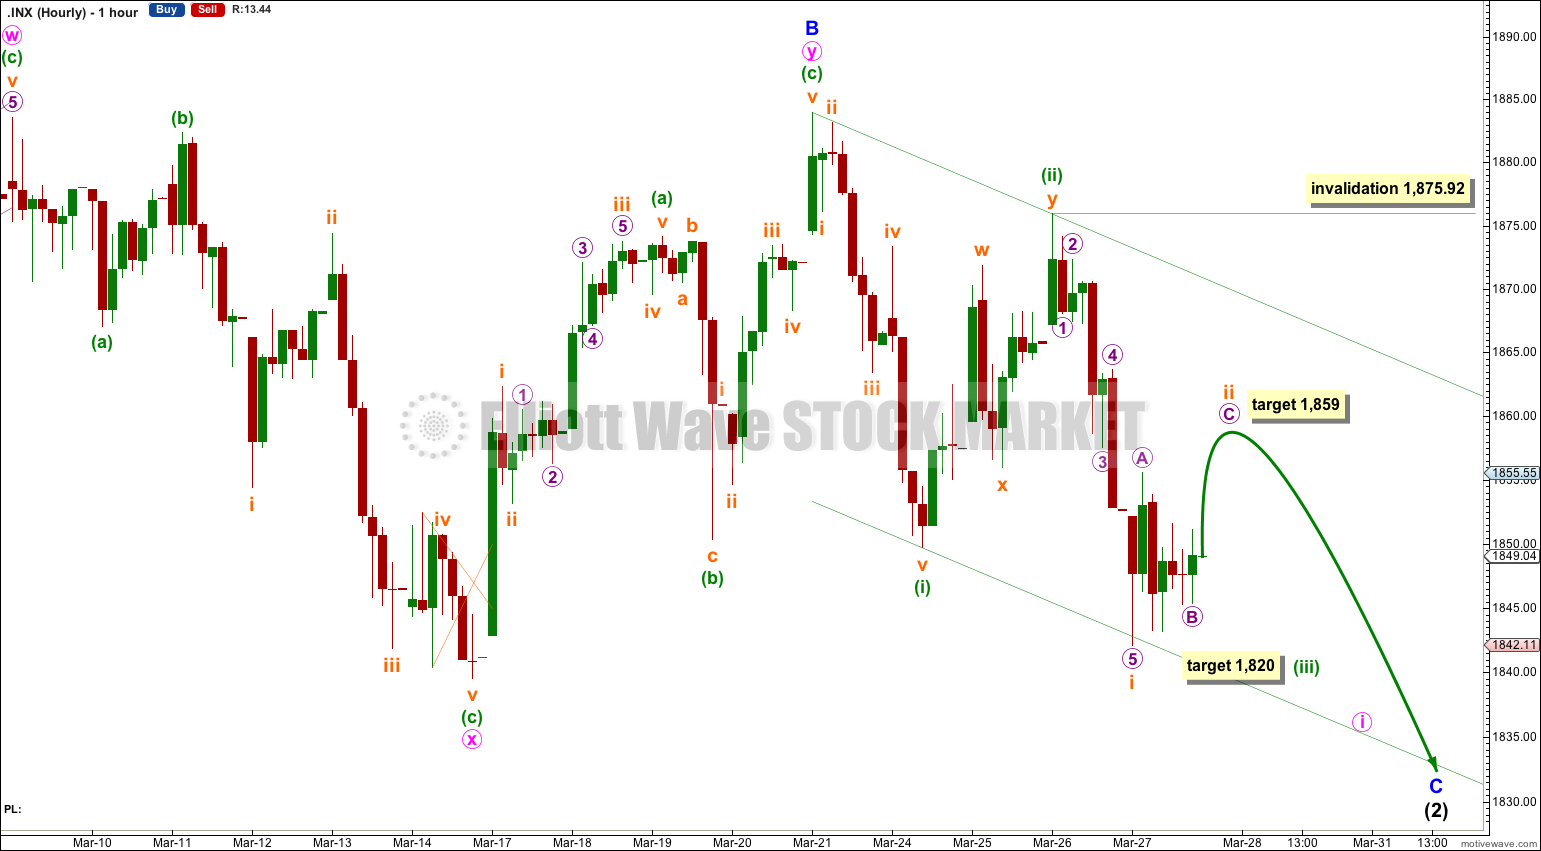
Minor wave C must subdivide as a five wave motive structure, either an impulse or an ending diagonal. An impulse is much more likely as it is more common.
Within it minute wave i is most likely incomplete and is most likely unfolding as an impulse.
At 1,820 minuette wave (iii) would reach 1.618 the length of minuette wave (i). This next downwards wave should show an increase in downwards momentum when it moves towards its middle, and we’re not there yet.
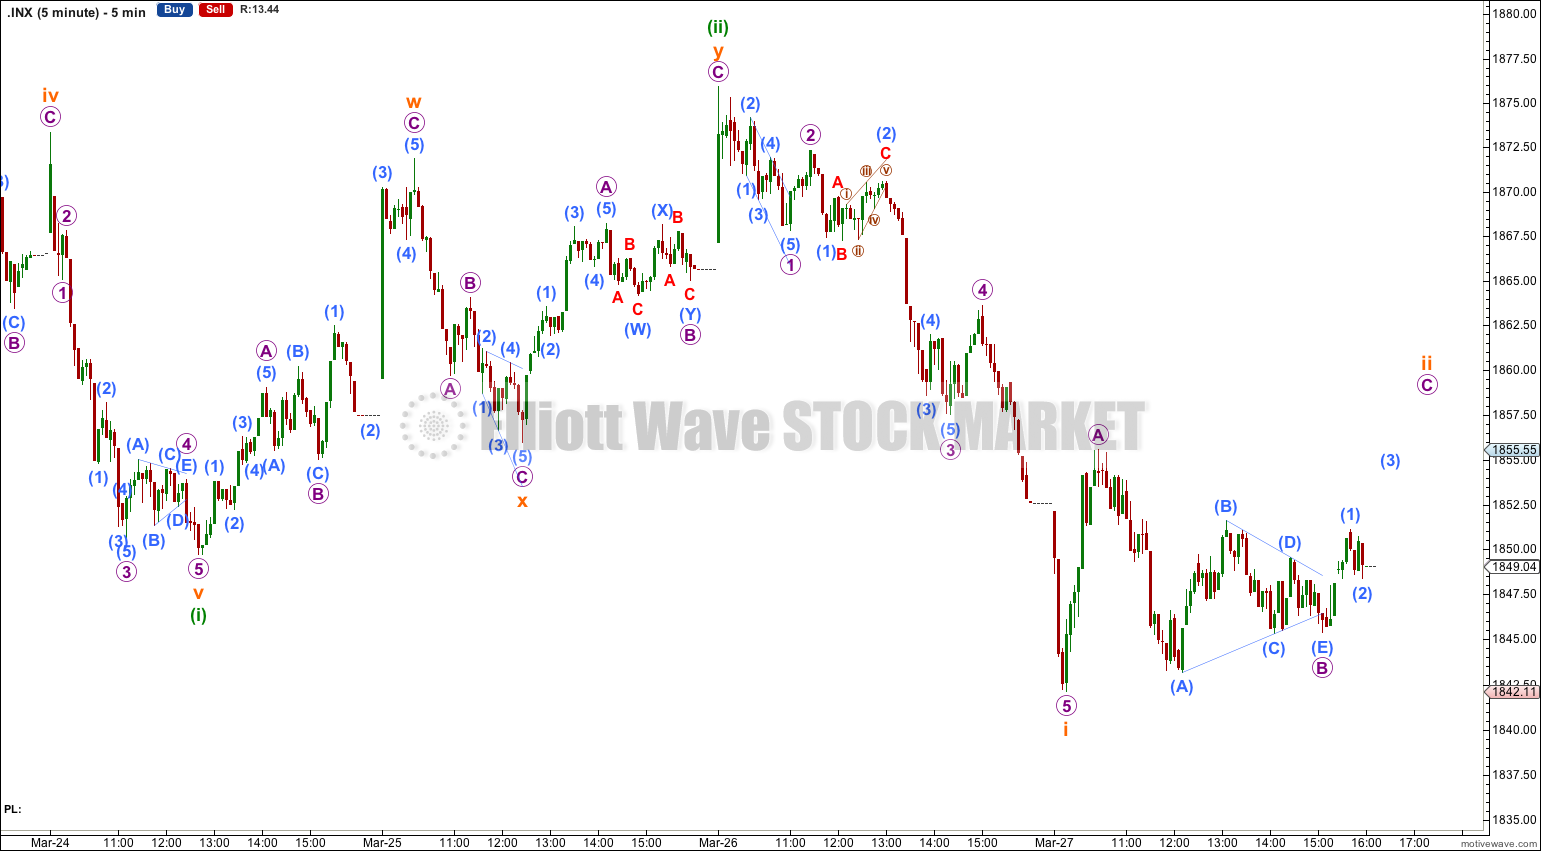
When markets open tomorrow I expect to see a little upwards movement to complete a zigzag for subminuette wave ii. At 1,859 micro wave C would reach equality in length with micro wave A.
When this small second wave correction is complete I expect to see a third wave within a third wave downwards. This should show a clear and strong increase in downwards momentum, and downwards movement should clearly breach the lower edge of the base channel drawn here about minuette waves (i) and (ii).
Subminuette wave ii may not move beyond the start of subminuette wave i. This wave count is invalidated with movement above 1,875.92.
Bearish Alternate Wave Count.
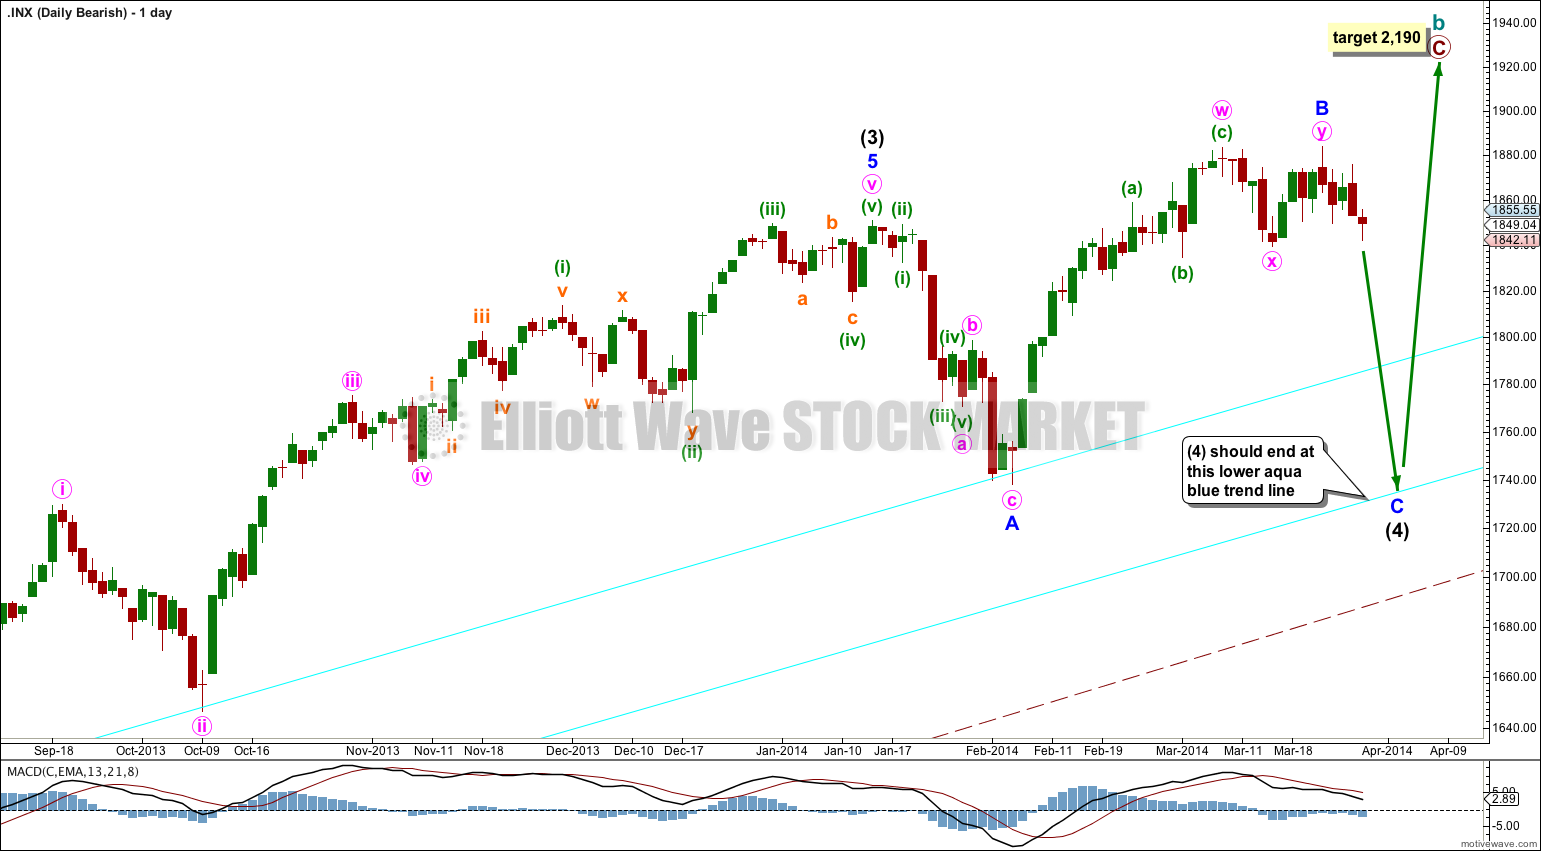
This bearish wave count expects that the correction was not over at 666.79, and that may have been just cycle wave a of a huge expanded flat for a super cycle wave II. Cycle wave b upwards is a close to complete zigzag.
Within flat corrections the maximum common length of B waves in relation to A waves is 138%. So far cycle wave b is a 141% correction of cycle wave a. For this reason only this wave count is an alternate.
Within primary wave C of the zigzag intermediate wave (4) would be incomplete.
The subdivisions for intermediate wave (4) would be the same as the main wave count for intermediate wave (2). I would expect it to end at the lower aqua blue trend line.
At 2,190 primary wave C would reach 1.618 the length of primary wave A. When intermediate wave (4) is complete I would recalculate this target at intermediate degree. I have found Fibonacci ratios between actionary waves (1, 3 and 5) of impulses are more reliable than between A and C waves within zigzags for the S&P500.
If intermediate wave (5) lasts about five to six months it may end about October this year.