
A slight new high changes the wave count, which was unexpected.
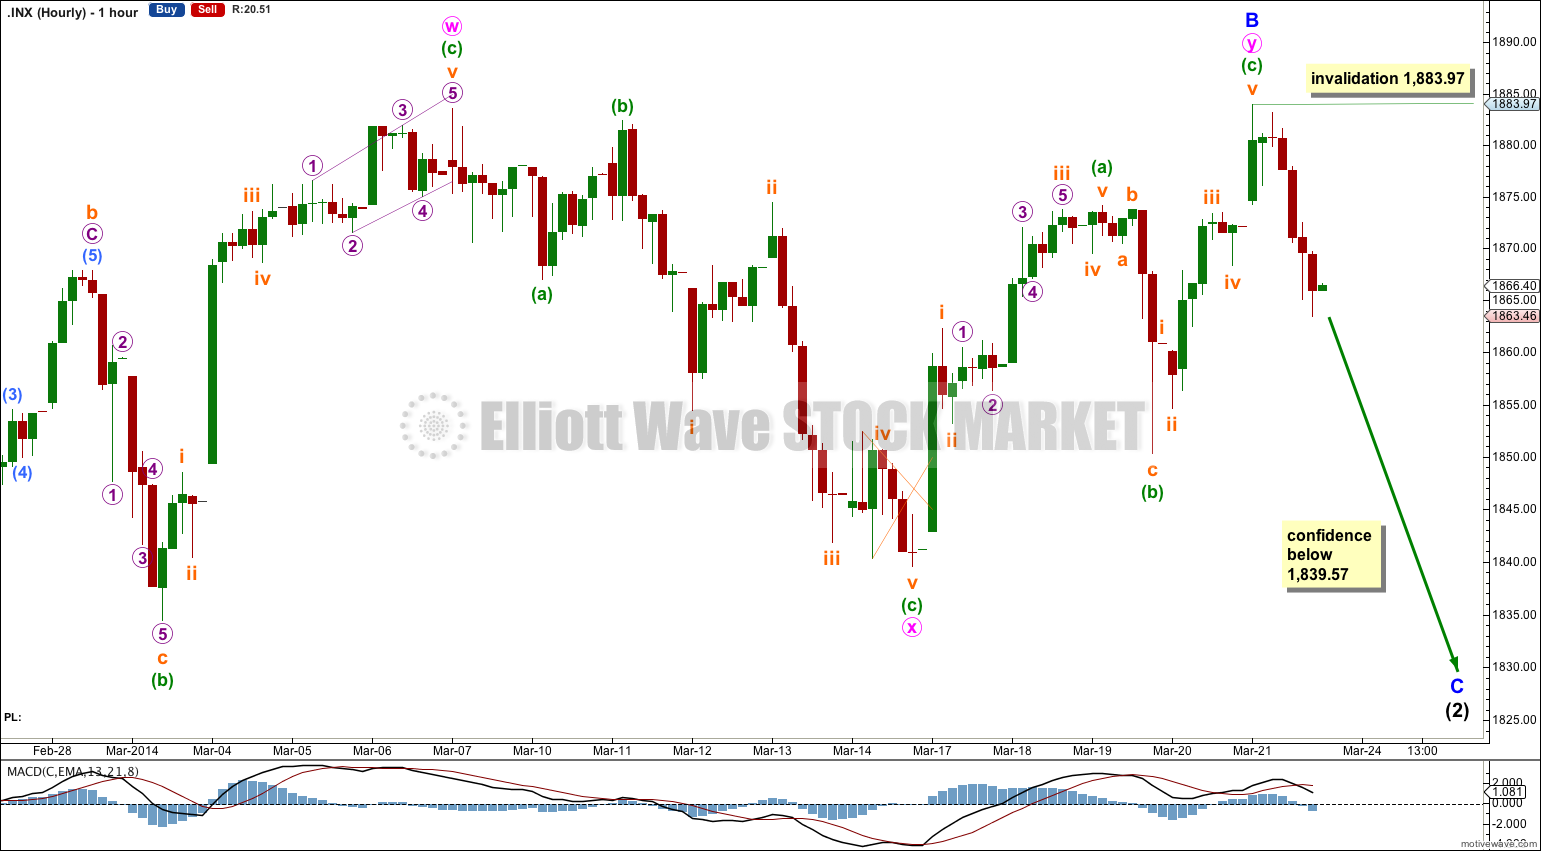
Summary: I still expect a five wave structure downwards to end at the lower of the two aqua blue trend lines. The new high is unconfirmed by the DJIA, DJT, and Nasdaq. Recent upwards movement is very choppy and overlapping. Movement below 1,839.57 next week would provide me with confidence in this trend change at minor degree.
This analysis is published about 04:30 p.m. EST. Click on charts to enlarge.
Bullish Wave Count.
The aqua blue trend lines are critical for all wave counts. Draw the first trend line from the low of 1,158.66 on 25th November, 2011 to the next swing low at 1,266.74 on 4th June, 2012. Create a parallel copy and place it on the low at 1,560.33 on 24th June, 2013. While price remains above the lower of these two aqua blue trend lines we must assume the trend remains upwards. This is the main reason for the bullish wave count being my main wave count.
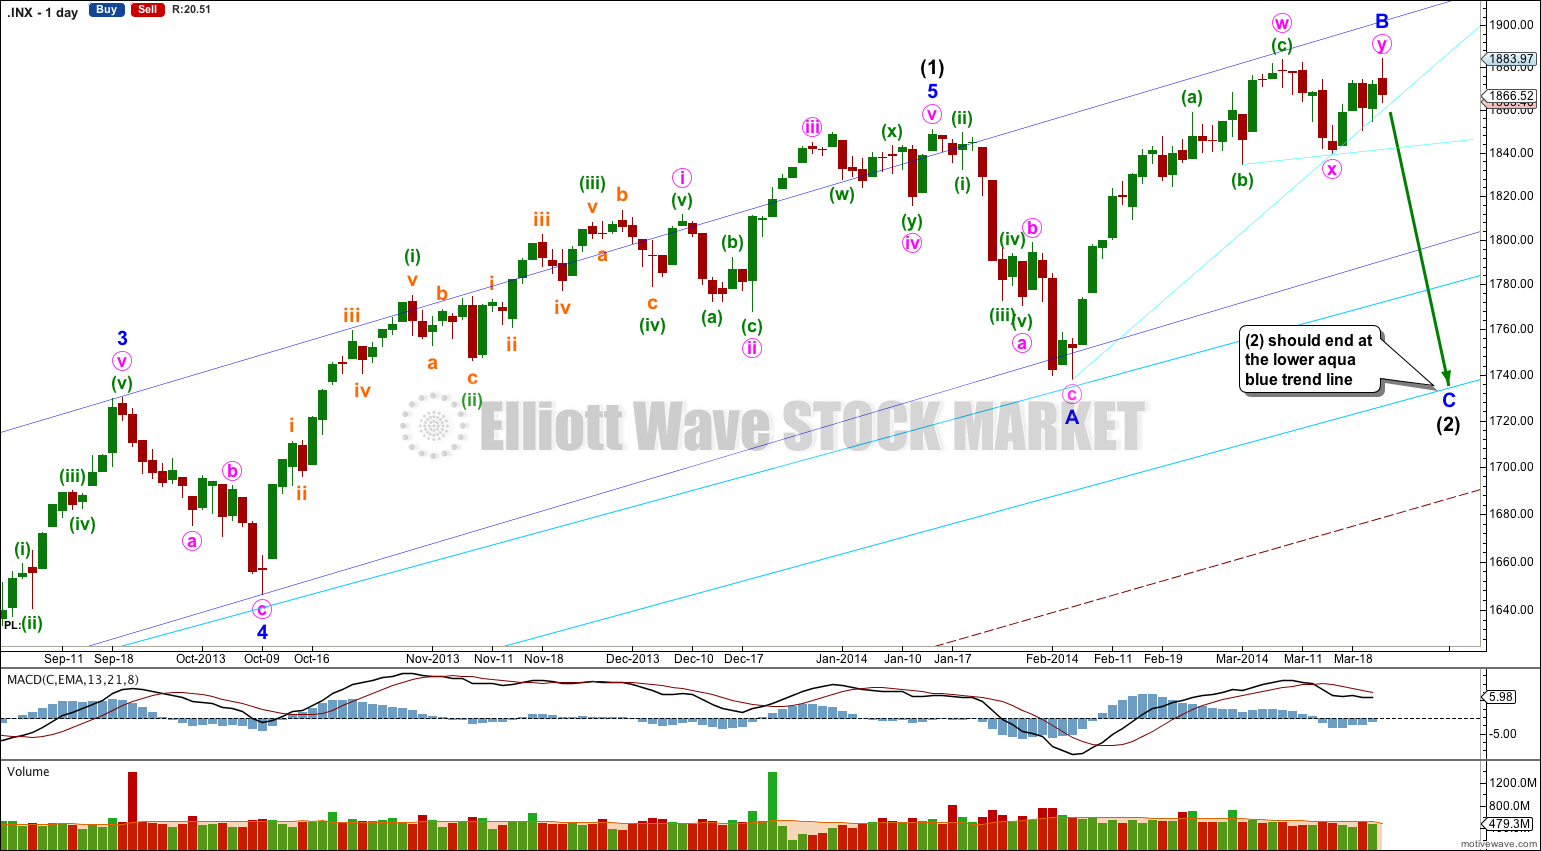
This bullish wave count expects a new bull market began at 666.79 for a cycle wave V. Within cycle wave V primary waves 1 and 2 are complete. Within primary wave 3 intermediate wave (1) is complete at 1,850.84. Intermediate wave (2) is continuing as an expanded flat correction.
Intermediate wave (2) should find strong support at the lower of the two aqua blue trend lines. Minor wave A lasted 14 days and minor wave B lasted 31 days. I would expect minor wave C to be of a similar duration and to last about three to four weeks in total.
For this bullish wave count when intermediate wave (2) is complete then very strong sustained upwards movement would be expected as an intermediate degree third wave within a primary degree third wave upwards unfolds.
As outlined in yesterday’s video and mentioned in yesterday’s text article, if a new high was made then I expect it was a continuation of minor wave B as a double zigzag. If minor wave B is over at 1,883.97 it is still 130% the length of minor wave A, nicely within the normal range of 100% to 138%.
Intermediate wave (2) is still most likely to be incomplete as it should breach the channel containing intermediate wave (1) (dark blue trend lines on the daily chart) and it should be longer in duration than just 14 days.
Minor wave C downwards must subdivide as a five wave motive structure, most likely an impulse. Within both an impulse and a diagonal the second wave may not move beyond the start of the first wave. This wave count is invalidated with movement above 1,883.97.
If price moves below 1,839.57 next week then downwards movement may not be a second wave correction within a new five wave structure upwards; at that stage I would have full confidence that intermediate wave (2) will continue lower to the aqua blue trend line.
Bearish Alternate Wave Count.
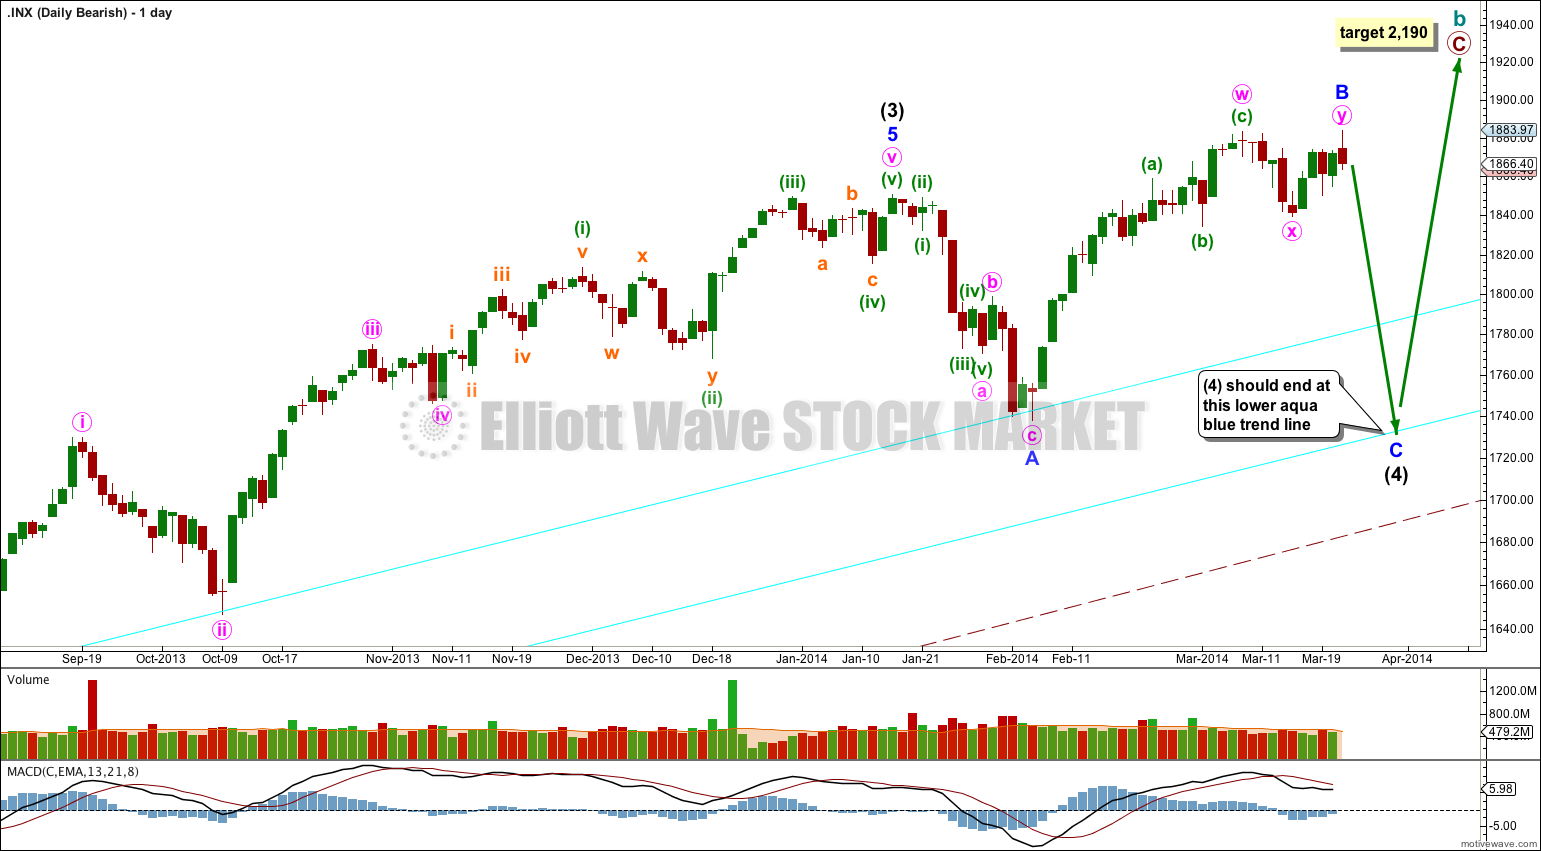
This bearish wave count expects that the correction was not over at 666.79, and that may have been just cycle wave a of a huge expanded flat for a super cycle wave II. Cycle wave b upwards is a close to complete zigzag.
Within flat corrections the maximum common length of B waves in relation to A waves is 138%. So far cycle wave b is a 141% correction of cycle wave a. For this reason only this wave count is an alternate.
Within primary wave C of the zigzag intermediate wave (4) would be incomplete.
The subdivisions for intermediate wave (4) would be the same as the main wave count for intermediate wave (2). I would expect it to end at the lower aqua blue trend line.
At 2,190 primary wave C would reach 1.618 the length of primary wave A. When intermediate wave (4) is complete I would recalculate this target at intermediate degree. I have found Fibonacci ratios between actionary waves (1, 3 and 5) of impulses are more reliable than between A and C waves within zigzags for the S&P500.
If intermediate wave (5) lasts about five to six months it may end about October this year.