
Last analysis expected downwards movement for Monday towards 1,817 to 1,812. This is not what happened as price moved higher. However, upwards movement remains below the invalidation point.
The wave count remains mostly the same.
Summary: The trend remains down at minor degree. The short term target for Tuesday / Wednesday is at 1,818.
This analysis is published about 9:15 p.m. EST. Click on charts to enlarge.
Bullish Wave Count.
The aqua blue trend lines are critical for all wave counts. Draw the first trend line from the low of 1,158.66 on 25th November, 2011 to the next swing low at 1,266.74 on 4th June, 2012. Create a parallel copy and place it on the low at 1,560.33 on 24th June, 2013. While price remains above the lower of these two aqua blue trend lines we must assume the trend remains upwards. This is the main reason for the bullish wave count being my main wave count.
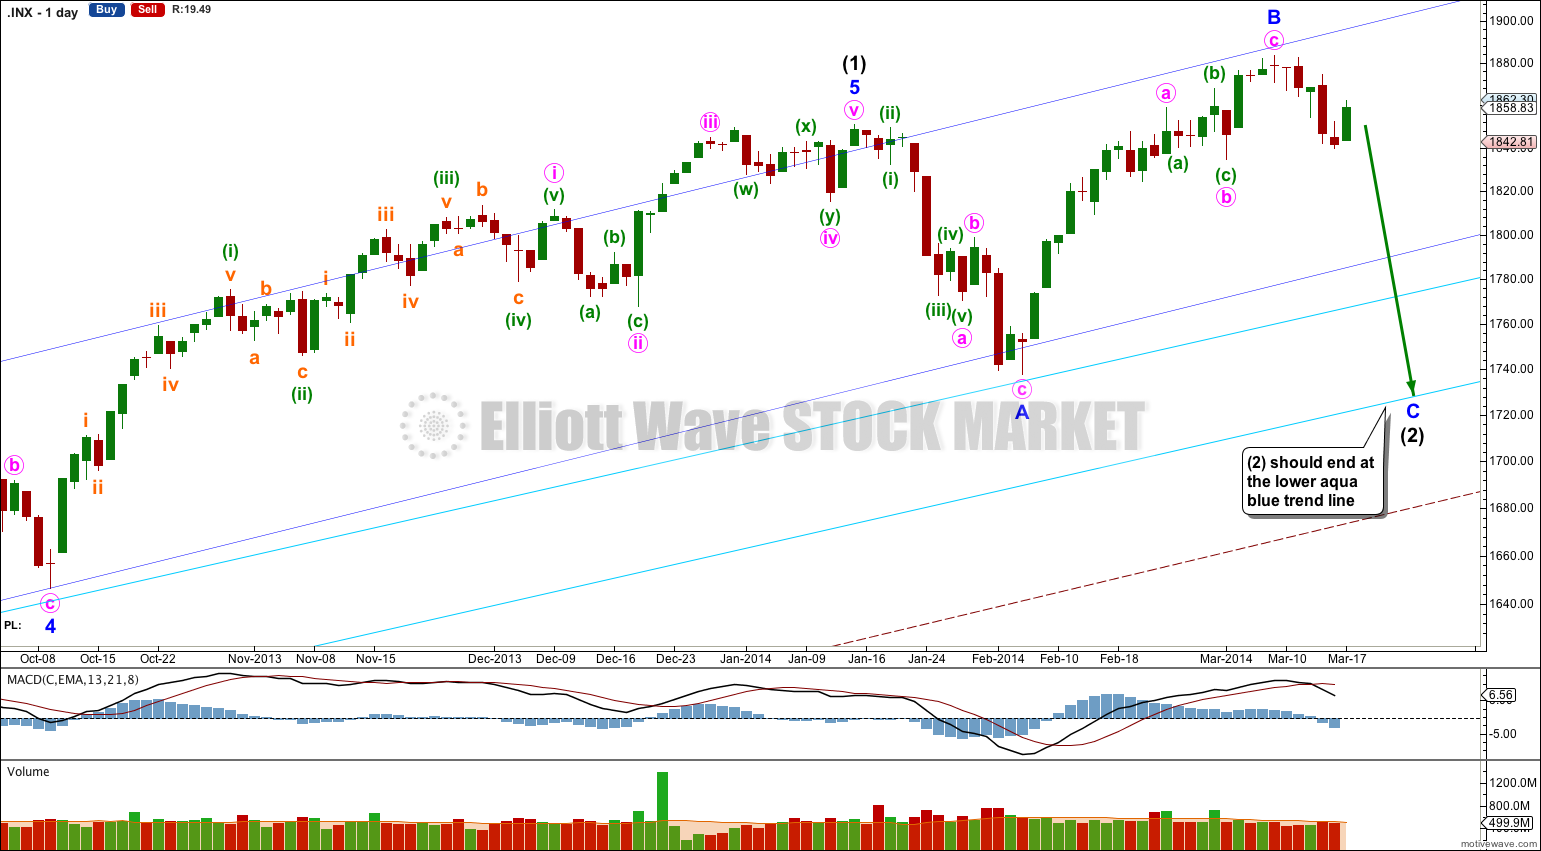
This bullish wave count expects a new bull market began at 666.79 for a cycle wave V. Within cycle wave V primary waves 1 and 2 are complete. Within primary wave 3 intermediate wave (1) is complete at 1,850.84. Intermediate wave (2) is continuing as an expanded flat correction.
Intermediate wave (2) should find strong support at the lower of the two aqua blue trend lines. Minor wave A lasted 14 days and minor wave B lasted a Fibonacci 21 days. I would expect minor wave C to be of a similar duration and to last about three to four weeks in total.
For this bullish wave count when intermediate wave (2) is complete then very strong sustained upwards movement would be expected as an intermediate degree third wave within a primary degree third wave upwards unfolds.
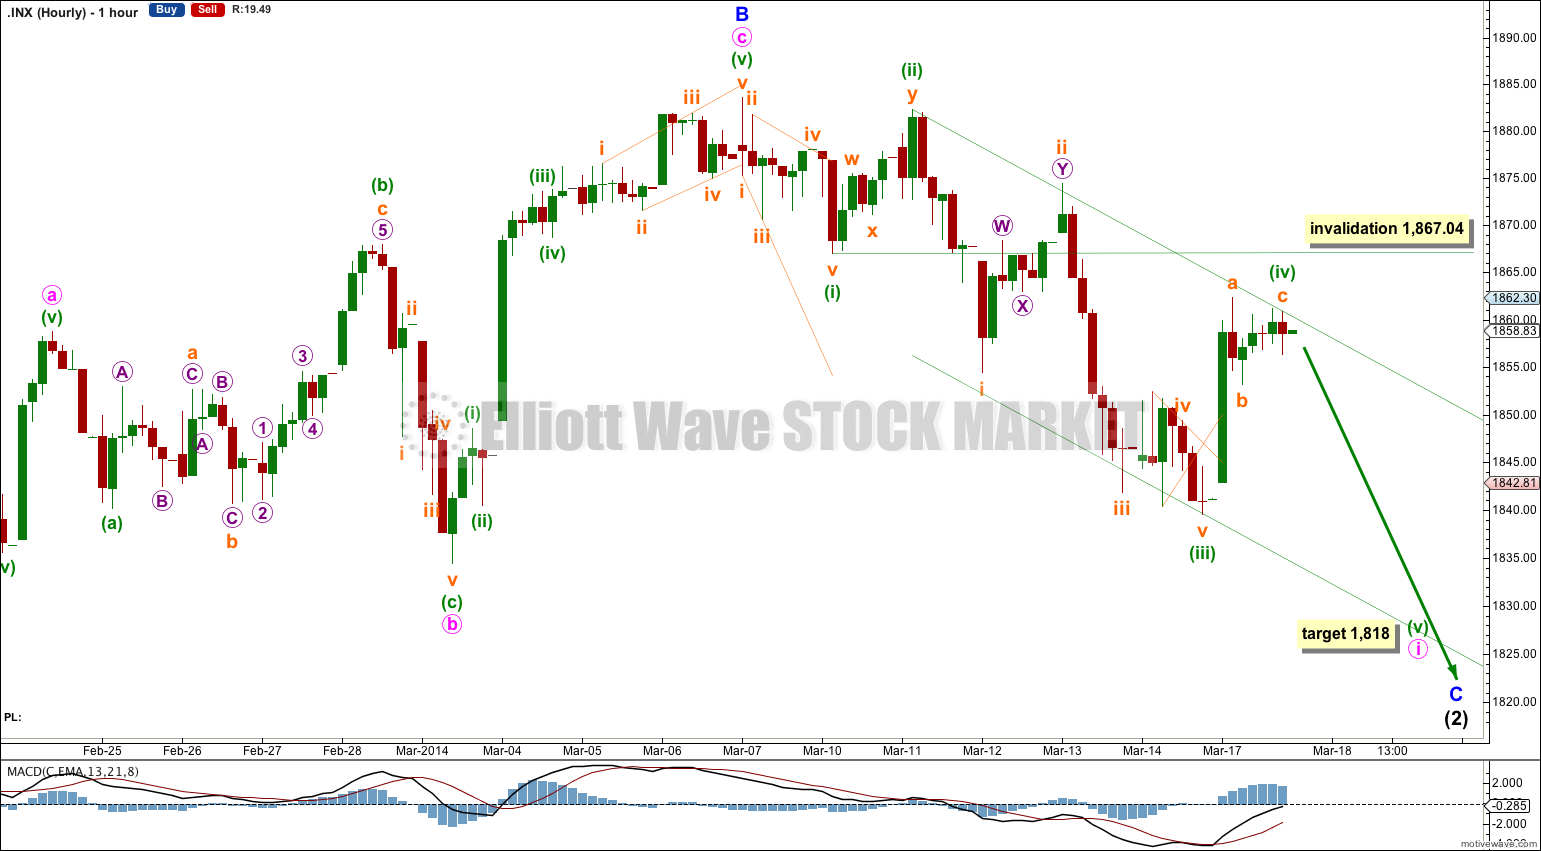
So far there is not a complete five down on the hourly chart. If there is a new low below 1,839.57 tomorrow or the day after I would have increased confidence in this wave count.
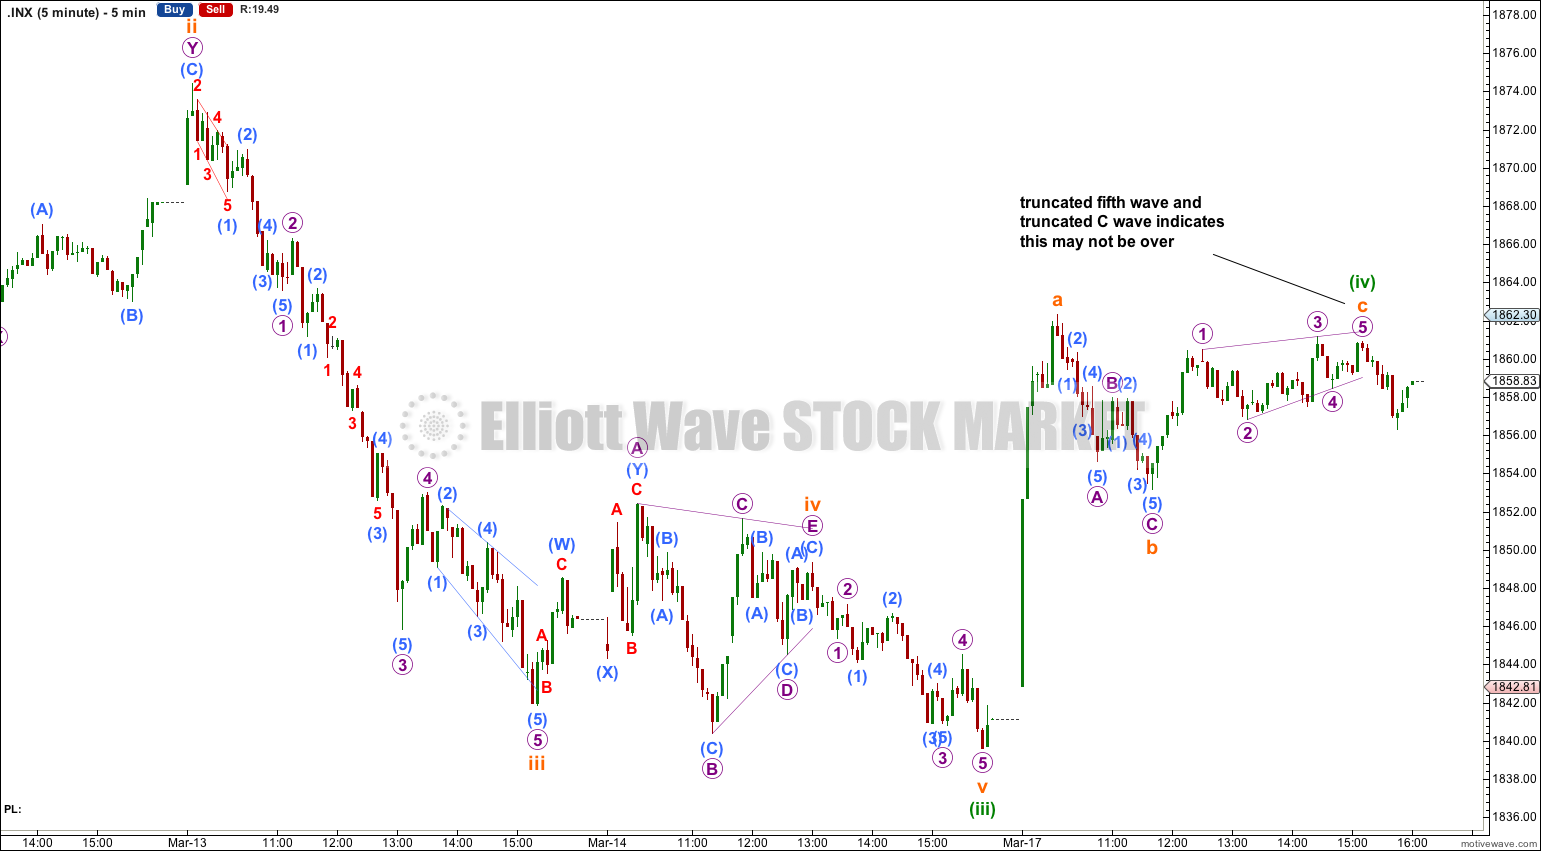
Again, my last analysis of the five minute chart was wrong. Minuette wave (iii) was already over. It is just 0.50 points short of 2.618 the length of minuette wave (i).
Ratios within minuette wave (iii) are: subminuette wave iii has no Fibonacci ratio to subminuette wave i, and subminuette wave v is 0.89 points short of 0.382 the length of subminuette wave i.
At 1,818 minuette wave (v) would reach equality in length with minuette wave (iii).
Depending on the length of the next wave down I may consider moving the labeling within this movement all up one degree.
I would expect minuette wave (v) to end about the mid line of this channel, or to find support at the lower edge.
At this stage I am not certain that minuette wave (iv) is over. It may move higher. If it does it may not move into minuette wave (i) price territory above 1,867.04.
Bearish Alternate Wave Count.
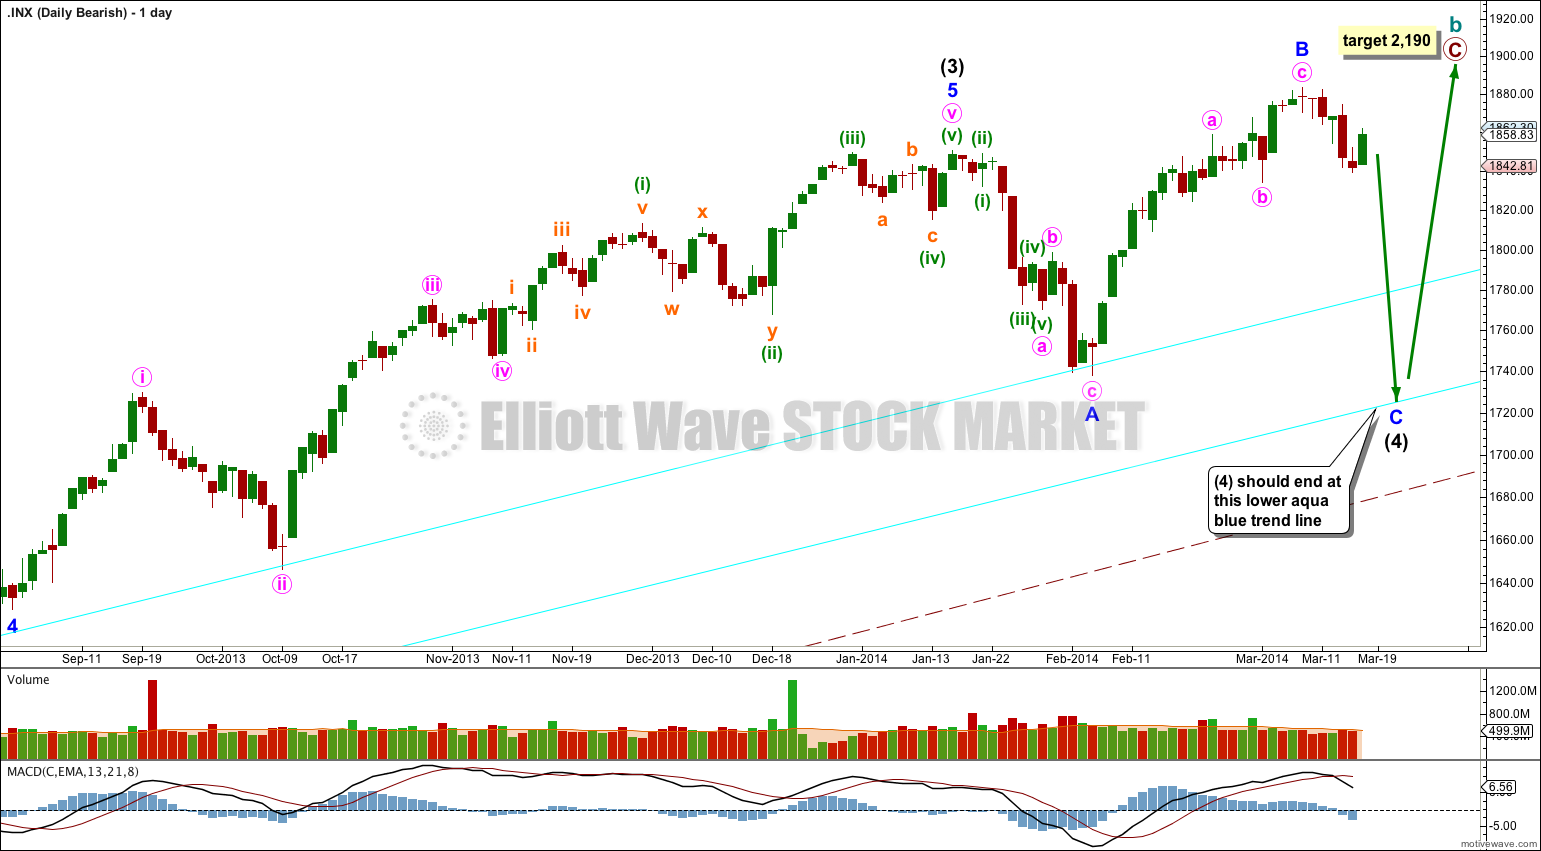
This bearish wave count expects that the correction was not over at 666.79, and that may have been just cycle wave a of a huge expanded flat for a super cycle wave II. Cycle wave b upwards is a close to complete zigzag.
Within flat corrections the maximum common length of B waves in relation to A waves is 138%. So far cycle wave b is a 141% correction of cycle wave a. For this reason only this wave count is an alternate.
Within primary wave C of the zigzag intermediate wave (4) would be incomplete.
The subdivisions for intermediate wave (4) would be the same as the main wave count for intermediate wave (2). I would expect it to end at the lower aqua blue trend line.
At 2,190 primary wave C would reach 1.618 the length of primary wave A. When intermediate wave (4) is complete I would recalculate this target at intermediate degree. I have found Fibonacci ratios between actionary waves (1, 3 and 5) of impulses are more reliable than between A and C waves within zigzags for the S&P500.
If intermediate wave (5) lasts about five to six months it may end about October this year.