
Downwards movement was expected.
When the channel on the daily chart about the last upwards wave is clearly breached we shall have confirmation of this trend change. While price remains within that channel we must accept the alternate is possible, although it has a very low probability.
The wave count remains the same.
Summary: I expect more downwards movement tomorrow with some increase in downwards momentum. If tomorrow produces a candlestick below the pink channel on the daily chart we shall have confirmation that the minor degree trend is down.
This analysis is published about 6:30 p.m. EST. Click on charts to enlarge.
Bullish Wave Count.
The aqua blue trend lines are critical for all wave counts. Draw the first trend line from the low of 1,158.66 on 25th November, 2011 to the next swing low at 1,266.74 on 4th June, 2012. Create a parallel copy and place it on the low at 1,560.33 on 24th June, 2013. While price remains above the lower of these two aqua blue trend lines we must assume the trend remains upwards. This is the main reason for the bullish wave count being my main wave count.
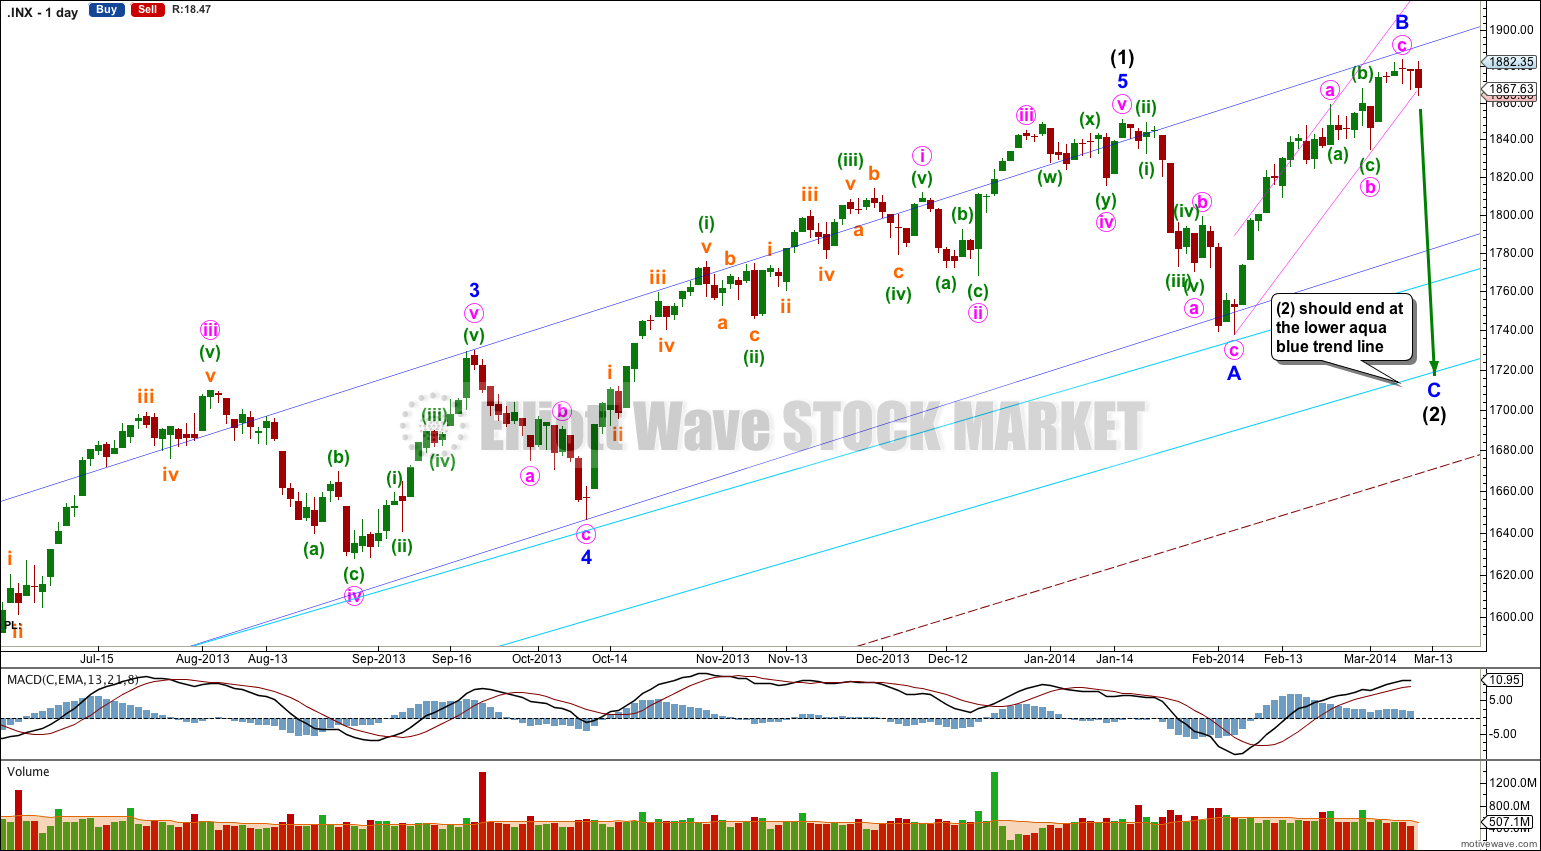
This bullish wave count expects a new bull market began at 666.79 for a cycle wave V. Within cycle wave V primary waves 1 and 2 are complete. Within primary wave 3 intermediate wave (1) is complete at 1,850.84. Intermediate wave (2) is most likely continuing as an expanded flat correction.
Intermediate wave (2) should find strong support at the lower of the two aqua blue trend lines. Minor wave A lasted 14 days and minor wave B lasted a Fibonacci 21 days. I would expect minor wave C to be of a similar duration and to last about three to four weeks in total.
For this bullish wave count when intermediate wave (2) is complete then very strong sustained upwards movement would be expected as an intermediate degree third wave within a primary degree third wave upwards unfolds.
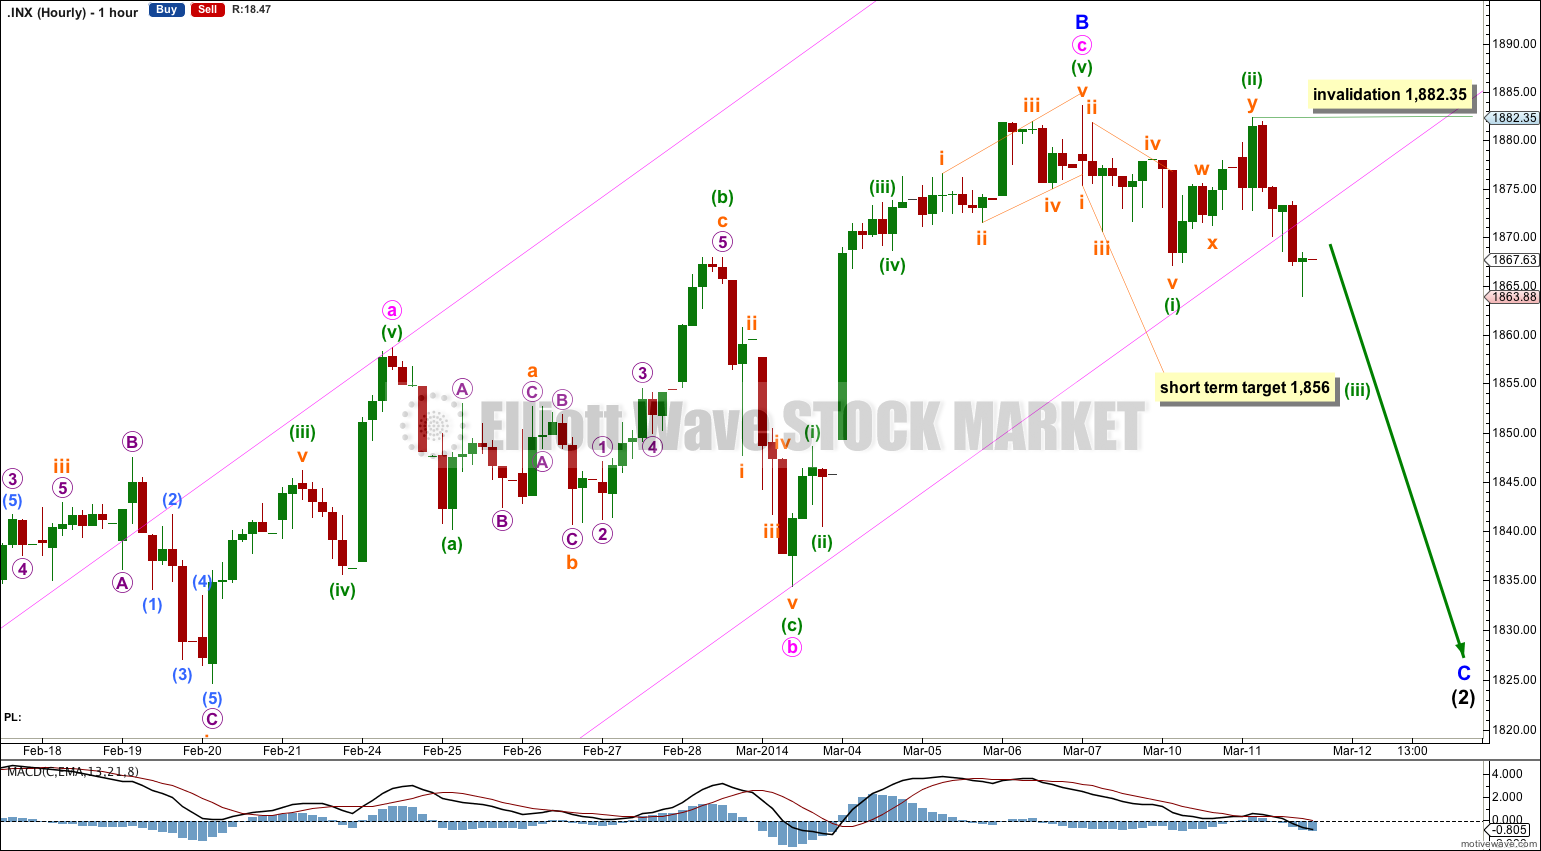
There is now a channel breach of the channel containing minor wave B on the hourly chart. This is first indication of a minor degree trend change. When this channel is clearly breached on the daily chart we shall have confirmation.
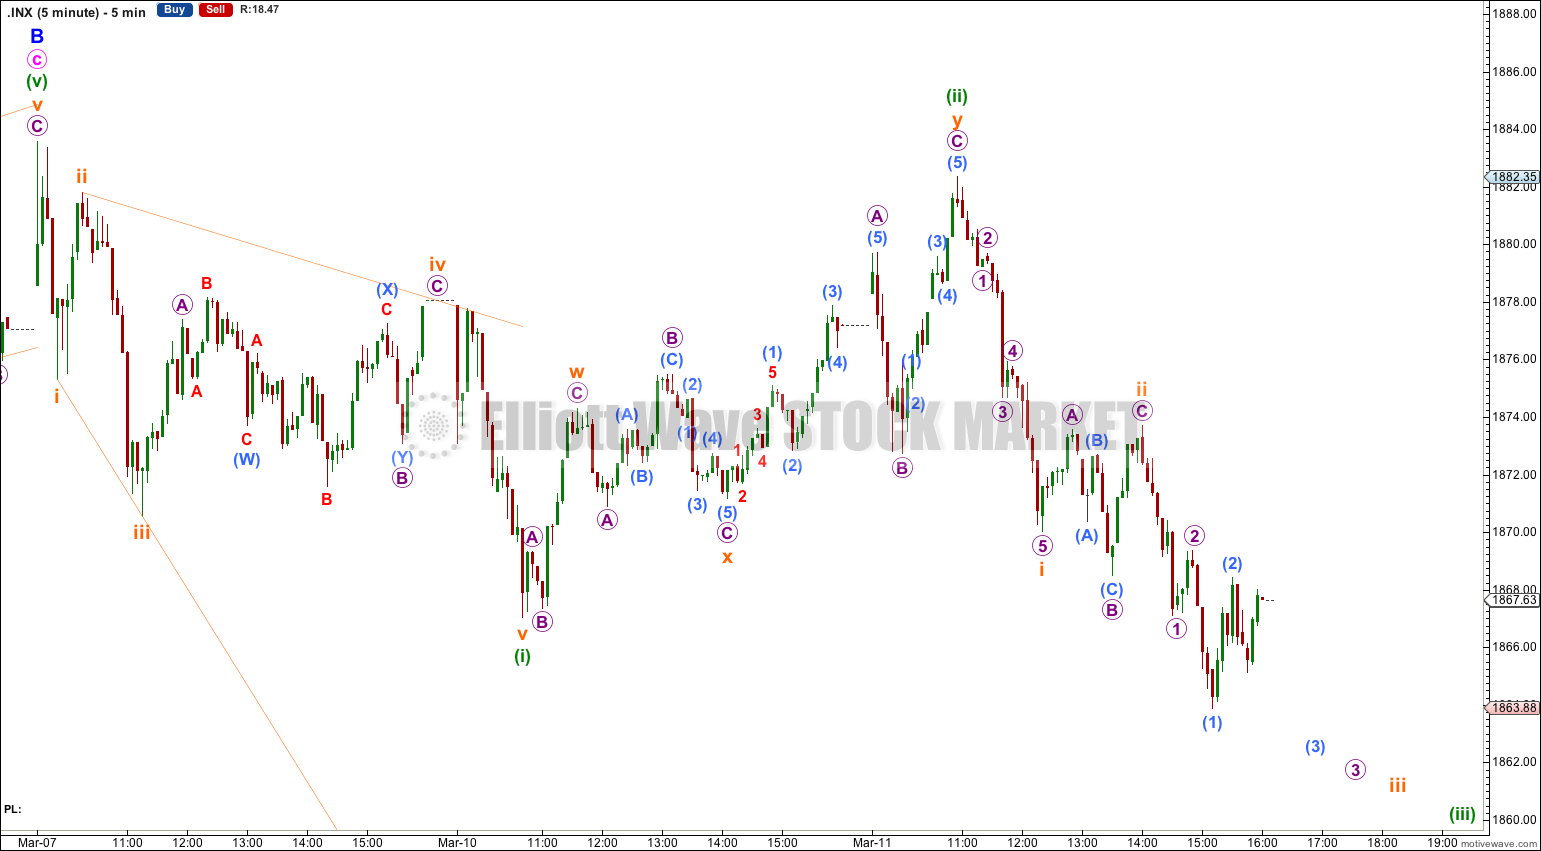
Within the new downwards movement the first wave down was a leading expanding diagonal followed by a typically deep second wave. At 1,856 minuette wave (iii) would reach 1.618 the length of minuette wave (i). This short term target may be met within one to two days.
Within minuette wave (iii) no second wave correction may move beyond its start. This wave count is invalidated with movement above 1,882.35.
Alternate Bullish Wave Count.
I do not have confidence in this wave count. I publish it only due to insistence from members that it may be possible. I agree, all things are possible, but this possibility looks very unlikely.
If the pink channel on the main wave count daily chart is breached tomorrow I will discard this alternate.
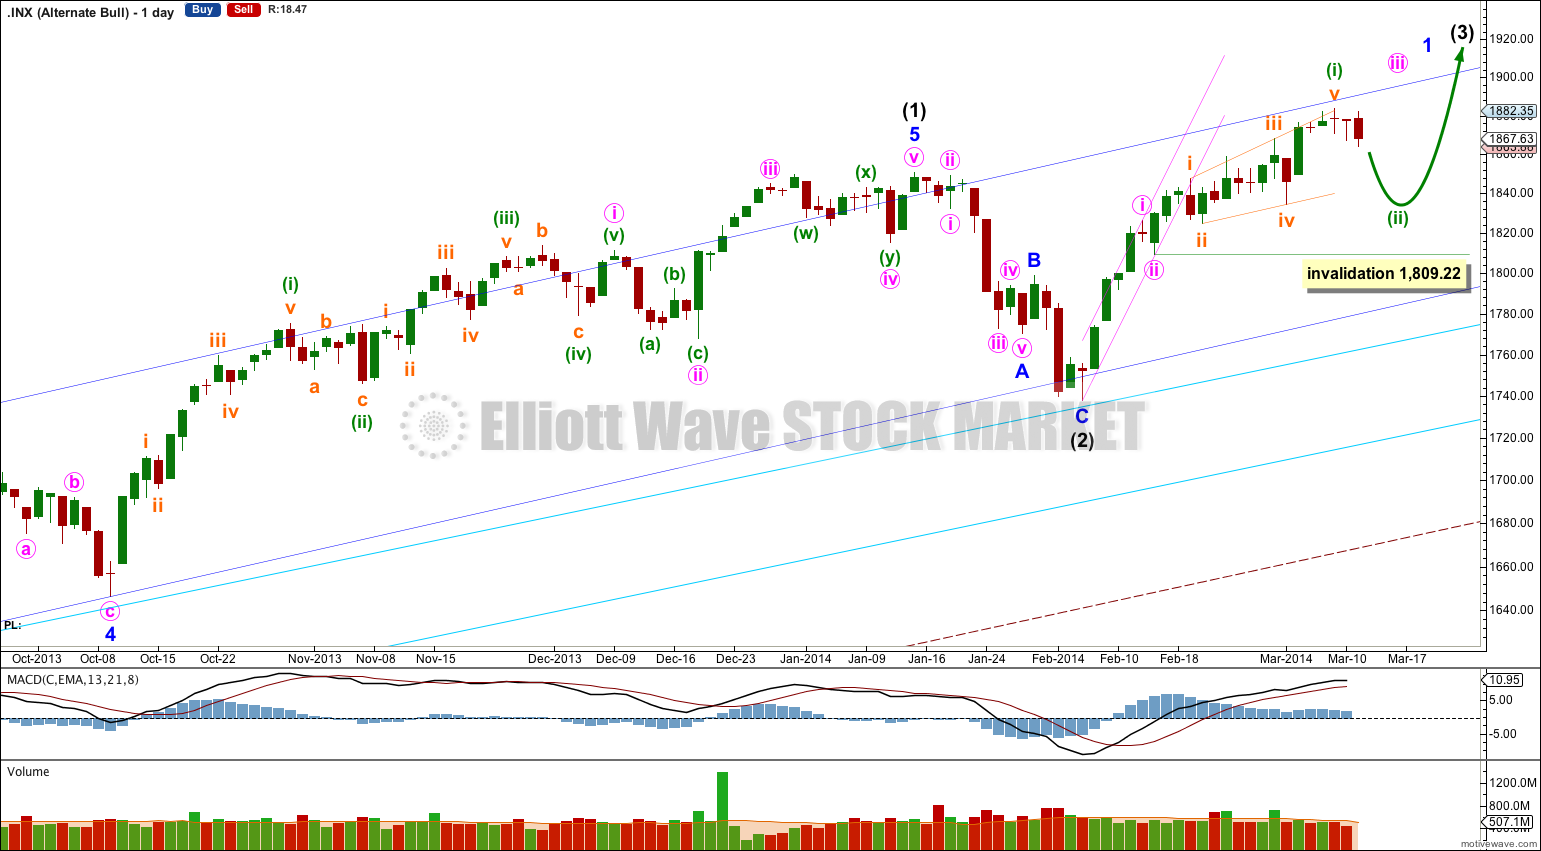
This wave count reverts to the idea that intermediate wave (2) may be over. However, if it is over there it would have been a remarkably brief correction for intermediate degree and it would not have breached the channel which contains intermediate wave (1). For these two reasons this wave count has a lower probability and is an alternate.
If intermediate wave (3) has begun then within it minor wave 1 is unlikely to be complete.
Within minor wave 1 minute wave i may be a complete impulse, minute wave ii a complete brief zigzag, and minute wave iii may have just begun with a leading expanding diagonal.
The pink upwards sloping channel about minute waves i and ii is a base channel. If a third wave upwards is following that first and second wave then it should clearly and strongly breach the upper edge of that channel and should find support at the lower edge. The strong and persistent breach of the lower edge of this base channel significantly reduces the probability of this wave count. It has a strange look.
Minuette wave (ii) may not move beyond the start of minuette wave (i). This wave count is invalidated with movement below 1,809.22.
Bearish Alternate Wave Count.
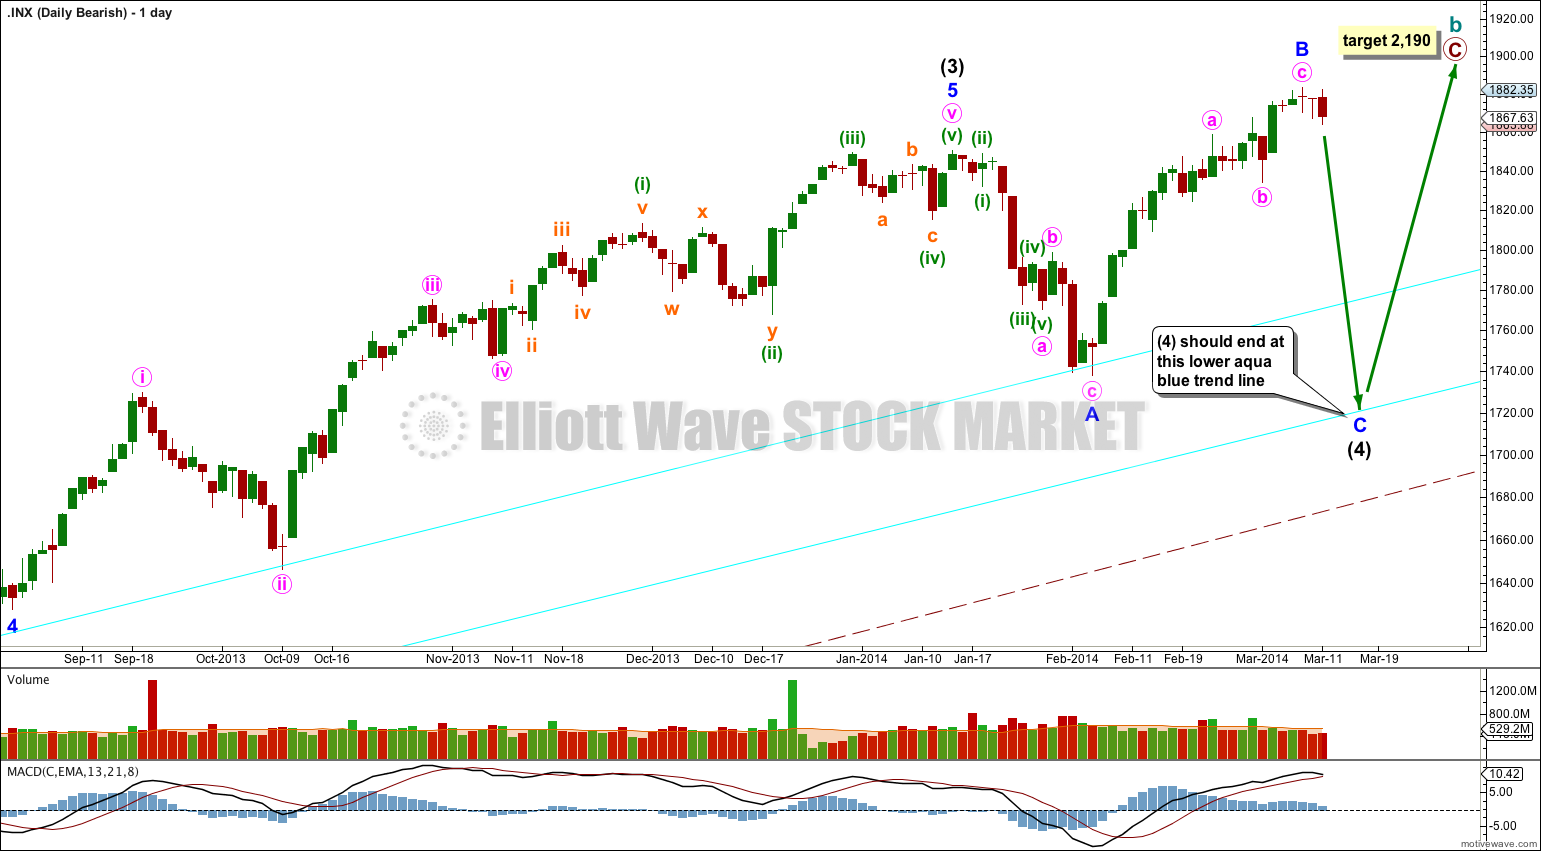
This bearish wave count expects that the correction was not over at 666.79, and that may have been just cycle wave a of a huge expanded flat for a super cycle wave II. Cycle wave b upwards is a close to complete zigzag.
Within flat corrections the maximum common length of B waves in relation to A waves is 138%. So far cycle wave b is a 141% correction of cycle wave a. For this reason only this wave count is an alternate.
Within primary wave C of the zigzag intermediate wave (4) would be incomplete.
The subdivisions for intermediate wave (4) would be the same as the main wave count for intermediate wave (2). I would expect it to end at the lower aqua blue trend line.
At 2,190 primary wave C would reach 1.618 the length of primary wave A. When intermediate wave (4) is complete I would recalculate this target at intermediate degree. I have found Fibonacci ratios between actionary waves (1, 3 and 5) of impulses are more reliable than between A and C waves within zigzags for the S&P500.
If intermediate wave (5) lasts about five to six months it may end about October this year.
what if this was the end of minute wave [ii] of minor wave 3 of intermediate wave (5) of primary wave 3 today? can you see that being correct? if so, new highs are coming next.
I’m not sure if such counting is ok with Elliott principles.
I’ve never seen expanding diagonals which worked. Overlapping etc and even diagonals are very very rare patterns.
New highs ahead.
I disagree. I’ve seen plenty of diagonals, they’re not rare. This wave count meets all rules of EW for diagonals.
It’s amazing that some people don’t understand the simple beauty of this wave count. For her/his sake, I hope Tramp isn’t long the market over the next few days.