
A new high was unexpected and has invalidated the hourly wave counts. I have a new wave count for you today.
Summary: The situation is unclear but in the bigger picture I favour the idea that we should see overall downwards movement for about three weeks. Downwards movement should find support at the lower of the two aqua blue trend lines on the daily charts.
This analysis is published about 7:45 p.m. EST. Click on charts to enlarge.
Bullish Wave Count.
The aqua blue trend lines are critical for all wave counts. Draw the first trend line from the low of 1,158.66 on 25th November, 2011 to the next swing low at 1,266.74 on 4th June, 2012. Create a parallel copy and place it on the low at 1,560.33 on 24th June, 2013. While price remains above the lower of these two aqua blue trend lines we must assume the trend remains upwards. This is the main reason for the bullish wave count being my main wave count.
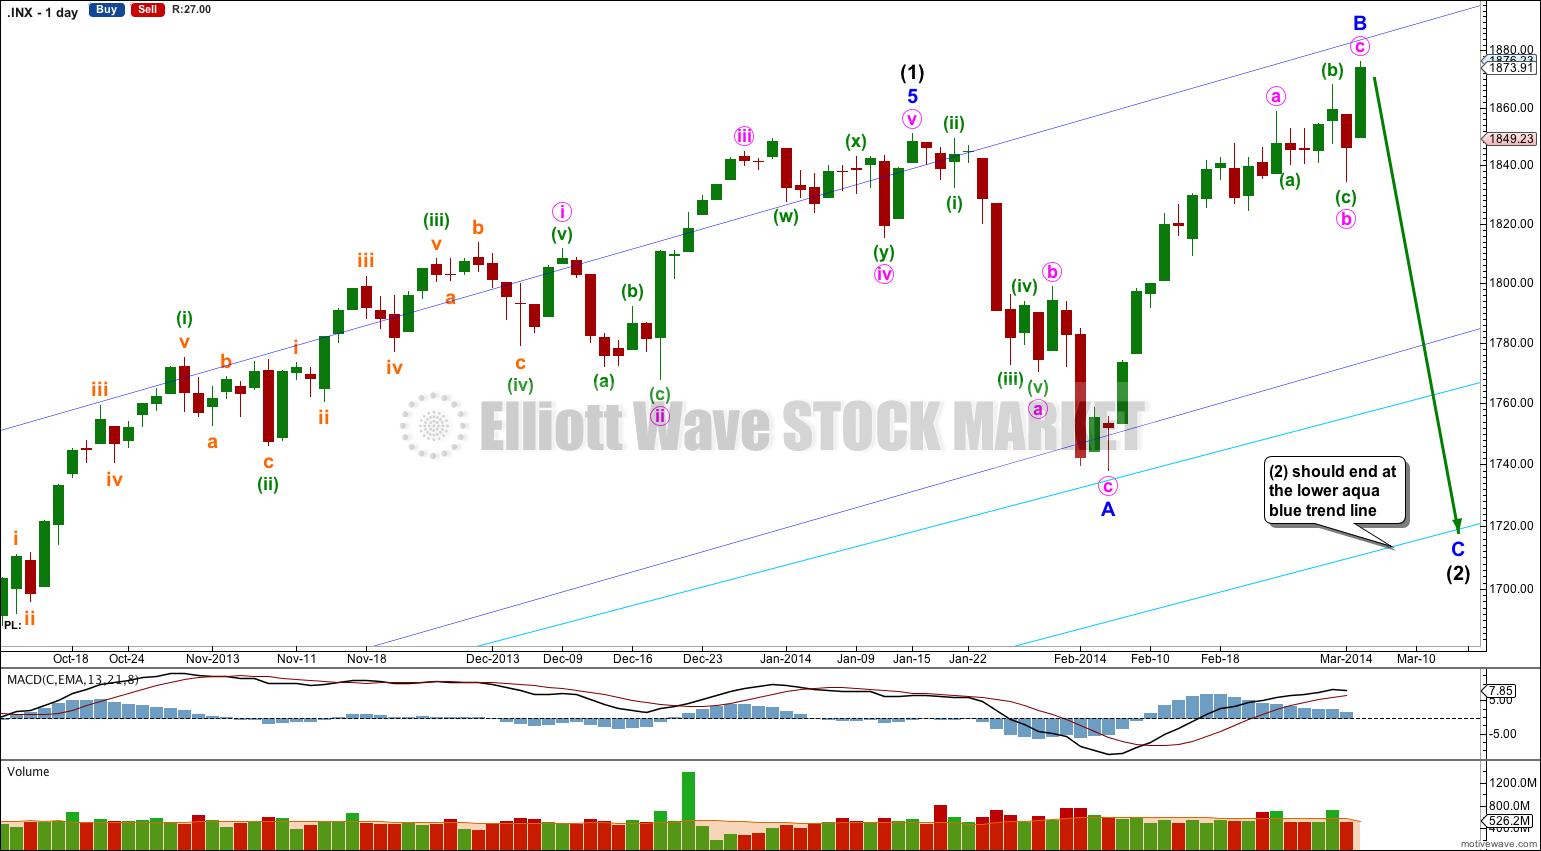
This bullish wave count expects a new bull market began at 666.79 for a cycle wave V. Within cycle wave V primary waves 1 and 2 are complete. Within primary wave 3 intermediate wave (1) is complete at 1,850.84. Intermediate wave (2) is most likely continuing as an expanded flat correction.
Intermediate wave (2) should find strong support at the lower of the two aqua blue trend lines. Minor wave A lasted 14 days and minor wave B lasted 16 days. I would expect minor wave C to be of a similar duration and to last about three weeks in total.
For this bullish wave count when intermediate wave (2) is complete then very strong sustained upwards movement would be expected as an intermediate degree third wave within a primary degree third wave upwards unfolds.
Minor wave B is now a 122% correction of minor wave A. Minor wave C should find support at the lower of the two aqua blue trend lines.
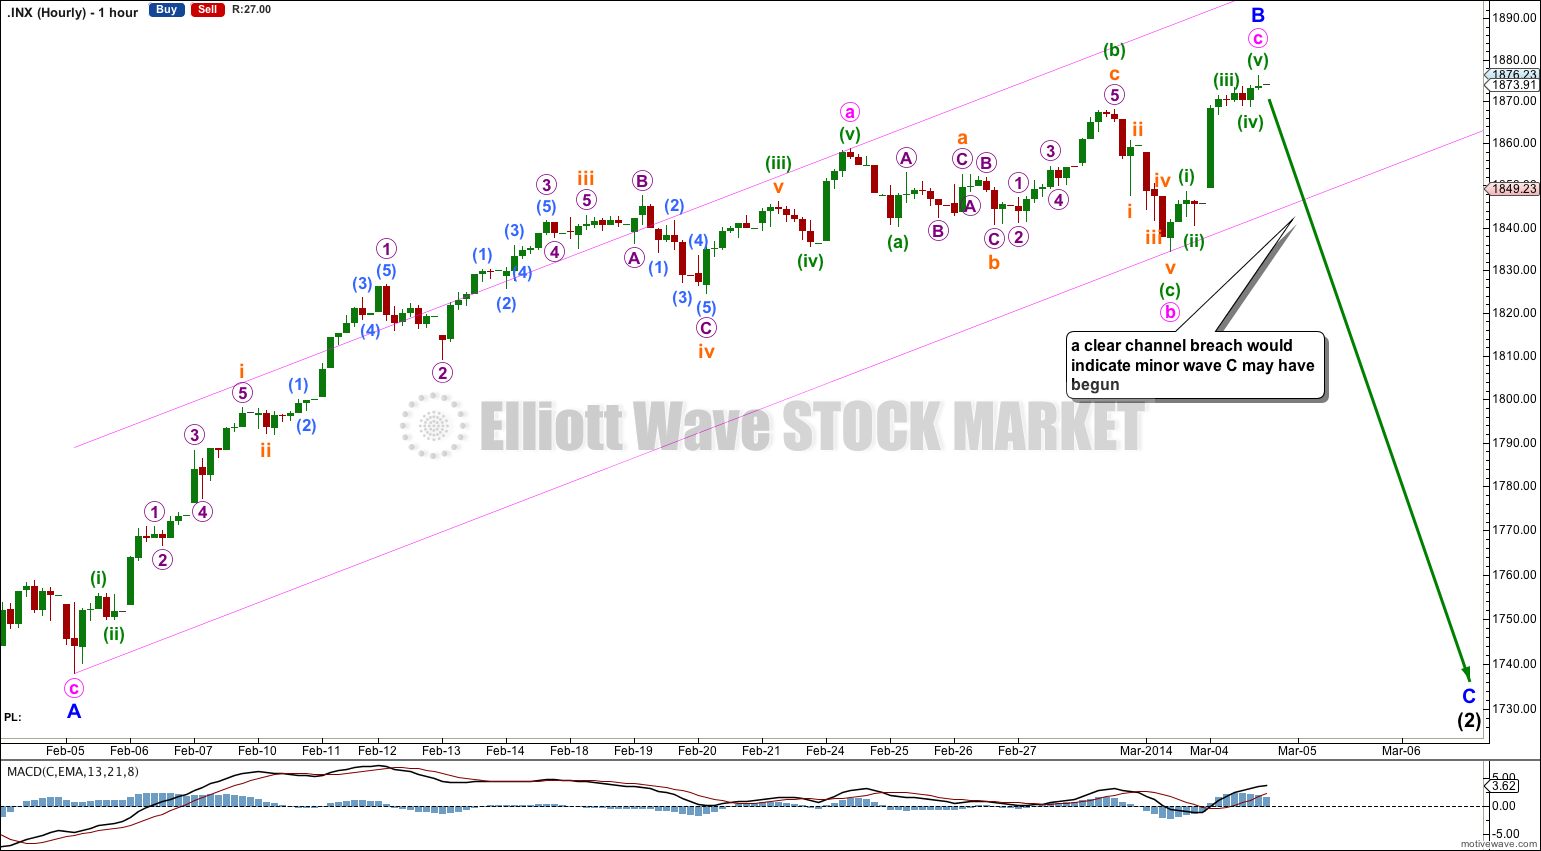
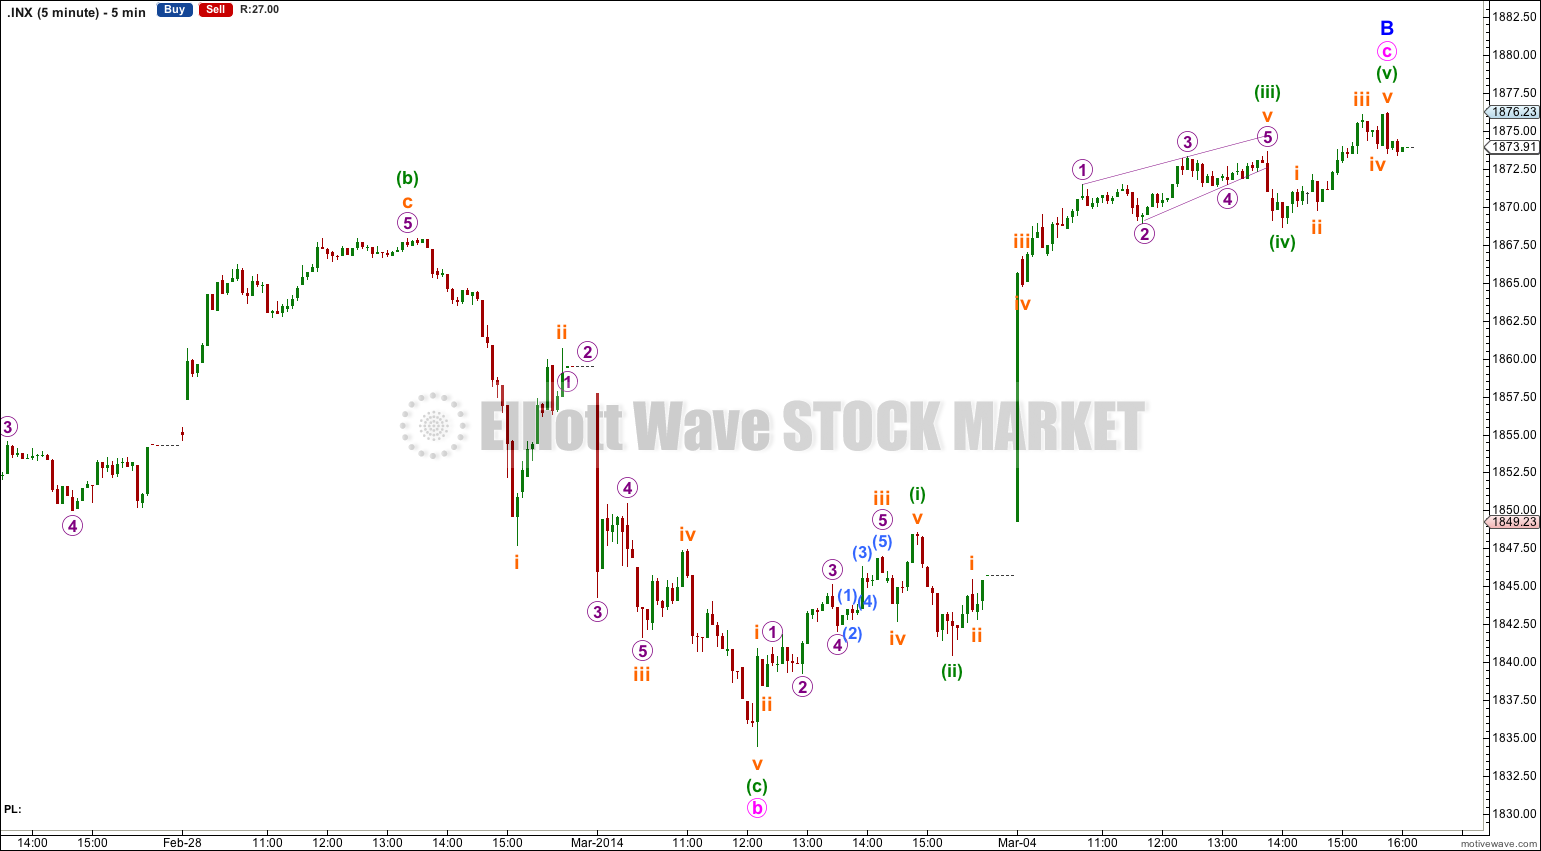
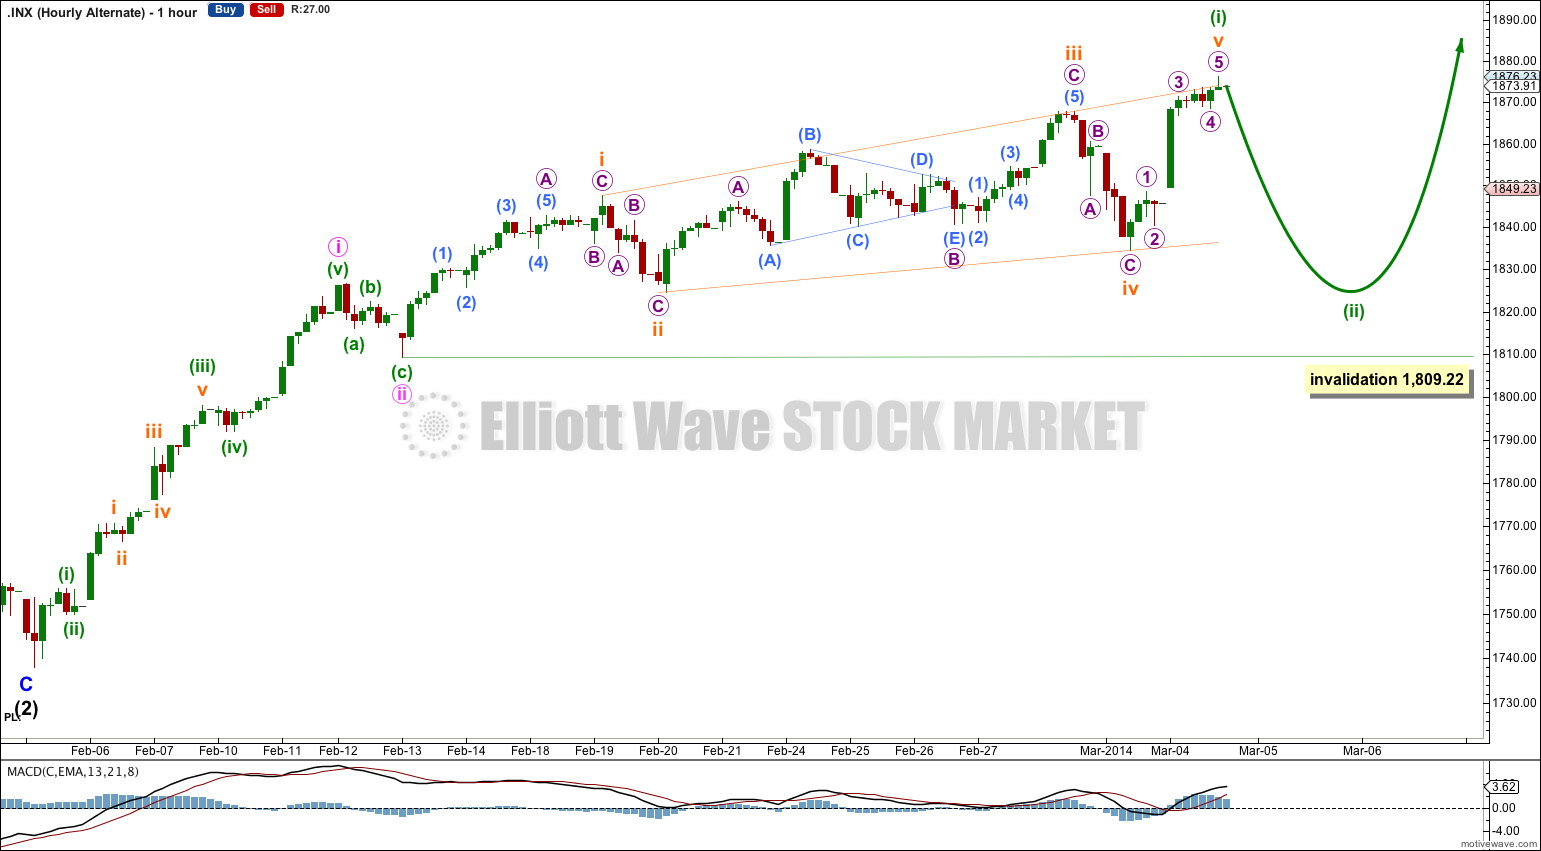
Upwards movement for Tuesday’s session may have been the final upwards wave for minor wave B if minute wave b within it is seen as an expanded flat correction. On the five minute chart this wave count has the best fit.
Within minor wave B there is no adequate Fibonacci ratio between minute waves a and c.
Within the expanded flat of minute wave b minuette wave (b) is a 150% correction of minuette wave (a), and there is no adequate Fibonacci ratio between minuette waves (a) and (c).
The upwards wave for Tuesday’s session subdivides perfectly as a five wave impulse, and this is what it looks like on the hourly and five minute charts. I expect this is what it is. It is most likely minute wave c in its entirety, but it could also be only minuette wave (i) within minute wave c. Only a new low below its start at 1,834.44 would eliminate the possibility that it will continue.
I have used Elliott’s channeling technique about this correction. When we have a clear breach of this channel then we may again have an indication that minor wave B could be over and minor wave C downwards may have begun.
There is not enough downwards movement at the end of Tuesday’s session to indicate that minuette wave (v) will not continue higher. Therefore, there is no upwards invalidation point for this wave count today.
Alternate Bullish Wave Count.
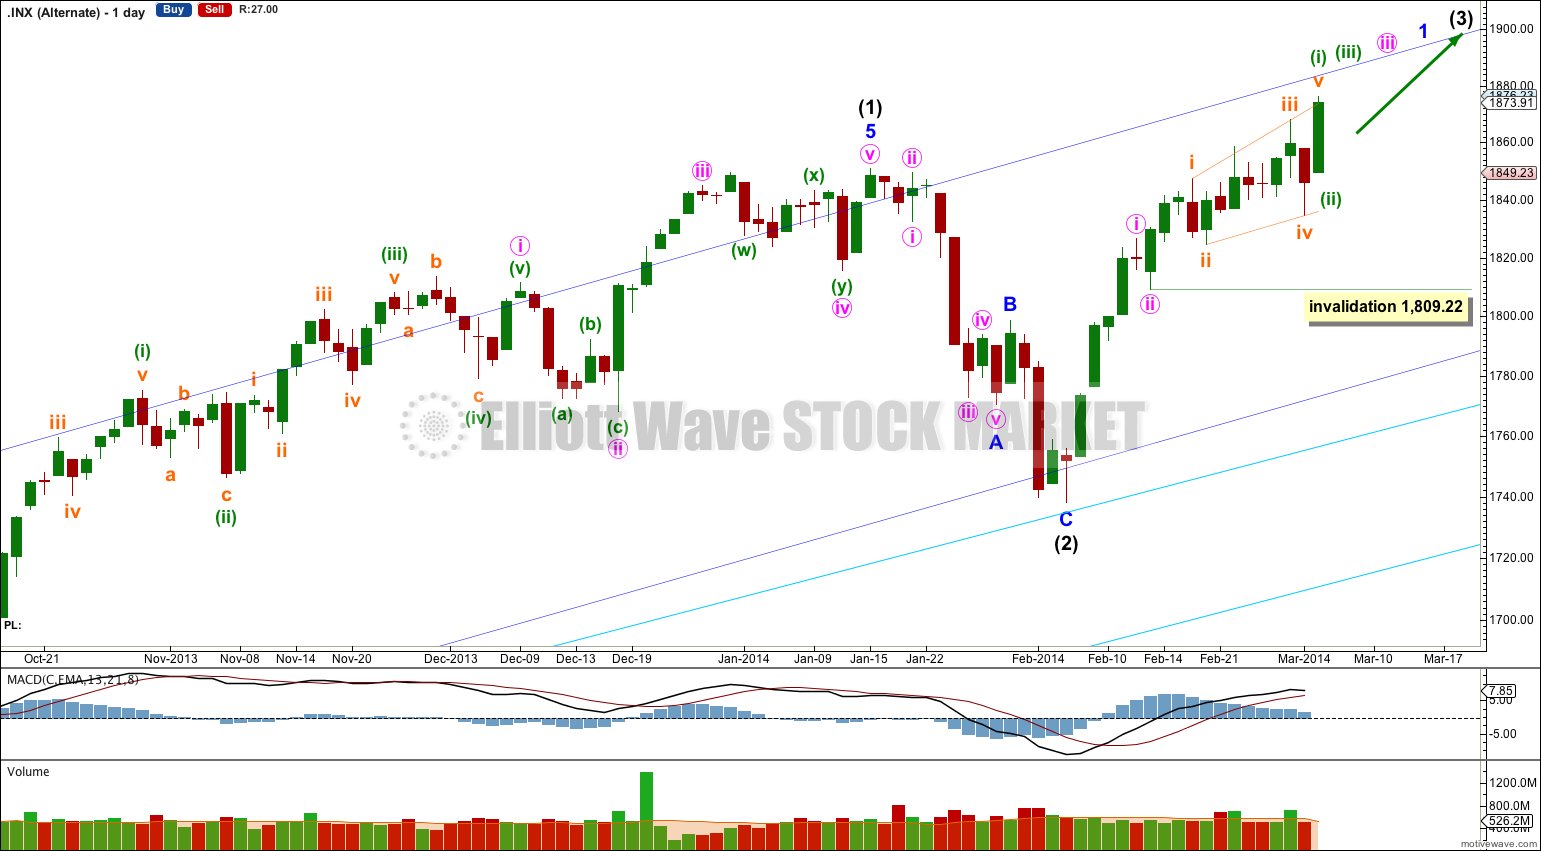
This wave count reverts to the idea that intermediate wave (2) may be over. However, if it is over there it would have been a remarkably brief correction for intermediate degree and it would not have breached the channel which contains intermediate wave (1). For these two reasons this wave count has a lower probability and is an alternate.
If intermediate wave (3) has begun then within it minor wave 1 is unlikely to be complete.
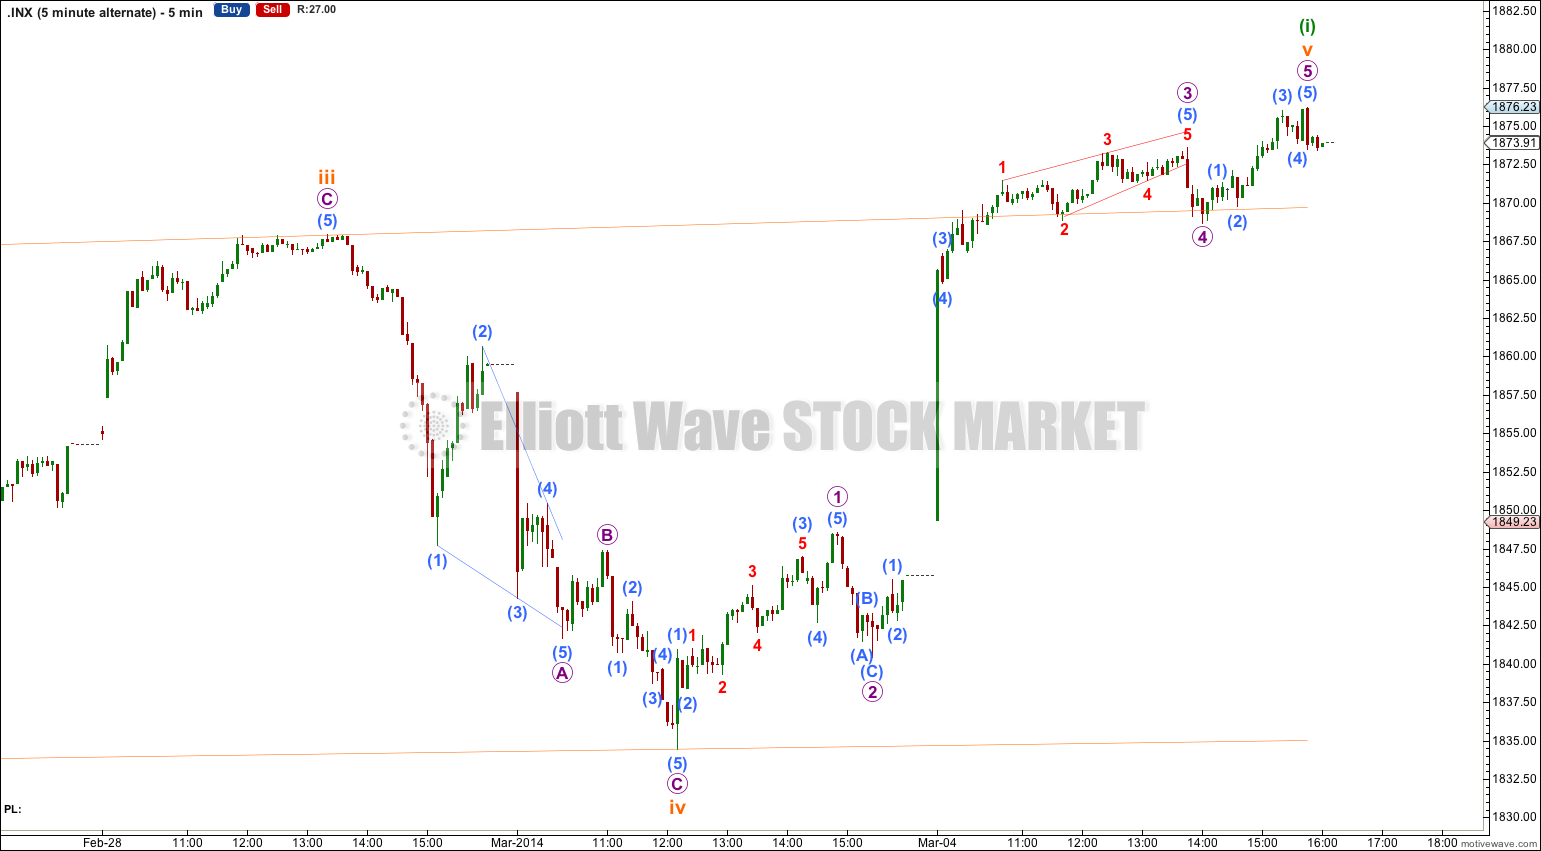
Within minor wave 1 minute wave i may be a complete impulse, minute wave ii a complete brief zigzag, and minute wave iii may have just begun with a leading expanding diagonal.
A base channel drawn about minute waves i and ii would be clearly breached to the downside by minuette wave (i). This is unusual and reduces the probability of this alternate wave count.
Minuette wave (ii) may not move beyond the start of minuette wave (i). This wave count is invalidated with movement below 1,809.22.
The diagonal is expanding and would be most likely leading. If the final fifth wave of subminuette wave v of the diagonal is over then it subdivided as an impulse. I would not want to try and see this movement as a three.
Within leading diagonals subwaves 2 and 4 can only be single zigzags. Subwaves 1, 3 and 5 are most commonly single zigzags but they may also be impulses. It is my experience over the years that if one of the actionary waves of a leading diagonal is an impulse it is normally the third wave, which makes sense. In this case the third wave is a zigzag and the fifth wave is an impulse which is a little unusual but fits the rules. Because the fifth wave is an impulse if this structure is a diagonal it must be leading and it cannot be an ending diagonal.
Following a leading diagonal in a first wave position the second wave is most often very deep. Minuette wave (ii) should be deep but may not move below the start of minuette wave (i) below 1,809.22.
I publish the five minute chart of this alternate below. The structure of subminuette wave iv is in question: it subdivides best as a five wave impulse (which fits the main wave count best) but it may also be seen as a zigzag which fits this alternate. The presence of the leading diagoanl for micro wave A of the zigzag reduces the probability of this wave count.
Bearish Alternate Wave Count.
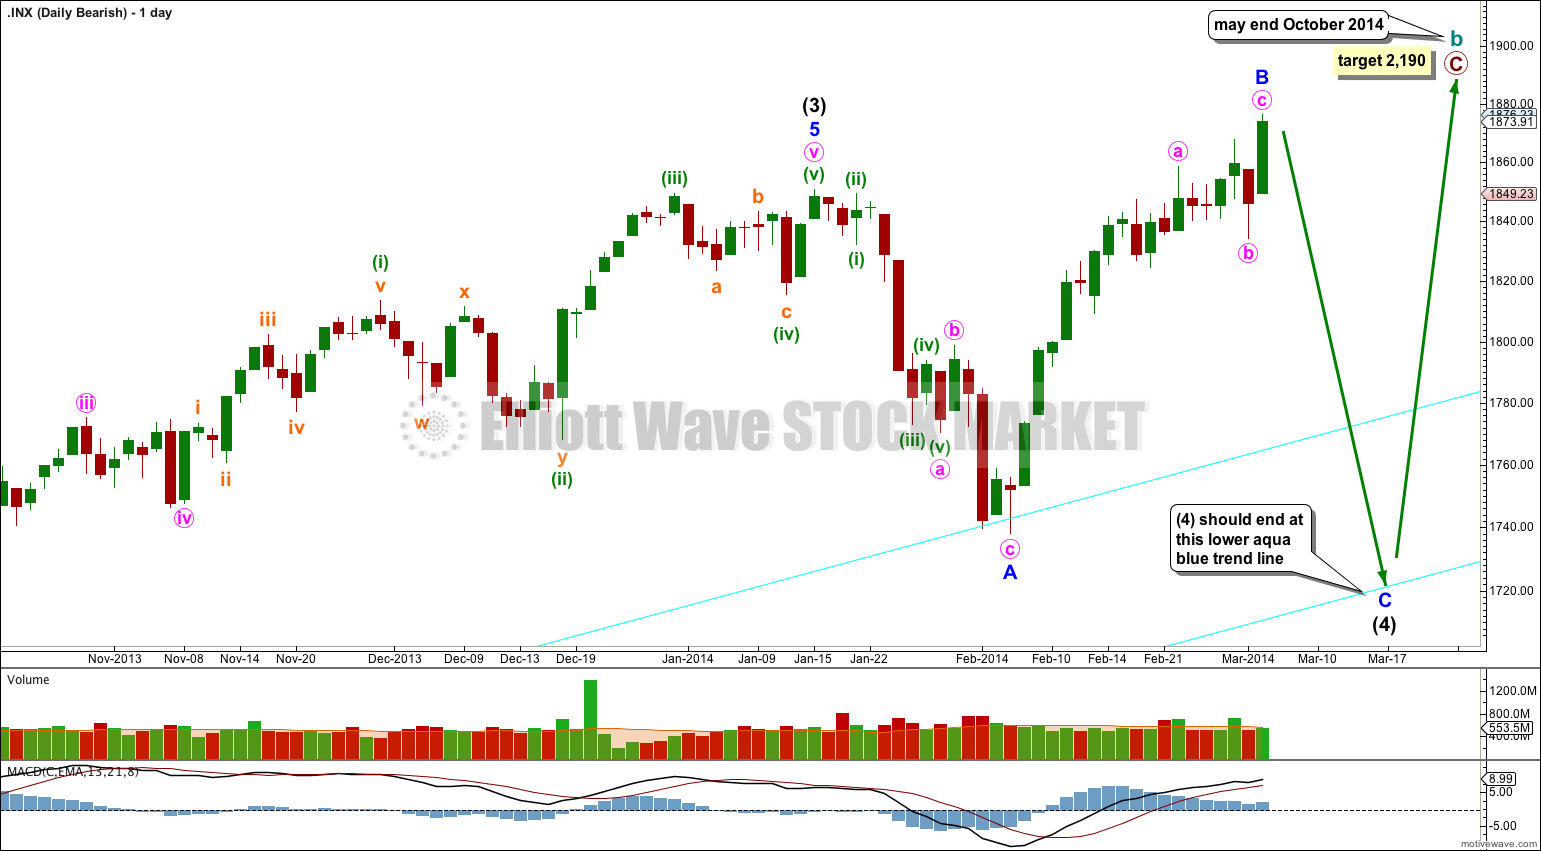
This bearish wave count expects that the correction was not over at 666.79, and that may have been just cycle wave a of a huge expanded flat for a super cycle wave II. Cycle wave b upwards is a close to complete zigzag. Within primary wave C of the zigzag intermediate wave (4) would be incomplete.
The subdivisions for intermediate wave (4) would be the same as the main wave count for intermediate wave (2). I would expect it to end at the lower aqua blue trend line.
Thereafter, if intermediate wave (5) lasts about five to six months it may end about October this year.
Hmm smal correction today and at the end or tommorow new highs 😛
Market is still strong. Nate has nice idea that we are in big 4 underway or even big wedge in progress.
This move from bottom still looks like some zigzags.
A small correction today and new highs tomorrow is exactly the conclusion I have come to after looking at the 5 minute charts.
Seems like US Fed QE kept the intermediate wave (2) muted. One more instance of that odd influence affecting wave counting. Alternate Bullish wave count may be the right one.