
Price has moved higher as expected. I can now calculate a target for this movement to end.
The wave count remains the same.
Summary: I expect more upwards movement which may last another one or two days to end about 1,843. I will use the channel on the hourly chart to indicate when upwards movement is over.
Click on the charts below to enlarge.
Main Bearish Wave Count.
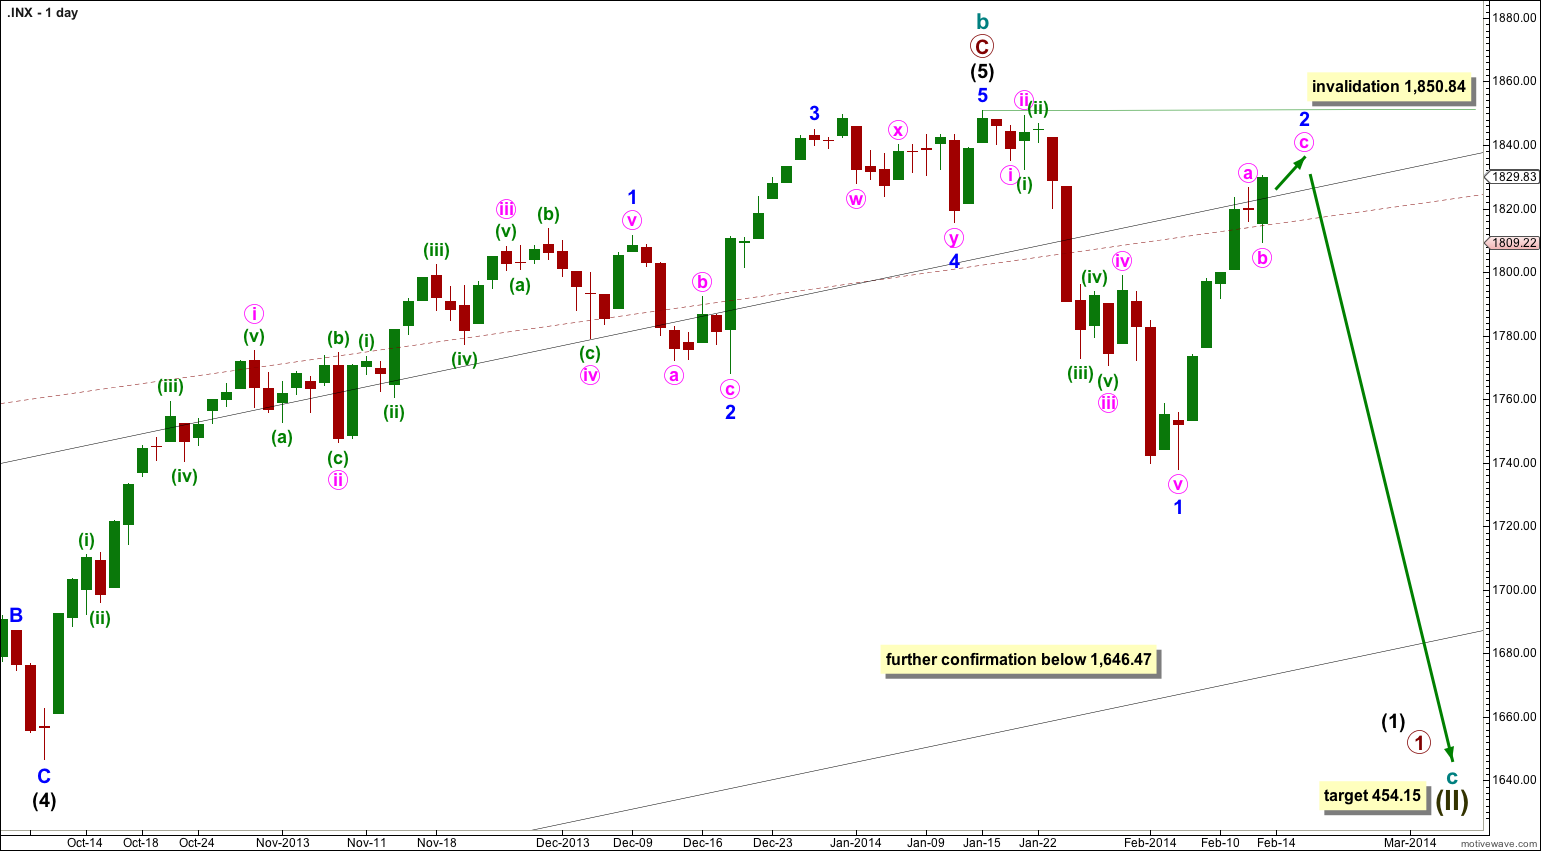
This wave count has a higher probability than the bullish alternate. Upwards movement over the last 4 years and 11 months subdivides best as a zigzag. If something is “off” about the supposed recovery then it must be a B wave because there is plenty that is off in this scenario in terms of social mood.
It is possible that cycle wave b is over and that there has been a trend change at cycle degree (bearish wave count) or intermediate wave degree (bullish alternate below). On the monthly chart there is a bearish engulfing candlestick pattern indicating a new bear market has just begun.
There is now a clear five down on the daily chart. This is indication of a trend change, at least at intermediate degree.
For this main wave count downwards movement must move below 1,530.09 because this super cycle wave (II) must move below the high of super cycle wave (I).
Cycle wave c should last between one to several years and should take price substantially below 666.79.
At 454.15 cycle wave c would reach 1.618 the length of cycle wave a. It should subdivide as a five wave motive structure, most likely a simple impulse, but it may also be an ending diagonal.
Movement below 1,646.47 would provide further confidence in a trend change, at least at intermediate wave degree.
If downwards movement breaches the maroon – – – channel on the monthly chart then I would discard the bullish alternate and this would be my only wave count.
Within cycle wave c no second wave correction may move beyond the start of its first wave. This wave count is invalidated with any movement above 1,850.84.
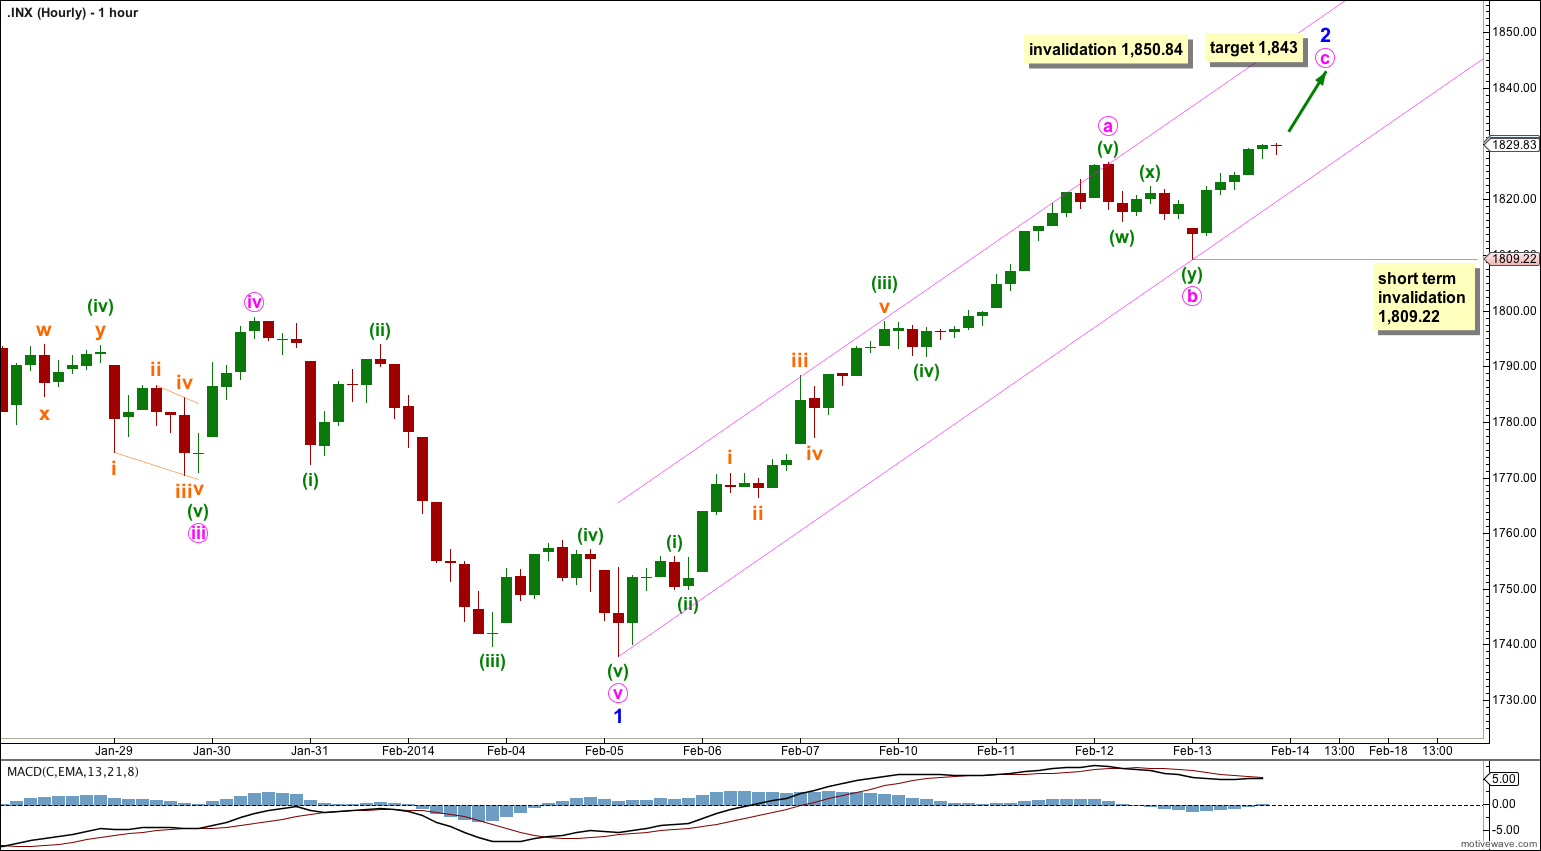
Minor wave 2 is an almost complete zigzag. So far it has lasted six days. If it continues for another two days it may total a Fibonacci eight days. This expectation may be too generous as it may end sooner.
At 1,843 minute wave c would reach 0.382 the length of minute wave a.
I have seen many zigzags which fit within a narrow channel as this one does; this does not look unusual at all. Second waves can and often do correct to very deep degrees, and when they do this they convince us there has been no trend change right before a strong third wave takes off in the opposite direction. The only thing which would make me switch to being more bullish in the near term is a new high above 1,850.84.
The bearish engulfing candlestick pattern on the monthly chart for January is further indication of a trend change of a reasonable degree.
I have drawn a small channel about minor wave 2 using Elliott’s technique. Draw the first trend line from the start of minute wave a to the end of minute wave b. Place a parallel copy upon the end of minute wave a. I would expect minute wave c to be most likely to continue upwards along the mid line of this channel. When this channel is very clearly breached by at least one full hourly candlestick below it and not touching the lower trend line then I would consider that is confirmation that minor wave 2 is over and minor wave 3 is underway.
If this current upwards movement is an unfolding impulse as some members have suggested then the next upwards movement should be a third wave. It must show an increase in upwards momentum and it should clearly breach the upper edge of this channel. I expect that has a very low probability.
Within minute wave c no second wave correction may move beyond the start of its first wave. This wave count is invalidated in the short term with movement below 1,809.22. When minute wave c is complete then subsequent movement below 1,809.22 would provide price confirmation that minor wave 2 is over and minor wave 3 has begun.
Minor wave 2 may not move beyond the start of minor wave 1. This wave count is invalidated with movement above 1,850.84.
Bullish Alternate Wave Count.
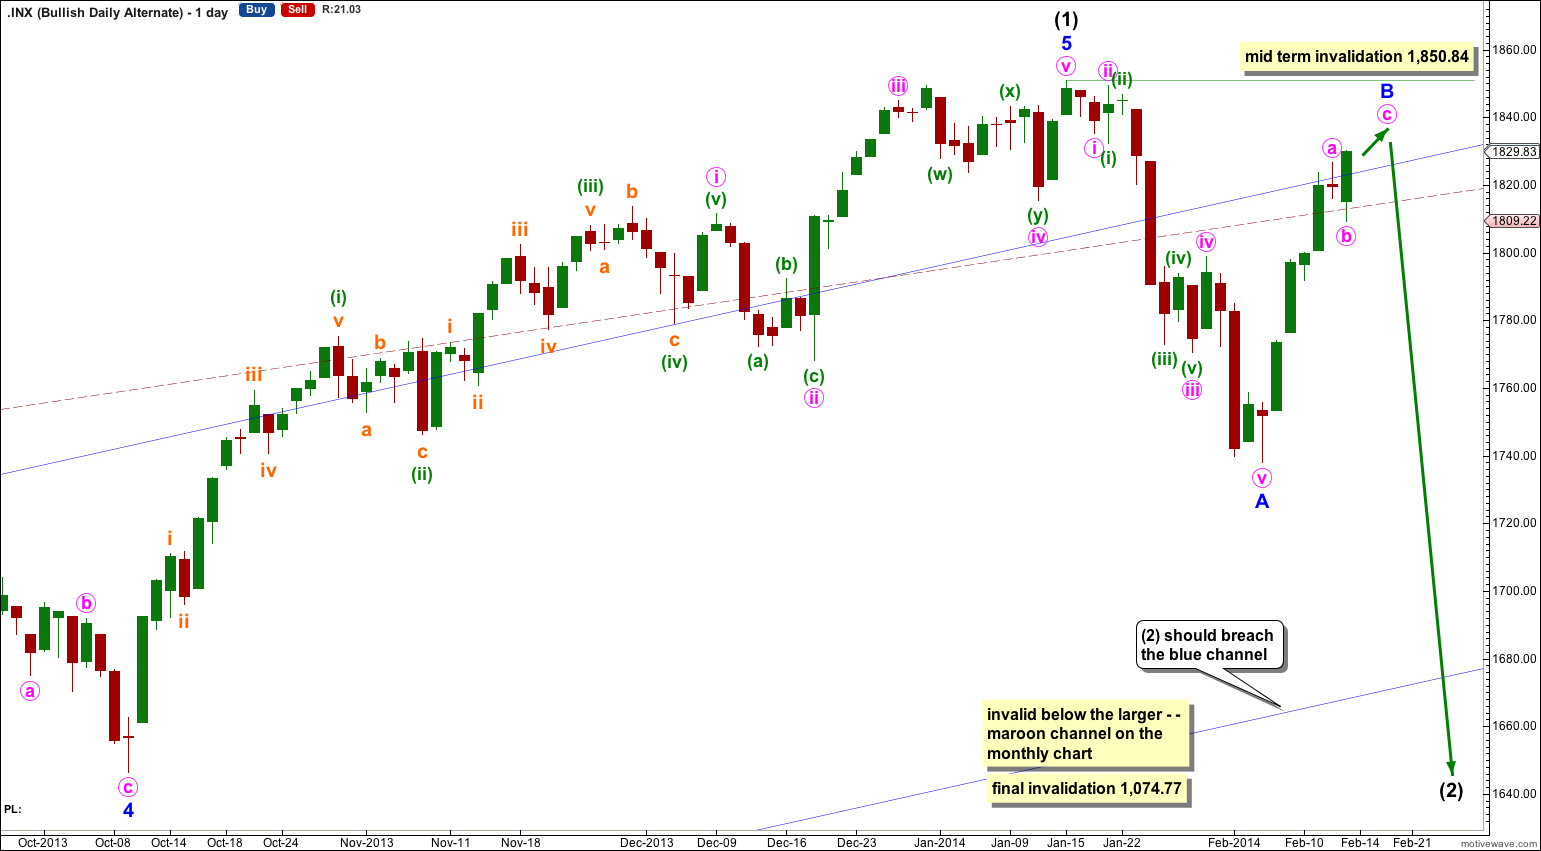
It is possible that a new cycle degree bull market began at 666.79. So far it is not yet halfway through, and I would expect it to last for a few years (at least five more years and probably longer).
At this stage this alternate bullish wave count does not diverge from the main bearish wave count, and it will not for a few to several weeks yet.
In the mid term this bullish wave count may have seen an intermediate degree trend change.
Intermediate wave (2) must subdivide as a three wave corrective structure. The first downwards movement within it must subdivide as a five and within it no second wave correction may move beyond the start of its first wave. This trend change is invalidated with any movement above 1,850.84.
Intermediate wave (2) downwards should last several weeks to a couple of months or so, and should breach the lower edge of the wide blue channel here on the daily chart.
Intermediate wave (2) should not breach support at the lower edge of the larger maroon – – – channel which is drawn the same way for both wave counts. For this alternate intermediate wave (2) should not breach the lower edge of the acceleration channel drawn about primary waves 1 and 2, one degree higher.
Today friday the 14 the Nasdaq have breach the all time high on a closing basis. And I´m dying to know the wave count for the Nasdaq. Does the breach in the Nasdaq change your wave count? Could you place a wave count for the Nasdaq, if not too much to ask? Thanks
It makes zero difference to my wave count for SPX and DJIA.
I’m currently reading towards my level I CMT exam. I do not have time at the moment to spend a few hours doing a new wave count for the Nasdaq. But what has happened does fit nicely with the wave count I did for the Nasdaq back in November 2013.
Hi, Lara I have a question. When does your bearish wave 2 count gets invalidated? If the market breach the all time high intraday or if it closes above the all time high? Thank you for your answer.
Any breach by any amount, intraday, intra hour or even intra minute, is enough to invalidate the wave count.
Lara,
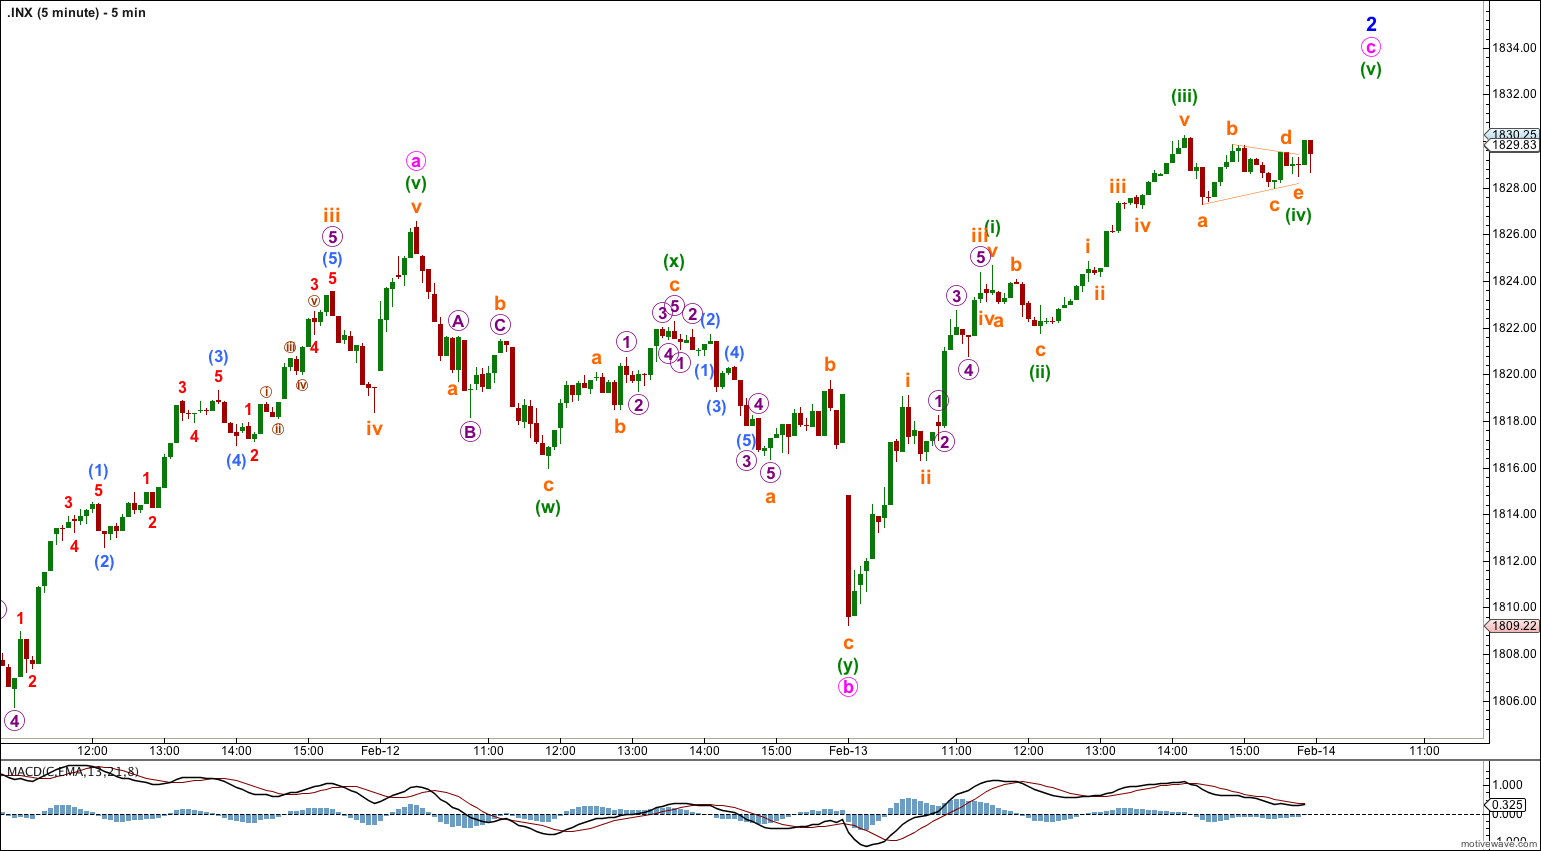
Based on your count, how can we reach a target of 1843. In that case, green 3 in this final wave would be the shortest wave.
Thanks,
Peter
A most excellent observation.
The answer is in today’s analysis. My labeling of that piece of movement on the five minute chart was premature, and wrong.