
I had expected downwards movement for Friday’s session. This is not what happened. The price point provided of 1,766.47 was not breached, and the small channel on the hourly chart was not breached, and so there was no confirmation that the downwards trend had begun.
The wave count remains the same.
Summary: I still expect downwards movement which should be very choppy and overlapping for a minute degree wave b or x to last two to four days. It is likely downwards movement shall reach at least 1,745.50 (but does not have to) and it may make a new low below 1,739.66.The alternate also expects downwards movement from here, which may be a third wave. I want to see movement below 1,786.63 and below the small channel on the hourly chart to indicate a trend change to the downside.
Click on the charts below to enlarge.
Main Bearish Wave Count.
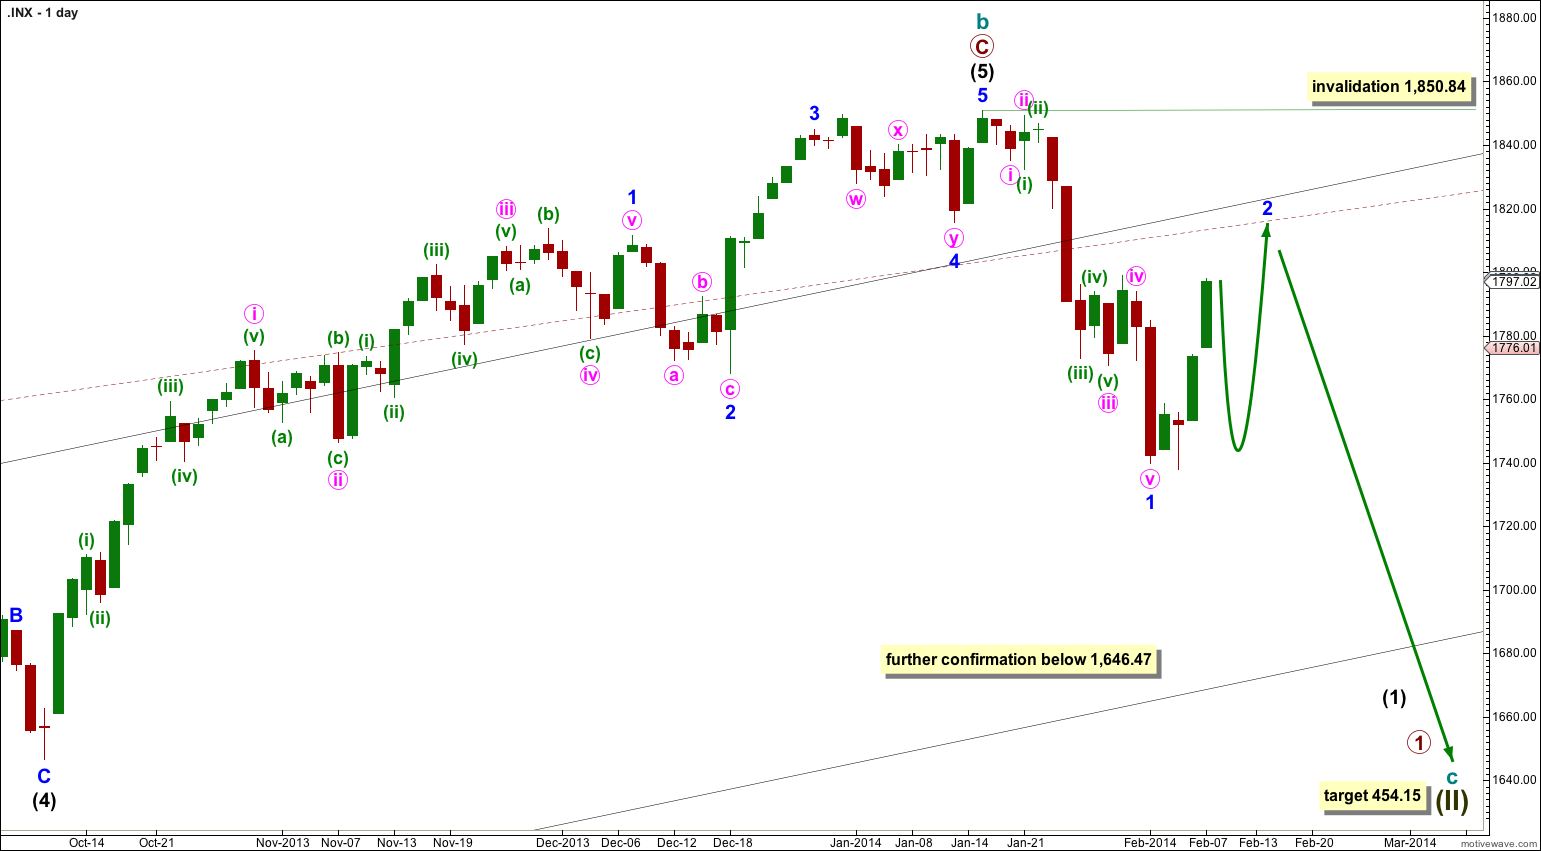
This wave count has a higher probability than the bullish alternate. Upwards movement over the last 4 years and 11 months subdivides best as a zigzag. If something is “off” about the supposed recovery then it must be a B wave because there is plenty that is off in this scenario in terms of social mood.
It is possible that cycle wave b is over and that there has been a trend change at cycle degree (bearish wave count) or intermediate wave degree (bullish alternate below).
There is now a clear five down on the daily chart. This is indication of a trend change, at least at intermediate degree.
For this main wave count downwards movement must move below 1,530.09 because this super cycle wave (II) must move below the high of super cycle wave (I).
Cycle wave c should last between one to several years and should take price substantially below 666.79.
At 454.15 cycle wave c would reach 1.618 the length of cycle wave a. It should subdivide as a five wave motive structure, most likely a simple impulse, but it may also be an ending diagonal.
Movement below 1,646.47 would provide further confidence in a trend change, at least at intermediate wave degree.
If downwards movement breaches the maroon – – – channel on the monthly chart then I would discard the bullish alternate and this would be my only wave count.
Within cycle wave c no second wave correction may move beyond the start of its first wave. This wave count is invalidated with any movement above 1,850.84.
Main Hourly Wave Count.
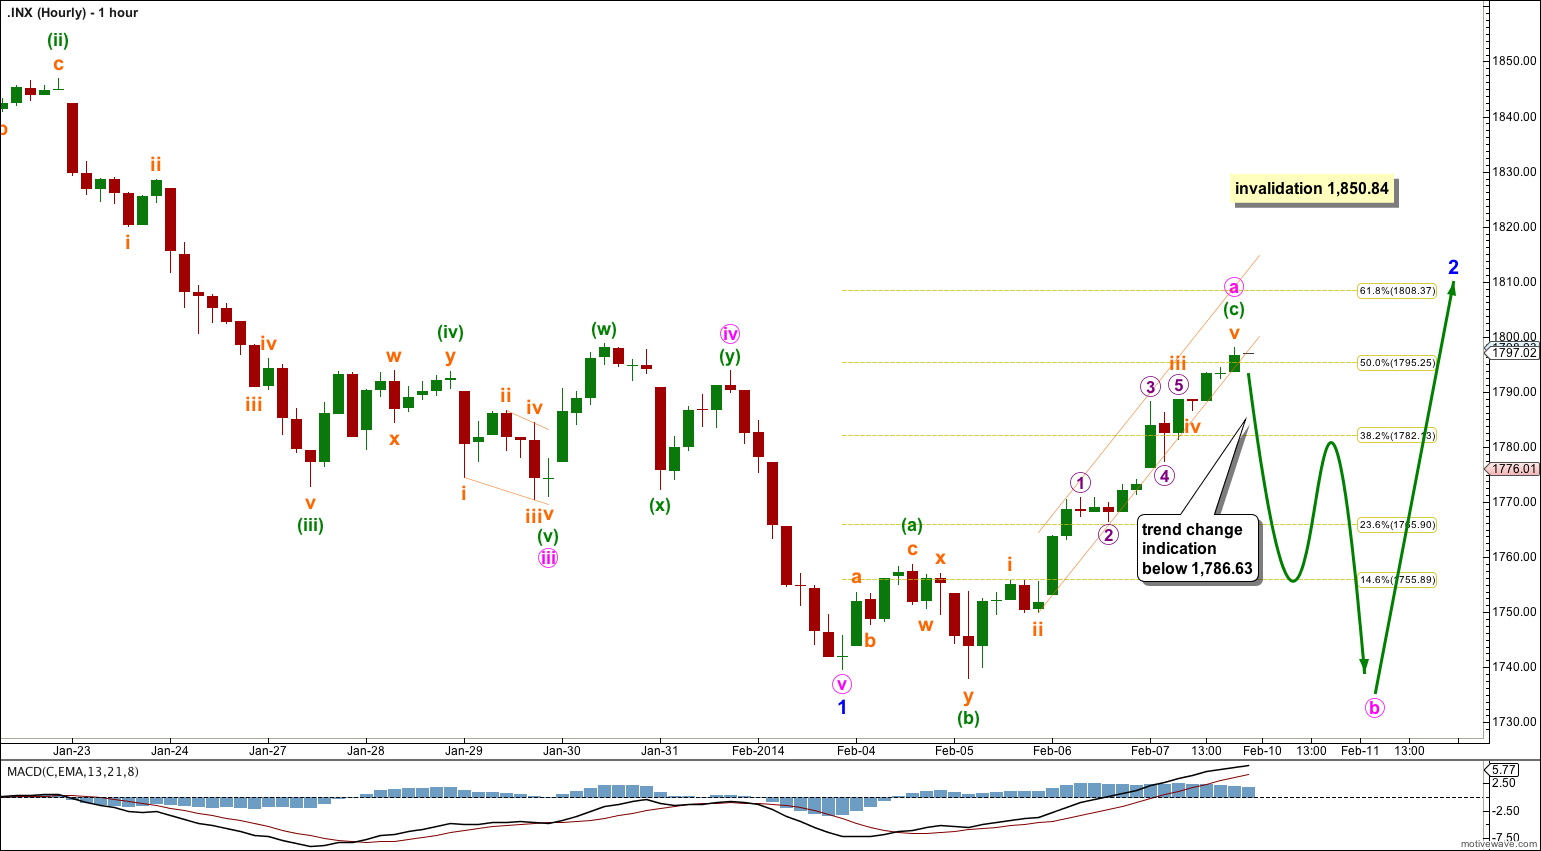
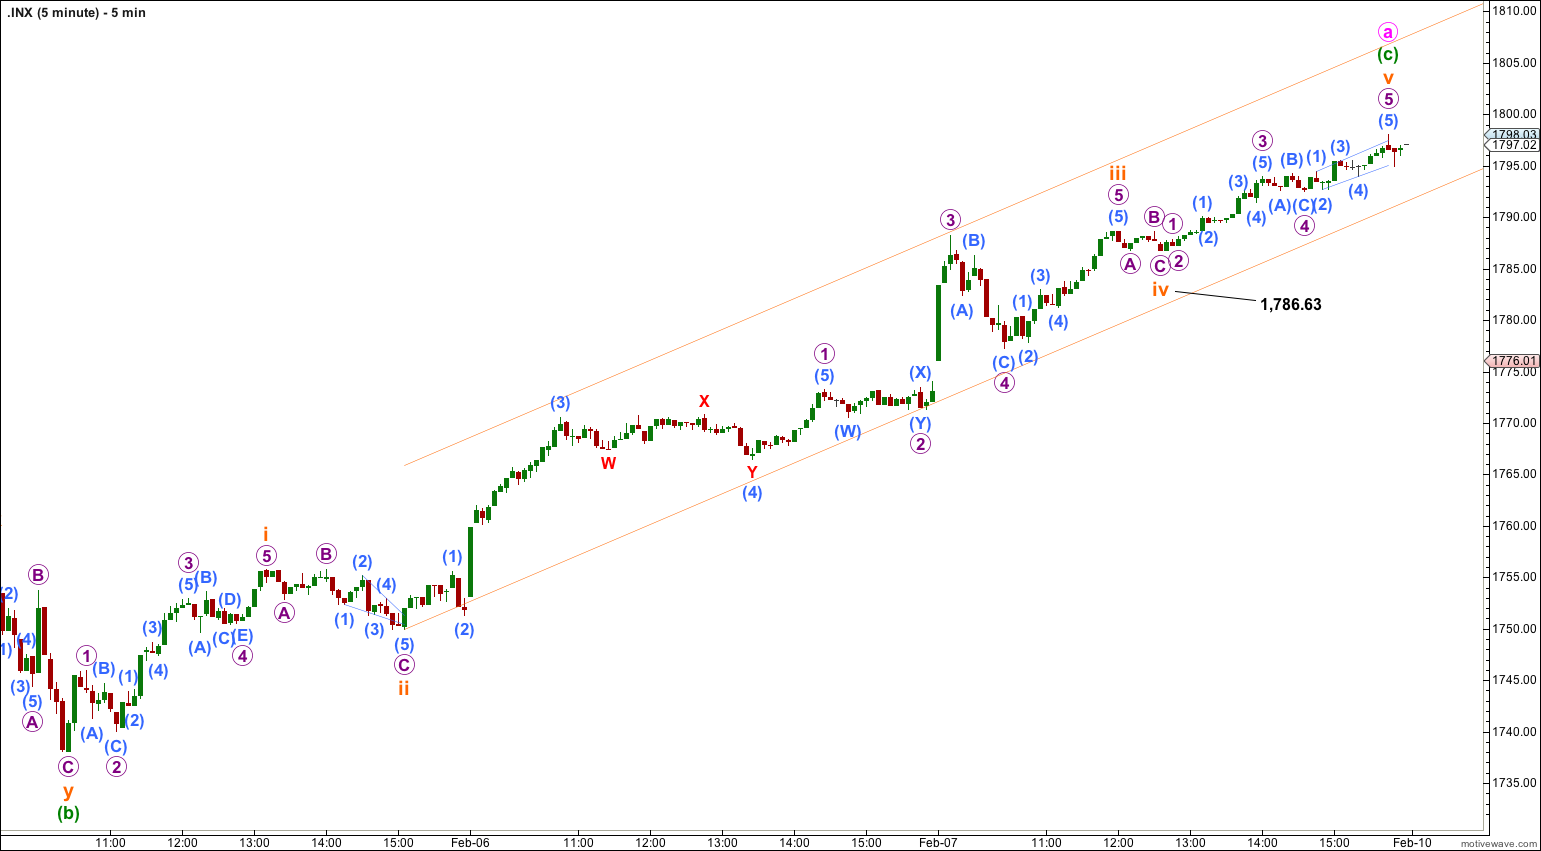
Upwards movement continued for minuette wave (c) which is now longer than 2.618 the length of minuette wave (a) and has no Fibonacci ratio to minuette wave (a). On the five minute chart minuette wave (c) is again a complete structure.
If price moves below 1,786.64 (the end of subminuette wave iv within minuette wave (c) ) then downwards movement may not be a second wave correction within subminuette wave v and it would be likely that minuette wave (c) would be over.
I would want to see the small channel drawn as a best fit about minuette wave (c) breached by a full hourly candlestick below the channel and not touching the lower trend line to have confidence that the trend has changed to downwards.
There are still a few structural possibilities for minor wave 2. It may be unfolding as a flat correction, a double flat correction or a double combination. For all these possibilities a downwards wave is required for either minute wave b or x.
If minor wave 2 is a flat correction then within it minute wave b must reach a minimum of 90% the length of minute wave a at 1,745.50 and may make a new low below 1,739.66.
If minor wave 2 is a double flat or double combination then minute wave x downwards has no minimum point it must reach, but it would most likely be deep. It too may make a new low below 1,739.66.
For both possibilities of a minute degree wave b or x the downwards structure must subdivide as a three wave corrective structure. It would most likely exhibit choppy overlapping movement.
Minor wave 2 may not move beyond the start of minor wave 1. This wave count is invalidated with movement above 1,850.84.
Alternate Hourly Wave Count.
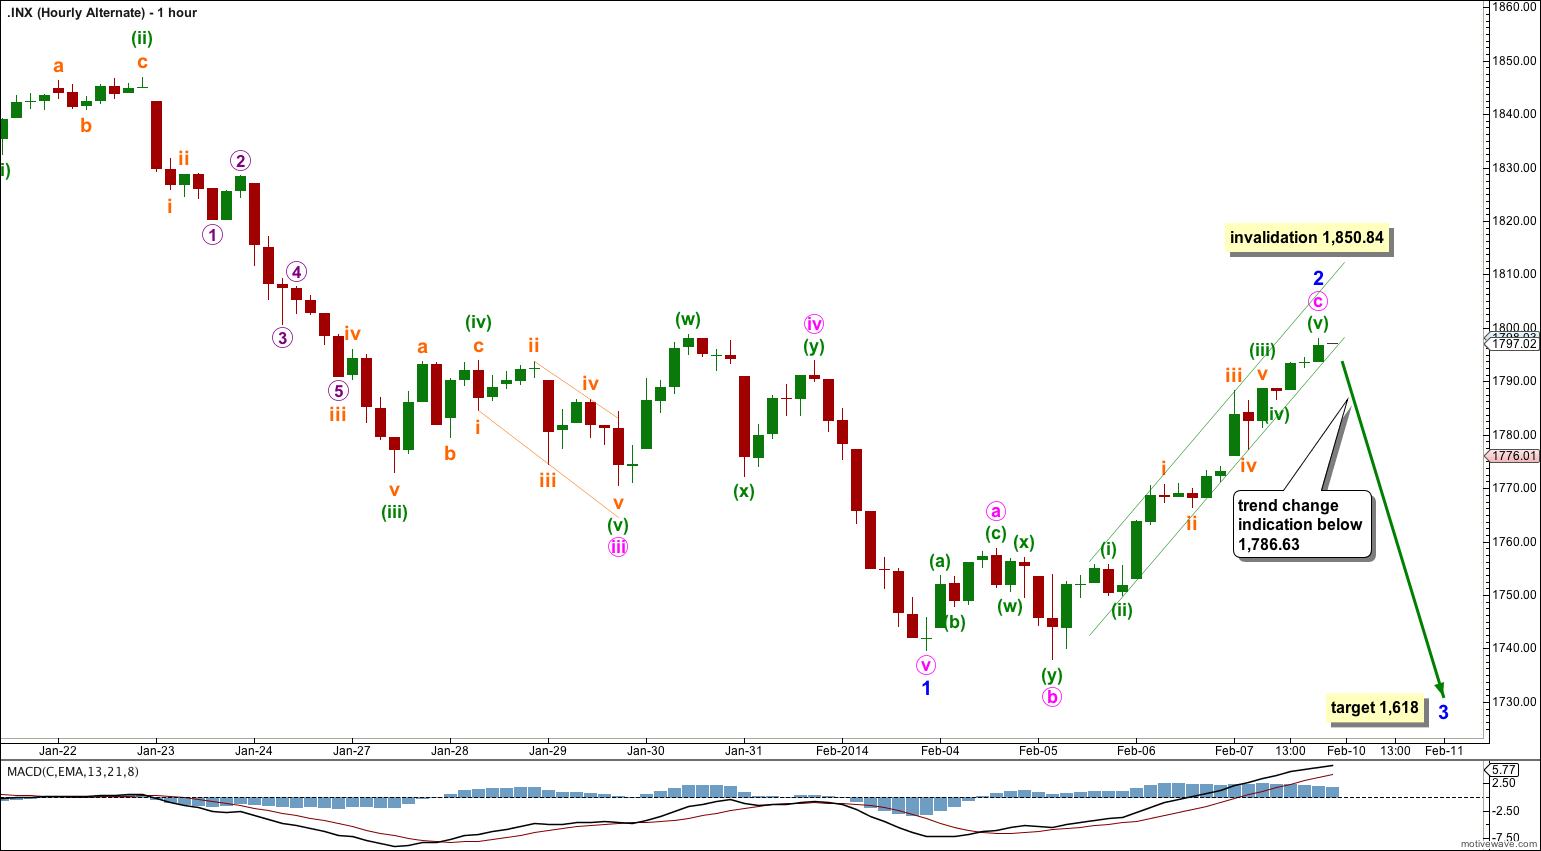
If the degree of labelling within minor wave 2 is simply moved up one degree then it is possible to see that it could be over there.
I would still want to see a clear channel breach of minute wave c, and movement below 1,786.63 before I have confidence that the trend has changed to down.
If minor wave 2 is over then minor wave 3 downwards would reach 1.618 the length of minor wave 1 at 1,618. Minor wave 3 may only subdivide as a simple impulse. It should exhibit a strong increase in downwards momentum.
This alternate wave count has a lower probability than the main wave count because it expects that minor wave 2 would be over in just four days while minor wave 1 lasted thirteen days. The lack of proportion between minor waves 1 and 2 reduces the probability of this alternate. However, I will consider it because upwards movement has so far reached very close to the 0.618 Fibonacci ratio of minor wave 1 which is at 1,808.37.
If minute wave c continues higher it may not move above 1,850.84. Minor wave 2 may not move beyond the start of minor wave 1.
If the next downwards movement is a clear three, a corrective structure, then the main wave count would be correct. If the next downwards movement is a clear five, a motive structure, then this alternate would be correct. Careful attention to the structure of the next downwards wave is required to identify which wave count is correct.
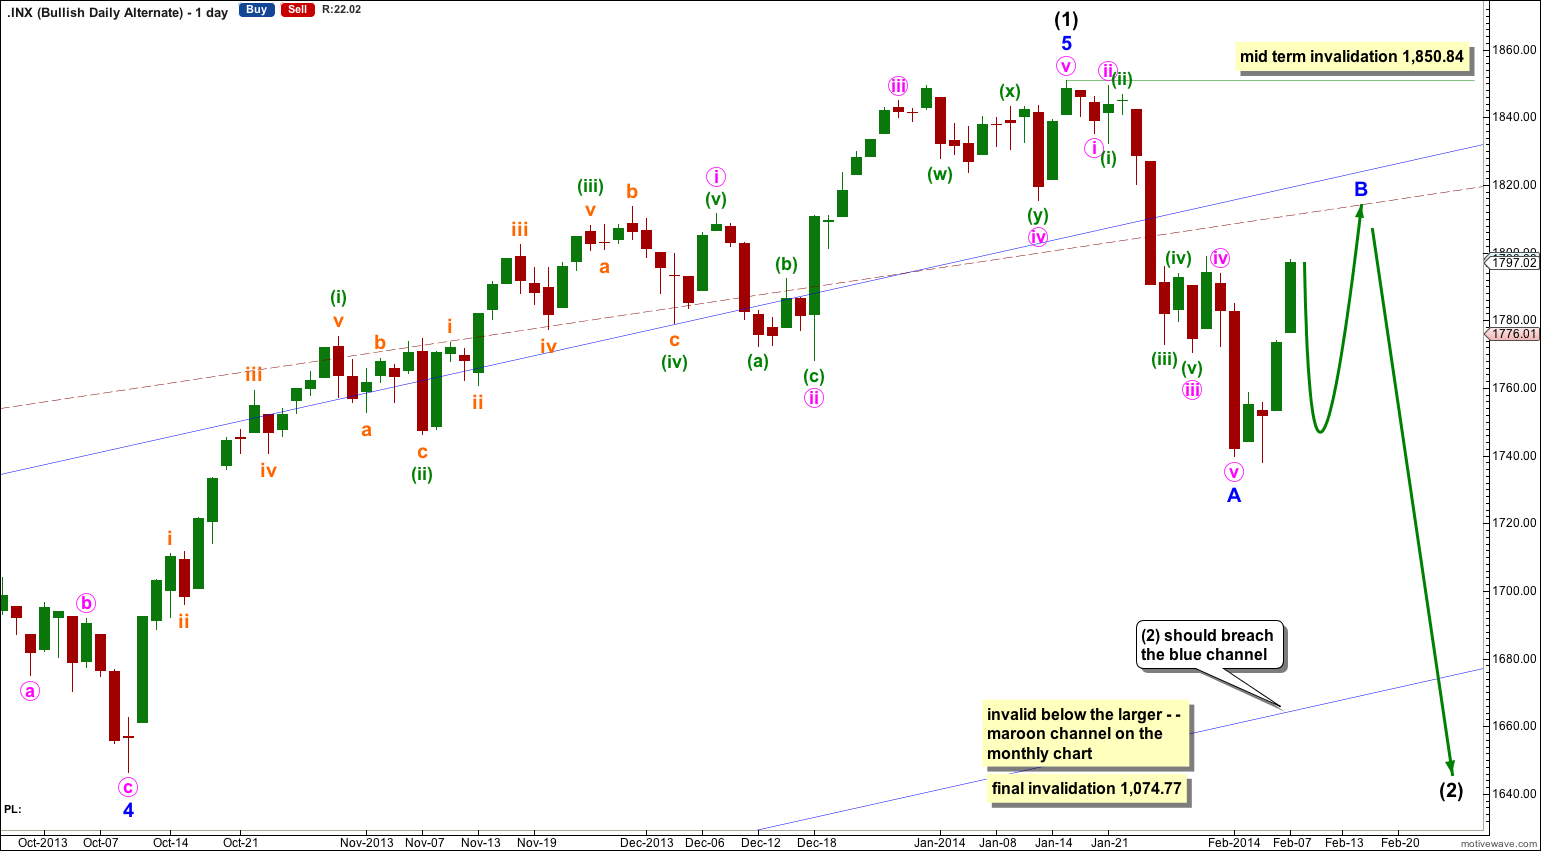
Bullish Alternate Wave Count.
It is possible that a new cycle degree bull market began at 666.79. So far it is not yet halfway through, and I would expect it to last for a few years (at least five more years and probably longer).
At this stage this alternate bullish wave count does not diverge from the main bearish wave count, and it will not for a few to several weeks yet.
In the mid term this bullish wave count may have seen an intermediate degree trend change.
Intermediate wave (2) must subdivide as a three wave corrective structure. The first downwards movement within it must subdivide as a five and within it no second wave correction may move beyond the start of its first wave. This trend change is invalidated with any movement above 1,850.84.
Intermediate wave (2) downwards should last several weeks to a couple of months or so, and should breach the lower edge of the wide blue channel here on the daily chart.
Intermediate wave (2) should not breach support at the lower edge of the larger maroon – – – channel which is drawn the same way for both wave counts. For this alternate intermediate wave (2) should not breach the lower edge of the acceleration channel drawn about primary waves 1 and 2, one degree higher.
Could it be that the downward impulse from 1850 was not over at 1739.66 but at 1737.92 (5. Feb.) and that we are now in a zigzag towards minor 2 (alt. minor B)?
I would then expect that minute a is not yet over and would reach 1813.93 (Fib. 0.618 wave 1 through 3), followed by minute b (target 1785.05-1753.88) followed by minute c (minor 2, alt. minor B, target 1822.97).
Regards,
Oliver