
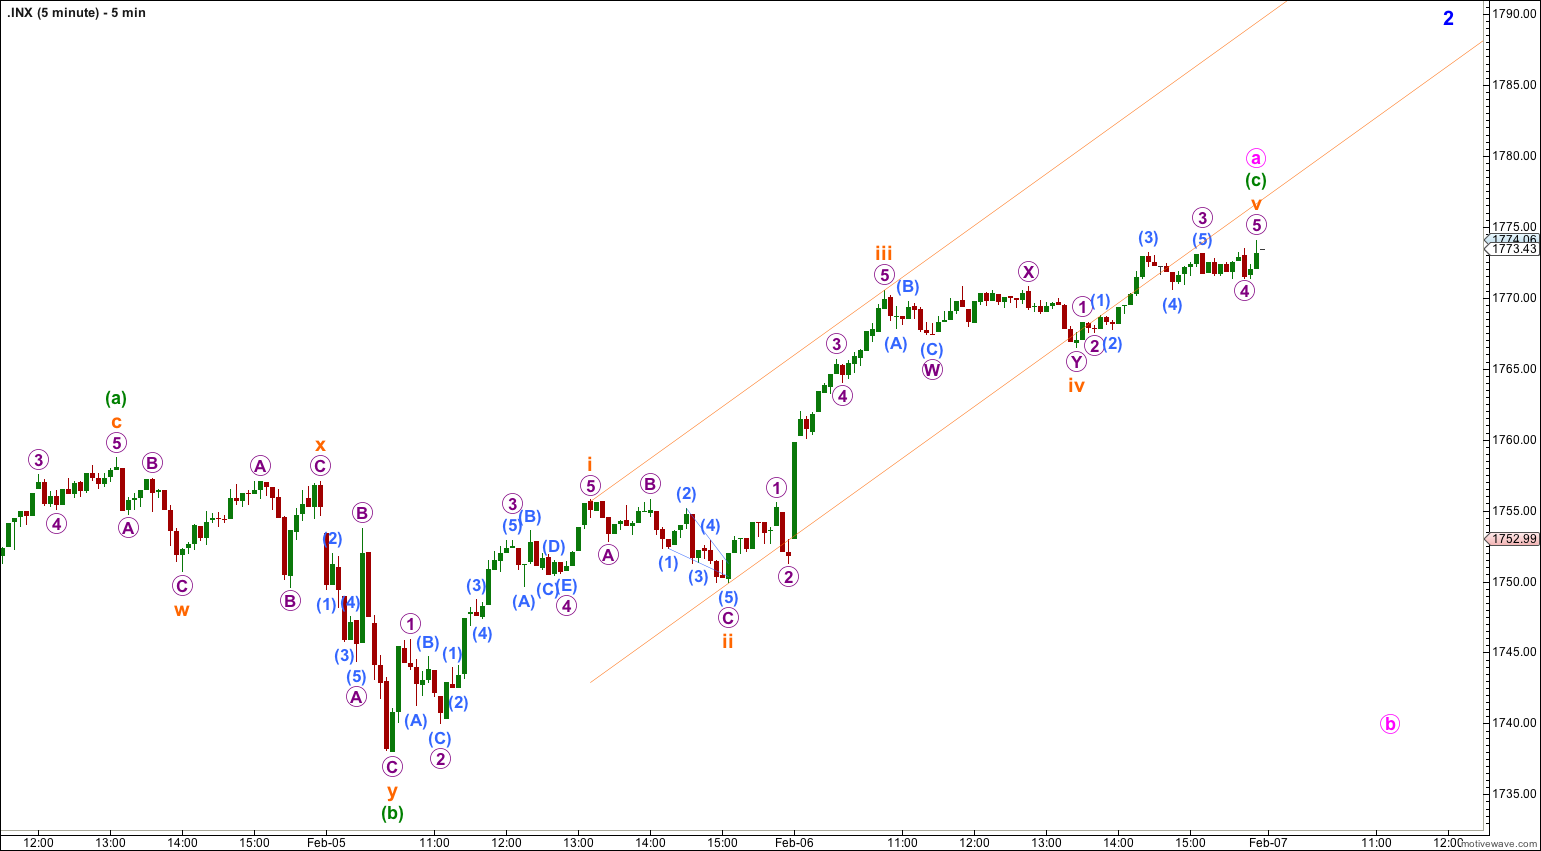
Yesterday I expected upwards movement from the S&P for Thursday’s session to a short term target at 1,769. Price moved higher as expected, reaching 1,774.06, 5.06 points above the target.
The wave count remains the same.
Summary: I now expect downwards movement which should be very choppy and overlapping for a minute degree wave b or x to last two to four days. It is likely downwards movement shall reach at least 1,743.10 (but does not have to) and it may make a new low below 1,739.66.
Click on the charts below to enlarge.
Main Bearish Wave Count.
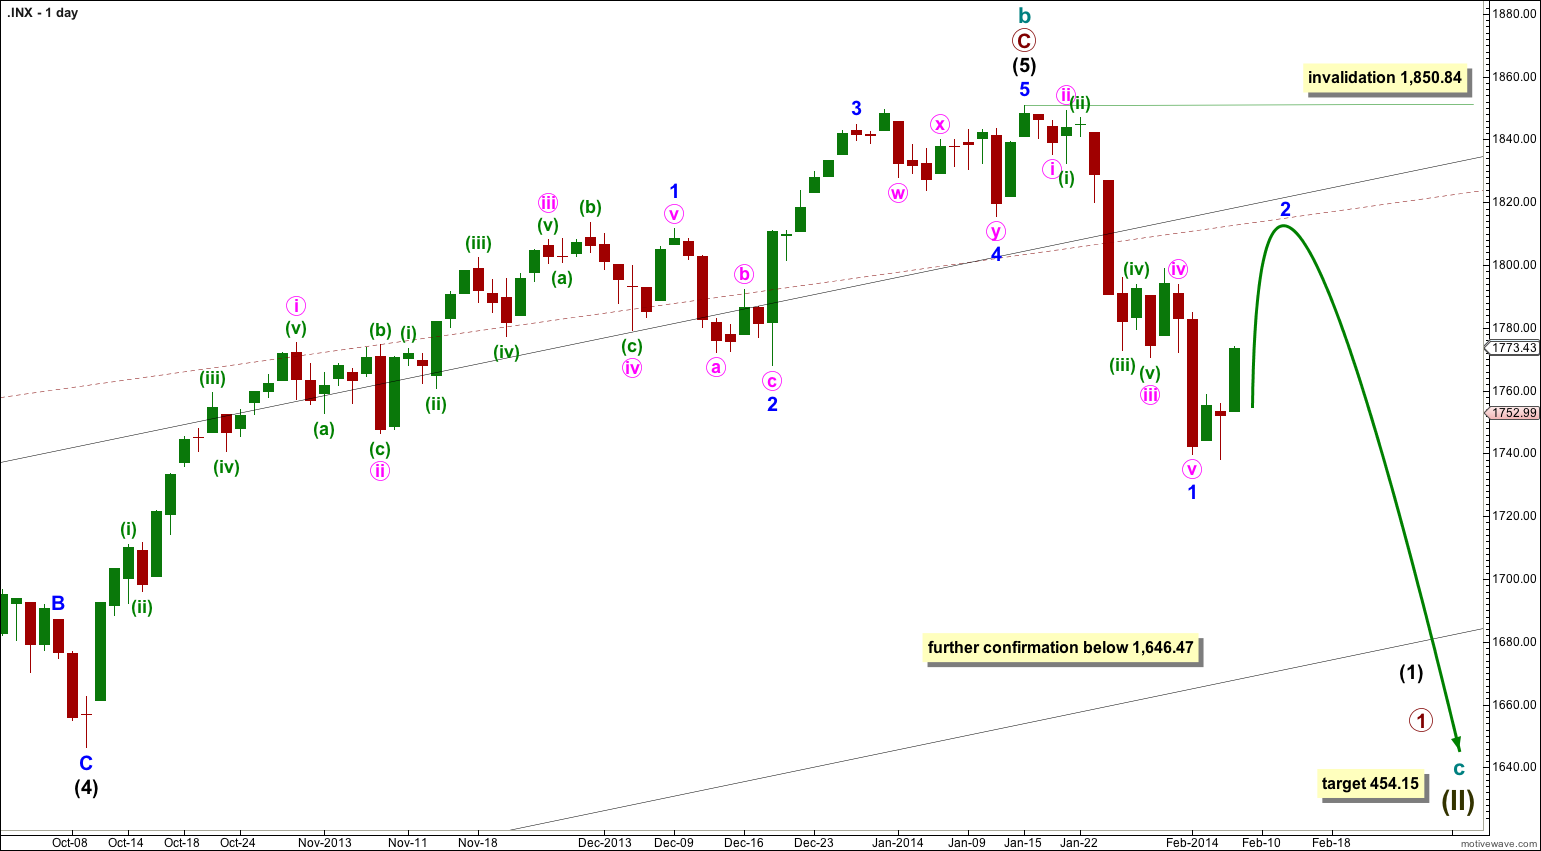
This wave count has a higher probability than the bullish alternate. Upwards movement over the last 4 years and 11 months subdivides best as a zigzag. If something is “off” about the supposed recovery then it must be a B wave because there is plenty that is off in this scenario in terms of social mood.
It is possible that cycle wave b is over and that there has been a trend change at cycle degree (bearish wave count) or intermediate wave degree (bullish alternate below).
There is now a clear five down on the daily chart. This is indication of a trend change, at least at intermediate degree.
Downwards movement must move below 1,530.09 because this super cycle wave (II) must move below the high of super cycle wave (I).
Cycle wave c should last between one to several years and should take price substantially below 666.79.
At 454.15 cycle wave c would reach 1.618 the length of cycle wave a. It should subdivide as a five wave motive structure, most likely a simple impulse.
Movement below 1,646.47 would provide further confidence in a trend change, at least at intermediate wave degree.
If downwards movement breaches the maroon – – – channel on the monthly chart then I would discard the bullish alternate and this would be my only wave count.
Within cycle wave c no second wave correction may move beyond the start of its first wave. This wave count is invalidated with any movement above 1,850.84.
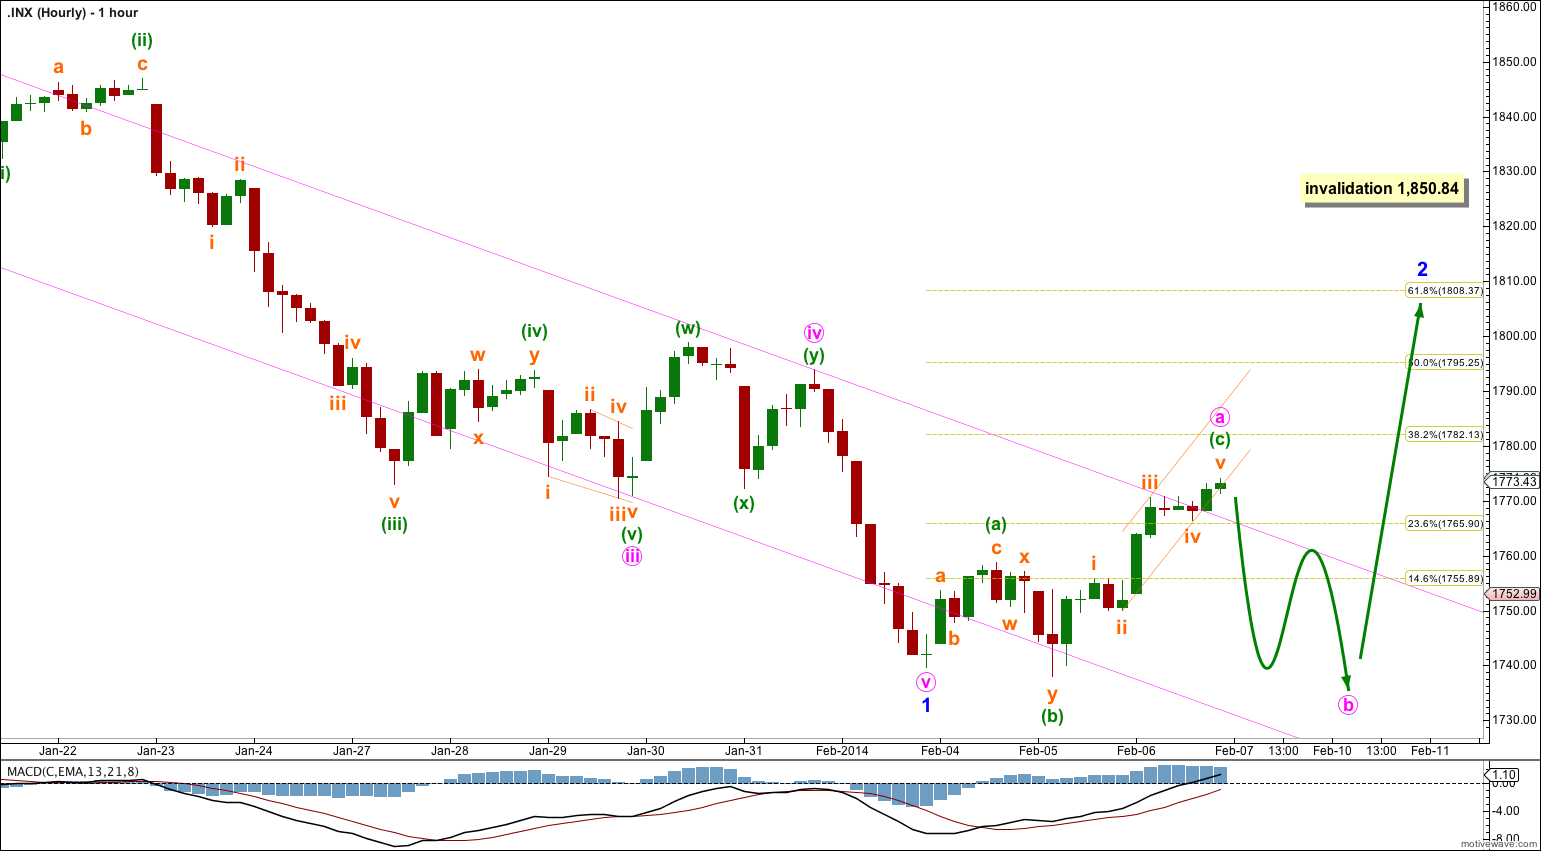
There are still a few structural possibilities for minor wave 2 to complete as. At this stage it is clear that the first movement is an expanded flat, a three wave structure. This eliminates only the possibility of a simple zigzag for minor wave 2. It may still be a flat, double flat or combination.
A flat correction subdivides 3-3-5. Within it the first three, minute wave a would be complete, itself an expanded flat. Minute wave b should move lower as a three wave structure and must reach a minimum of 90% the length of minute wave a which is at 1,743.10. Minute wave b may move beyond the start of minute wave a, and would be reasonably likely to do so. It may make a new low below 1,739.66.
A double flat or double combination would also expect a three wave structure lower from here. The only difference at this stage is that if the next three down is minute wave x there is no minimum requirement. It too may make a new low below 1,739.66.
On the five minute chart the structure of minuette wave (c) is now a completed impulse. The final fifth wave within it is complete, but there is not enough downwards movement at the end of Thursday’s session to indicate that it will not extend further. Movement below 1,766.47 would indicate that minuette wave (c) is over and the next wave down has begun. A clear channel breach of the small upwards sloping channel here on the hourly chart which contains minuette wave (c) would also provide confirmation that minuette wave (c) is over.
Minor wave 2 may not move beyond the start of minor wave 1. This wave count is invalidated with movement above 1,850.84.
Bullish Alternate Wave Count.
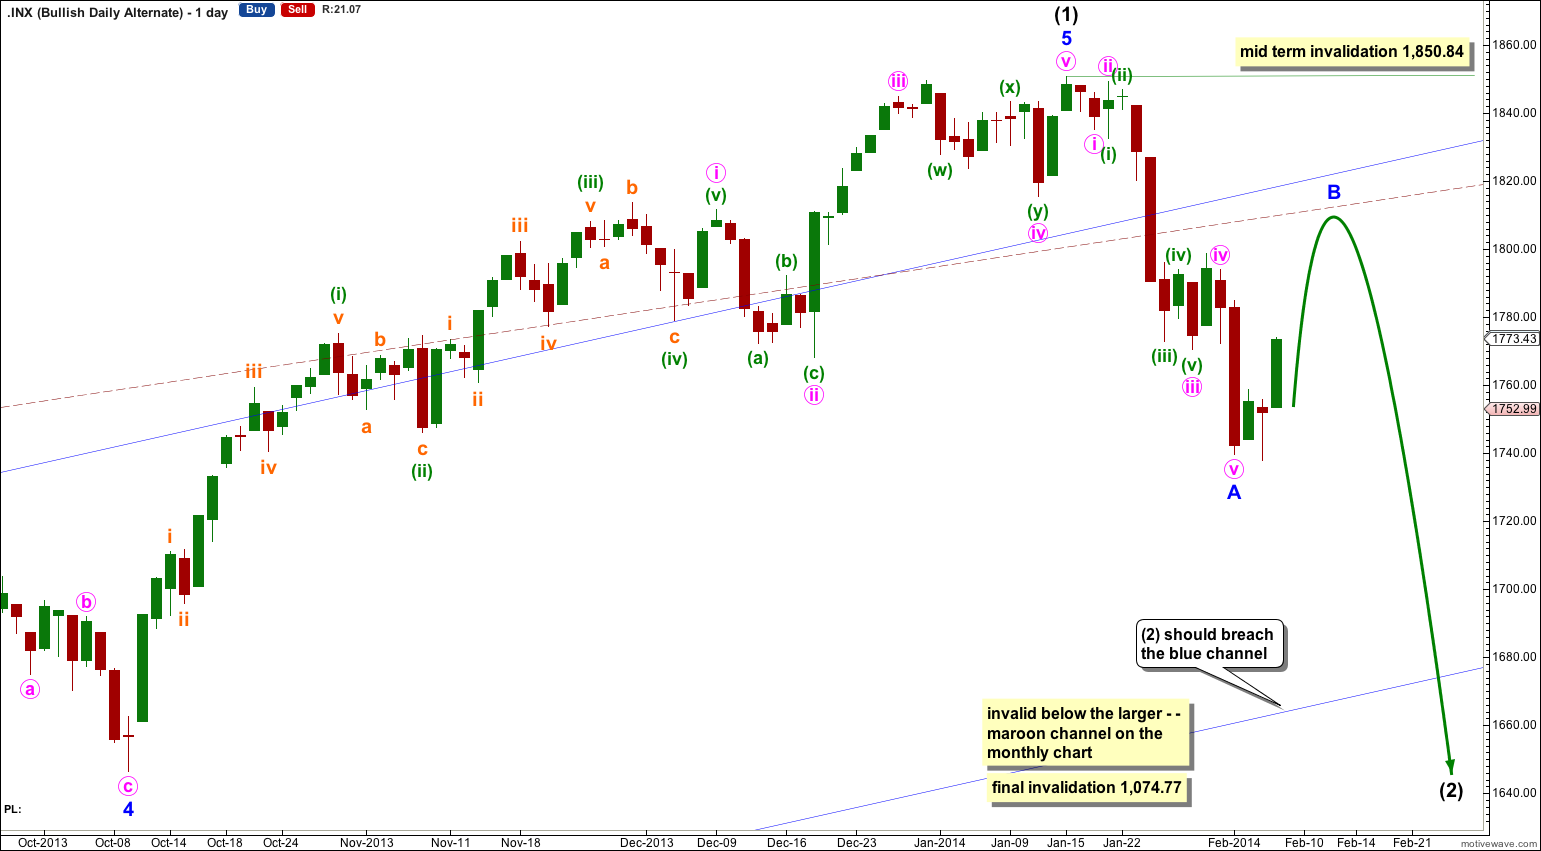
It is possible that a new cycle degree bull market began at 666.79. So far it is not yet halfway through, and I would expect it to last for a few years (at least five more years and probably longer).
At this stage this alternate bullish wave count does not diverge from the main bearish wave count, and it will not for a few to several weeks yet.
In the mid term this bullish wave count may have seen an intermediate degree trend change.
Intermediate wave (2) must subdivide as a three wave corrective structure. The first downwards movement within it must subdivide as a five and within it no second wave correction may move beyond the start of its first wave. This trend change is invalidated with any movement above 1,850.84.
Intermediate wave (2) downwards should last several weeks to a couple of months or so, and should breach the lower edge of the wide blue channel here on the daily chart.
Intermediate wave (2) should not breach support at the lower edge of the larger maroon – – – channel which is drawn the same way for both wave counts. For this alternate intermediate wave (2) should not breach the lower edge of the acceleration channel drawn about primary waves 1 and 2, one degree higher.