
I had expected a little more downwards movement to a short term target of 1,724 before the start of a new upwards trend at minor degree. This is not what happened. The new upwards trend had already arrived.
The wave count remains the same.
Summary: A minor degree second wave has just begun. I will expect choppy, overlapping movement for about one to two weeks. The target for minor wave 2 is at this stage the 0.618 Fibonacci ratio of minor wave 1 at 1,808.
Click on the charts below to enlarge.
Main Bearish Wave Count.
This wave count has a higher probability than the bullish alternate. Upwards movement over the last 4 years and 11 months subdivides best as a zigzag. If something is “off” about the supposed recovery then it must be a B wave because there is plenty that is off in this scenario in terms of social mood.
It is possible that cycle wave b is over and that there has been a trend change at cycle degree (bearish wave count) or intermediate wave degree (bullish alternate below).
There is now a clear five down on the daily chart. This is indication of a trend change, at least at intermediate degree.
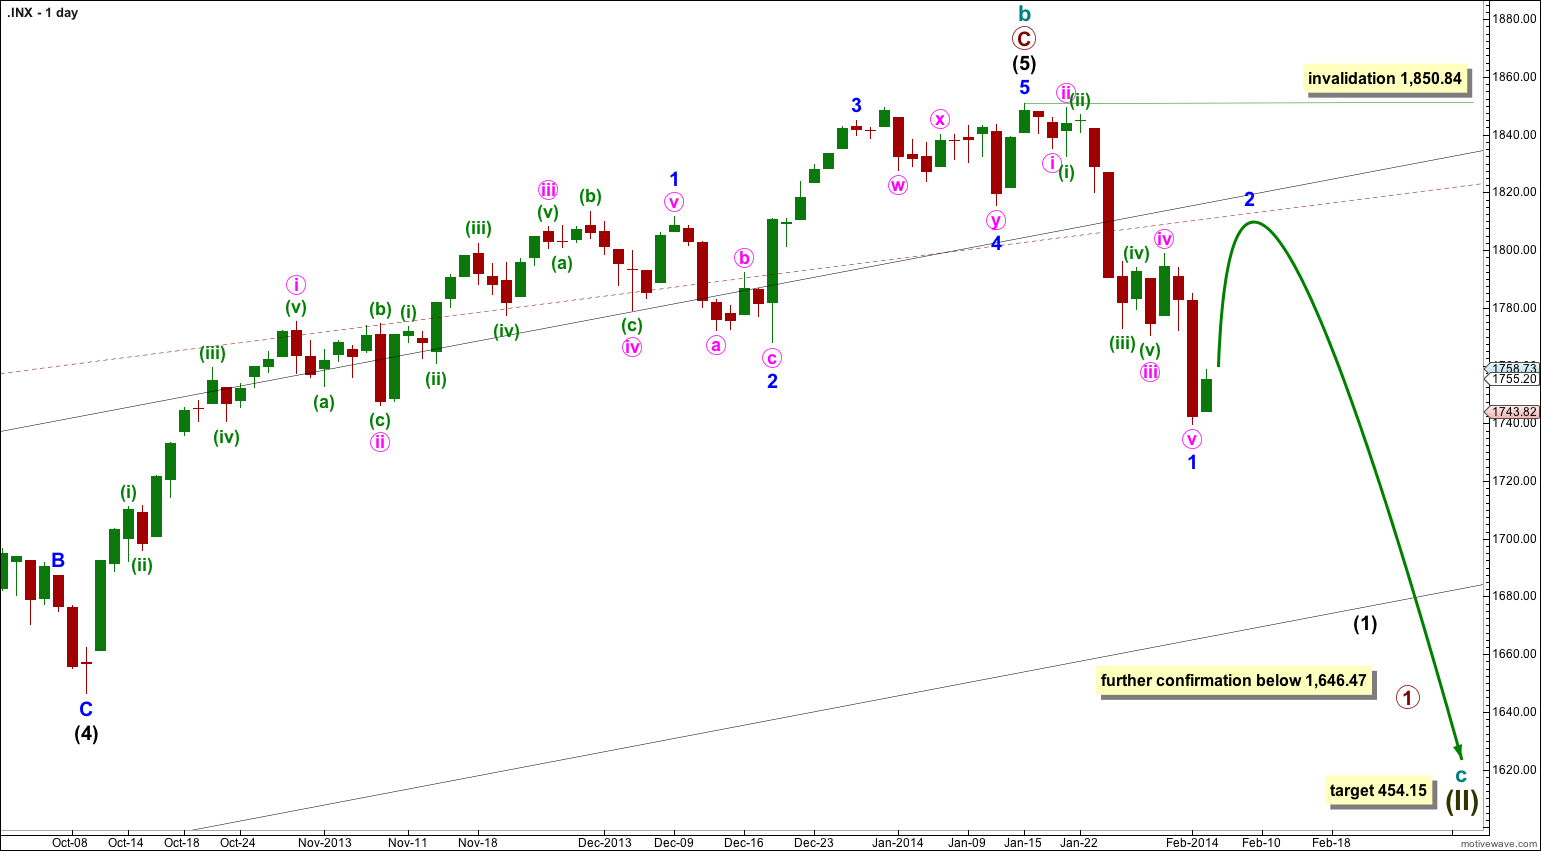
Downwards movement must move below 1,530.09 because this super cycle wave (II) must move below the high of super cycle wave (I).
Cycle wave c should last between one to several years and should take price substantially below 666.79.
At 454.15 cycle wave c would reach 1.618 the length of cycle wave a. It should subdivide as a five wave motive structure, most likely a simple impulse.
Movement below 1,646.47 would provide further confidence in a trend change, at least at intermediate wave degree.
If downwards movement breaches the maroon – – – channel on the monthly chart then I would discard the bullish alternate and this would be my only wave count.
Within cycle wave c no second wave correction may move beyond the start of its first wave. This wave count is invalidated with any movement above 1,850.84.
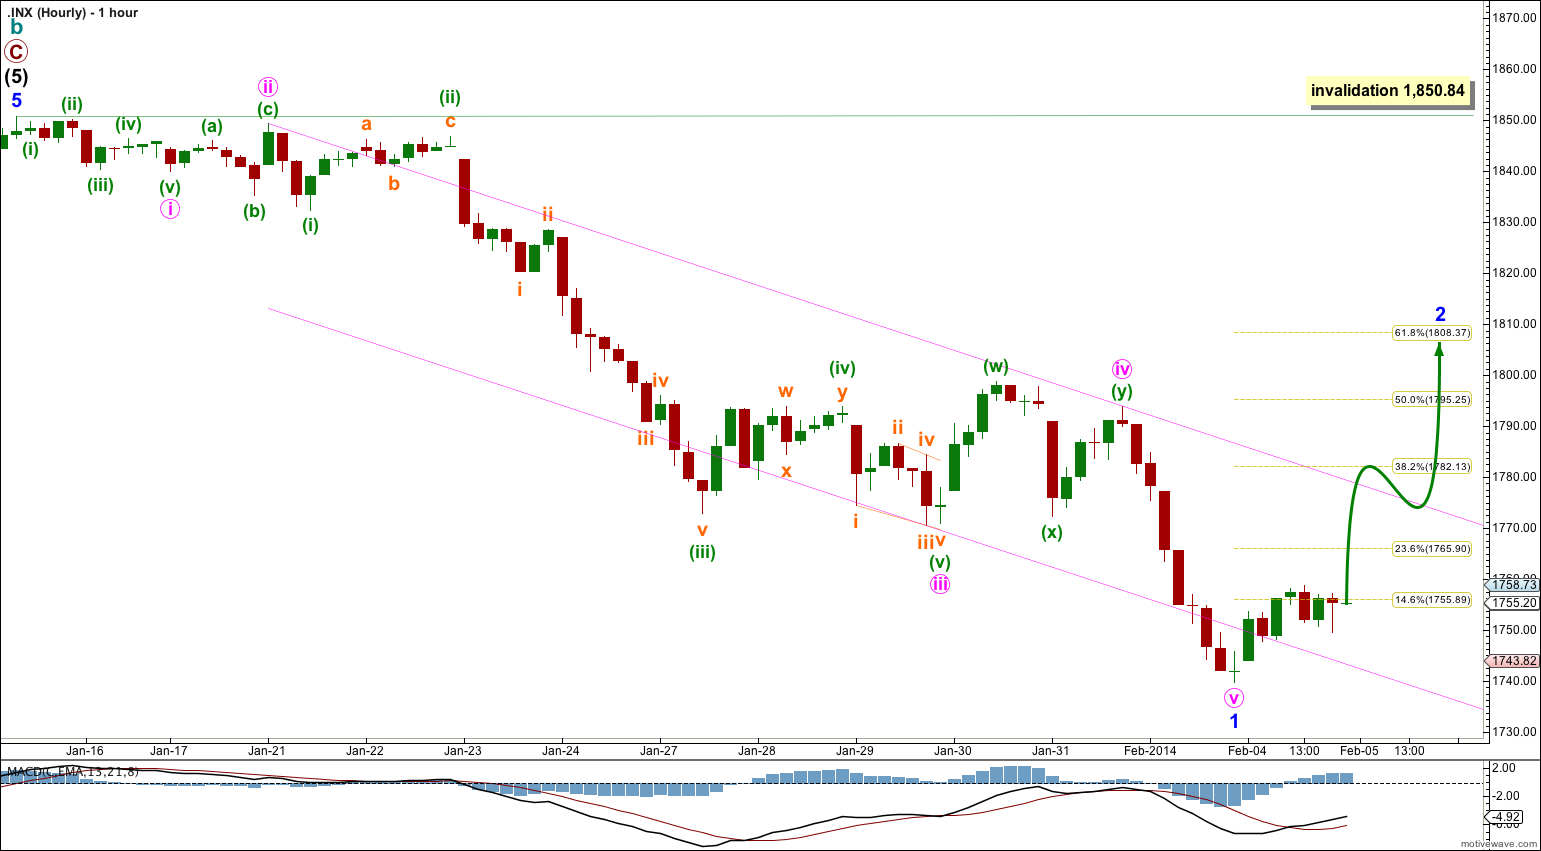
My analysis at the five minute chart level yesterday may have been wrong. Tuesday’s green candlestick on the daily chart strongly suggests that minor wave 1 is over.
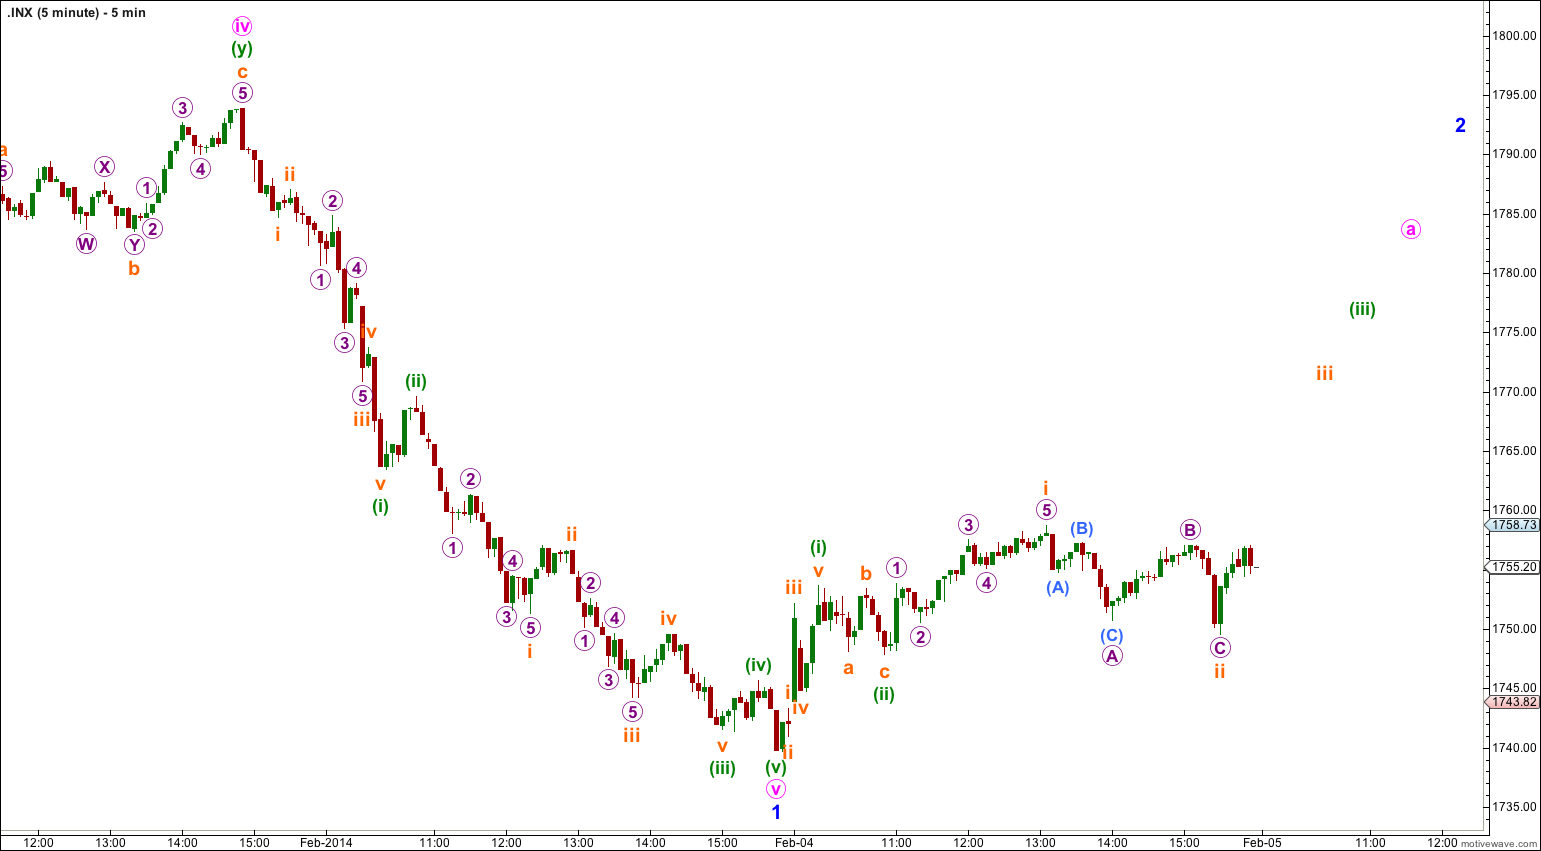
Ratios within minor wave 1 are: minute wave iii is 3.28 points longer than 6.854 the length of minute wave i, and there is no Fibonacci ratio between minute wave v and either of minute waves i or iii.
Ratios within minute wave i are: minuette wave (iii) is 0.69 points longer than 2.618 the length of minuette wave (i), and minuette wave (v) is 0.32 points longer than 0.618 the length of minuette wave (iii).
Ratios within minute wave iii are: minuette wave (iii) is 2.27 points longer than 4.236 the length of minuette wave (i), and minuette wave (v) has no Fibonacci ratio to either of minuette waves (i) or (iii).
Ratios within minuette wave (iii) of minute wave iii are: subminuette wave iii has no Fibonacci ratio to subminuette wave i, and subminuette wave v is just 0.23 points short of 0.618 the length of subminuette wave iii.
Minute wave iv subdivides as an atypical double zigzag; it is unusual in that the second zigzag in the double did not move price deeper in the corrective direction, it moved sideways more like a double combination. However, the subdivisions can fit easily as a double zigzag.
There are several different structural possibilities for minor wave 2. It is most likely to be a single or double zigzag.
If minor wave 2 unfolds as a flat correction or combination then within it there may be a new price extreme beyond its start below 1,739.66. For this reason there can be no lower invalidation point at this stage.
Minor wave 2 may not move beyond the start of minor wave 1. This wave count is invalidated with movement above 1,850.84.
Bullish Alternate Wave Count.
It is possible that a new cycle degree bull market began at 666.79. So far it is not yet halfway through, and I would expect it to last for a few years (at least five more years and probably longer).
At this stage this alternate bullish wave count does not diverge from the main bearish wave count, and it will not for a few to several weeks yet.
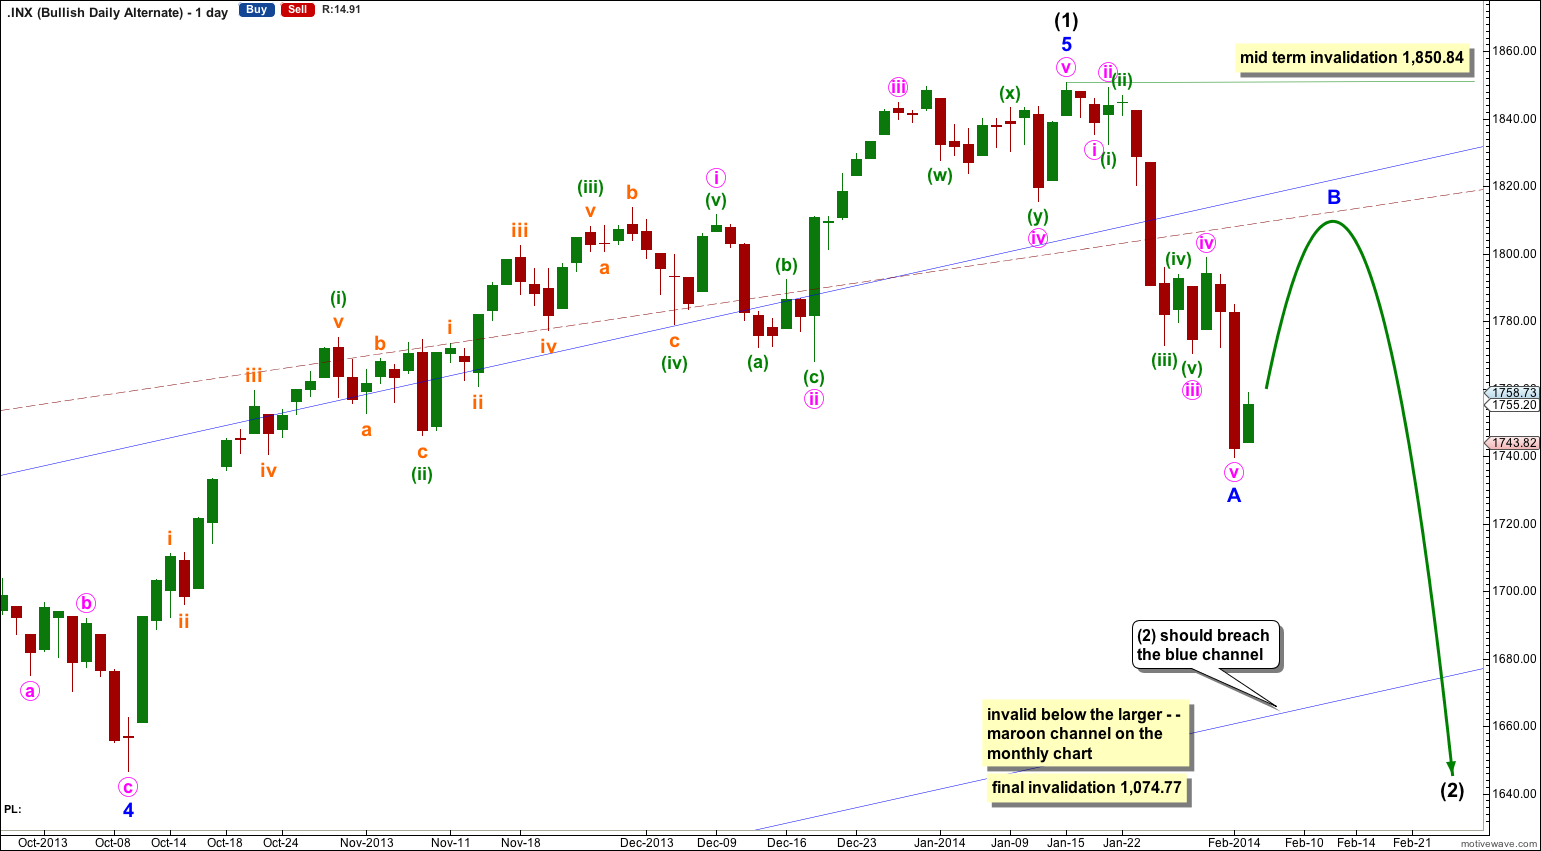
In the mid term this bullish wave count may have seen an intermediate degree trend change.
Intermediate wave (2) must subdivide as a three wave corrective structure. The first downwards movement within it must subdivide as a five and within it no second wave correction may move beyond the start of its first wave. This trend change is invalidated with any movement above 1,850.84.
Intermediate wave (2) downwards should last several weeks to a couple of months or so, and should breach the lower edge of the wide blue channel here on the daily chart.
Intermediate wave (2) should not breach support at the lower edge of the larger maroon – – – channel which is drawn the same way for both wave counts. For this alternate intermediate wave (2) should not breach the lower edge of the acceleration channel drawn about primary waves 1 and 2, one degree higher.
Hi Lara
A more bullish alternative that I believe in is that we today started the last wave 5:5 up.
Means wave 5 started the 24th of June.
Wave 5:3 started 28th of august and ended 31th of December.
5:4 ended today 5th of February and was 50% of wave 5:3.
If 5:5 will be equal to 5:1 then it will take us up to 1886 in the mid/end of March.
Could that be an alternative?
Regards
Please provide a chart of your idea. Please refer to the FAQ for why I am asking for a chart.
Thank you.
Hi Lara-
Are you sure today was not wave 4 of 5? Yesterday was clearly a wave 3 so wouldn’t today be a 4? I’m really confused on your analysis from yesterday to today as you totally forget about minuette 4 today and just assume minor 2 is underway. Wasn’t 4 of 3 a green candlestick as well???
the problem is if today was a fourth wave with minute wave v, then the counterpart second wave does not show on the daily chart, while the fourth wave does
within minute wave v the second and fourth waves should either both show on the daily chart, or neither should.
if only one and not the other shows on the daily chart then overall minute wave v would have a three wave look on the daily chart
so today’s green candlestick was very significant, and changed my wave count within minute wave v
I hope this makes sense