
I had expected a slight new high for Friday to be followed by more downwards movement. Price moved lower, but did not move any higher at the start of the session.
The wave count remains the same.
Summary: Both wave counts remain valid. Price needs to break above 1,839.89 to confirm the main wave count, or below 1,770.45 to confirm the alternate. While there has been no confirmation of a trend change we should assume the main trend is still up.
Click on the charts below to enlarge.
Main Bearish Wave Count.
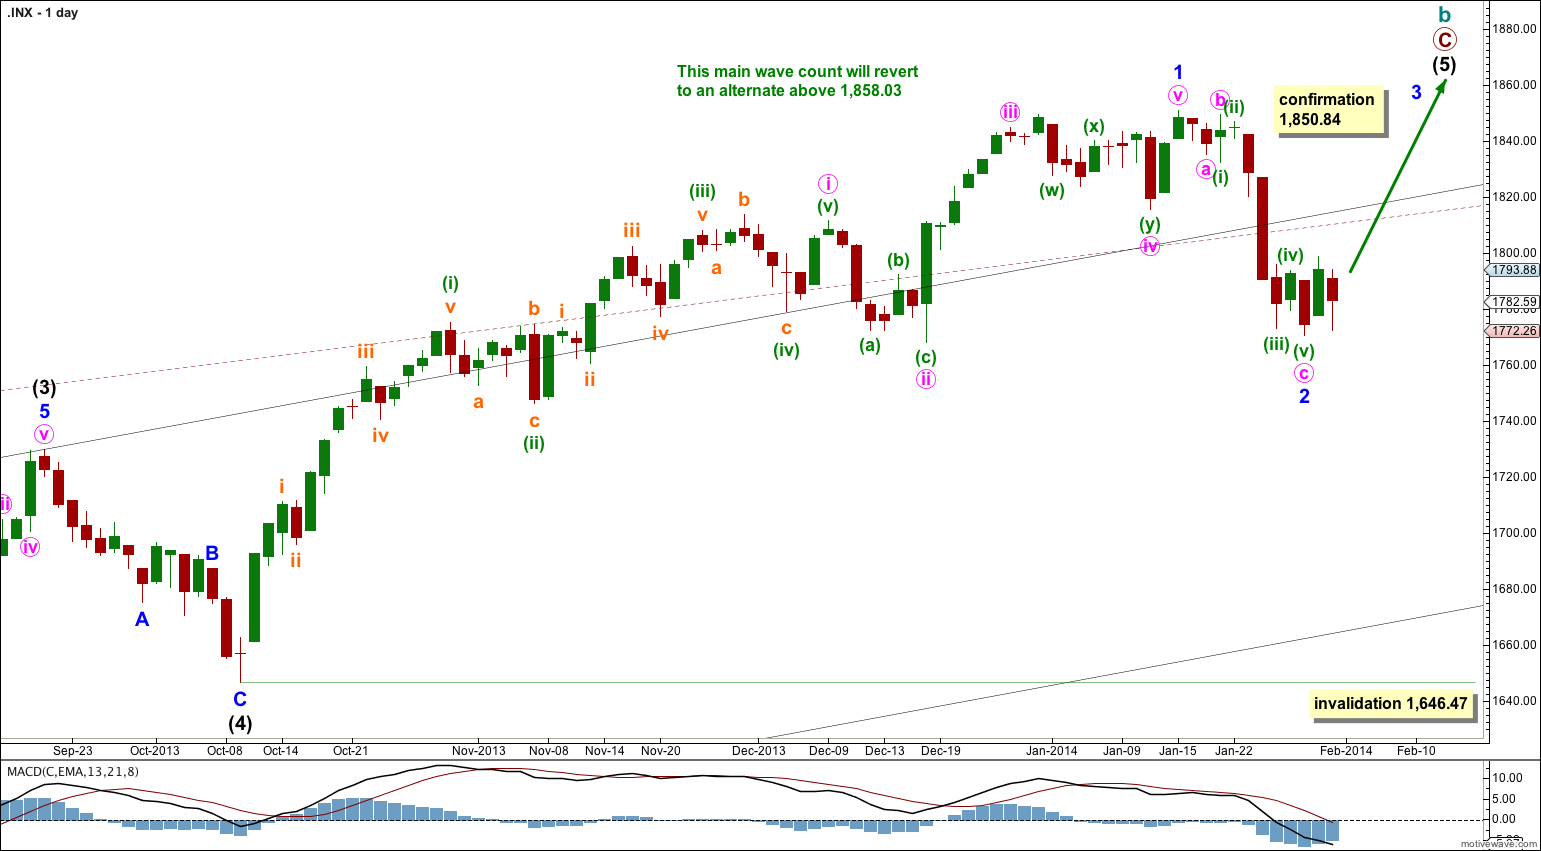
This wave count has a higher probability than the bullish alternate. Upwards movement over the last 4 years and 11 months subdivides best as a zigzag. If something is “off” about the supposed recovery then it must be a B wave because there is plenty that is off in this scenario in terms of social mood.
We should always assume that the trend remains the same until proven otherwise. While price remains above 1,646.47 and / or there is no clear five wave structure down on the daily chart, then we should assume the upwards trend is still in place.
Minor wave 2 may not move beyond the start of minor wave 1. This wave count is invalidated with movement below 1,646.47.
At super cycle degree the structure is an expanded flat correction. Within the flat the maximum common length of cycle wave b is 138% the length of cycle wave a, and this is achieved at 1,858.03. When cycle wave b is longer than the common length of cycle wave a then the probability that an expanded flat is unfolding would reduce and it would be more likely that a long term bull market is underway. Above 1,858.03 I will swap this main wave count over with the bullish alternate.
Minor wave 3 must move beyond the end of minor wave 1 above 1,850.84.
At 1,975 minor wave 3 would reach equality in length with minor wave 1. I am using this ratio to calculate the target because minor wave 2 was a relatively shallow 39% correction of minor wave 1.
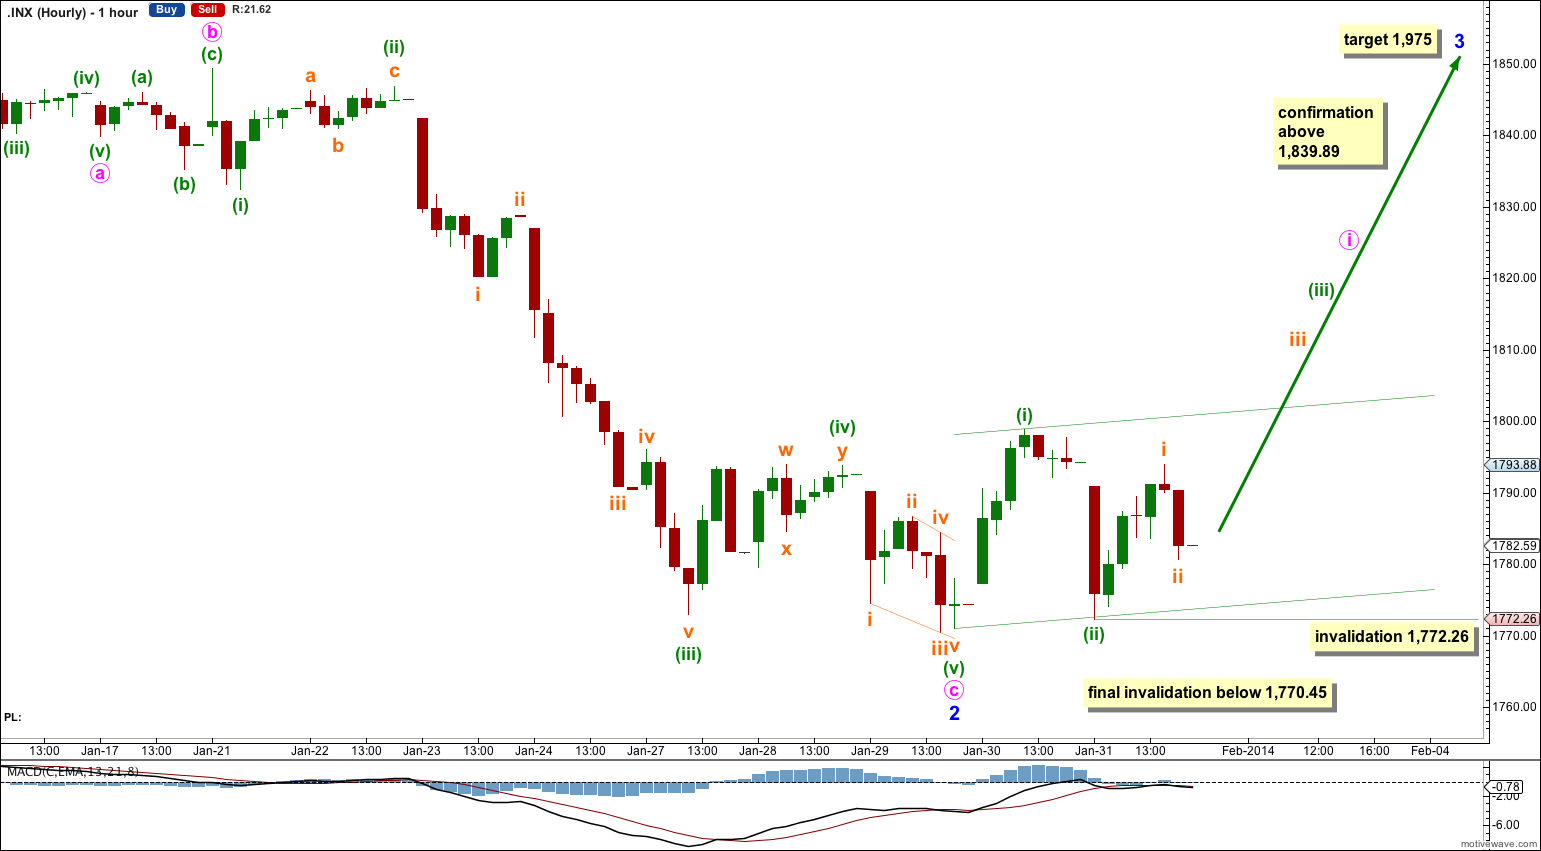
Minor wave 3 may only subdivide as a simple impulse. Within it minute wave i may be incomplete.
This wave count expects to see an increase in upwards momentum on Monday as the middle of minuette wave (iii) unfolds. Minuette wave (iii) should breach the acceleration channel containing minuette waves (i) and (ii).
Subminuette wave ii may not move beyond the start of subminuette wave i. This wave count is invalidated with movement below 1,772.26.
Movement below 1,770.45 would be final invalidation of this wave count. At that stage I would expect that this downwards movement is not just a second wave correction at minor wave degree, and it is a new bear market at either intermediate or cycle degree.
Bearish Alternate Wave Count.
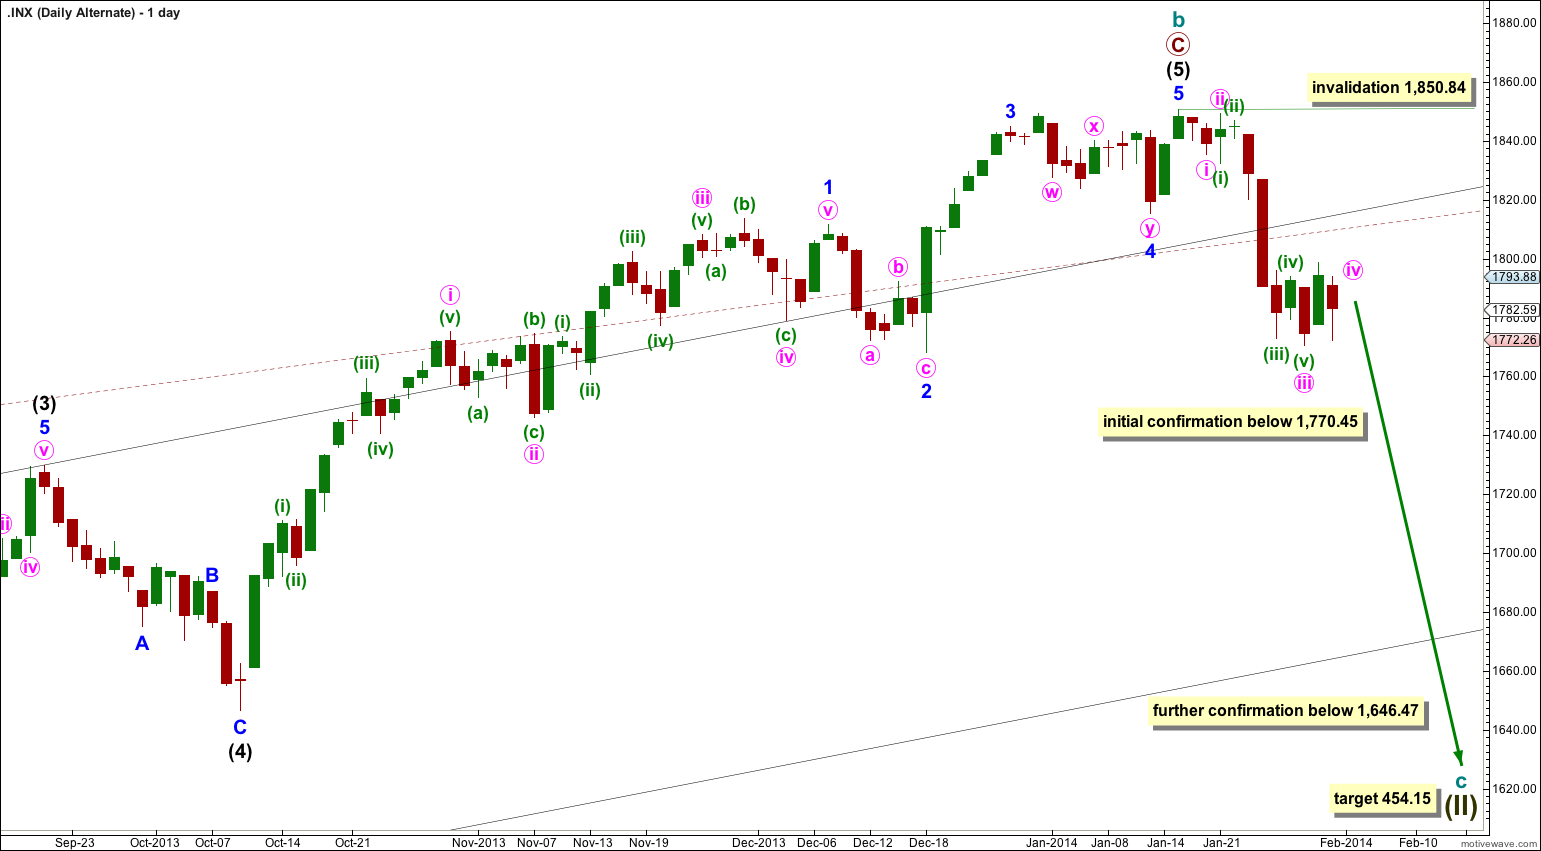
It is again possible that cycle wave b is over and that there has been a trend change at cycle degree (bearish wave count) or intermediate wave degree (bullish alternate below).
So far there is not a clear five down on the daily chart. Minute waves iv and v must complete for this to be clear. If a clear five down on the daily chart develops then this will be my main wave count.
Downwards movement must move below 1,530.09 because this super cycle wave (II) must move below the high of super cycle wave (I).
Cycle wave c should last between one to several years and should take price substantially below 666.79.
At 454.15 cycle wave c would reach 1.618 the length of cycle wave a. It should subdivide as a motive structure, most likely a simple impulse.
It is always wise to assume that the trend remains the same until proven otherwise. While price remains above 1,646.47 and / or there is no clear five down on the daily chart, then we should assume the trend remains up and this will be an alternate wave count.
There is now a clear breach of the upper edge of the black and maroon – – – channels. This increases the probability of an intermediate or cycle degree trend change.
Movement below 1,646.47 would confirm a trend change, at least at intermediate wave degree.
Within cycle wave c no second wave correction may move beyond the start of its first wave. This wave count is invalidated with any movement above 1,850.84.
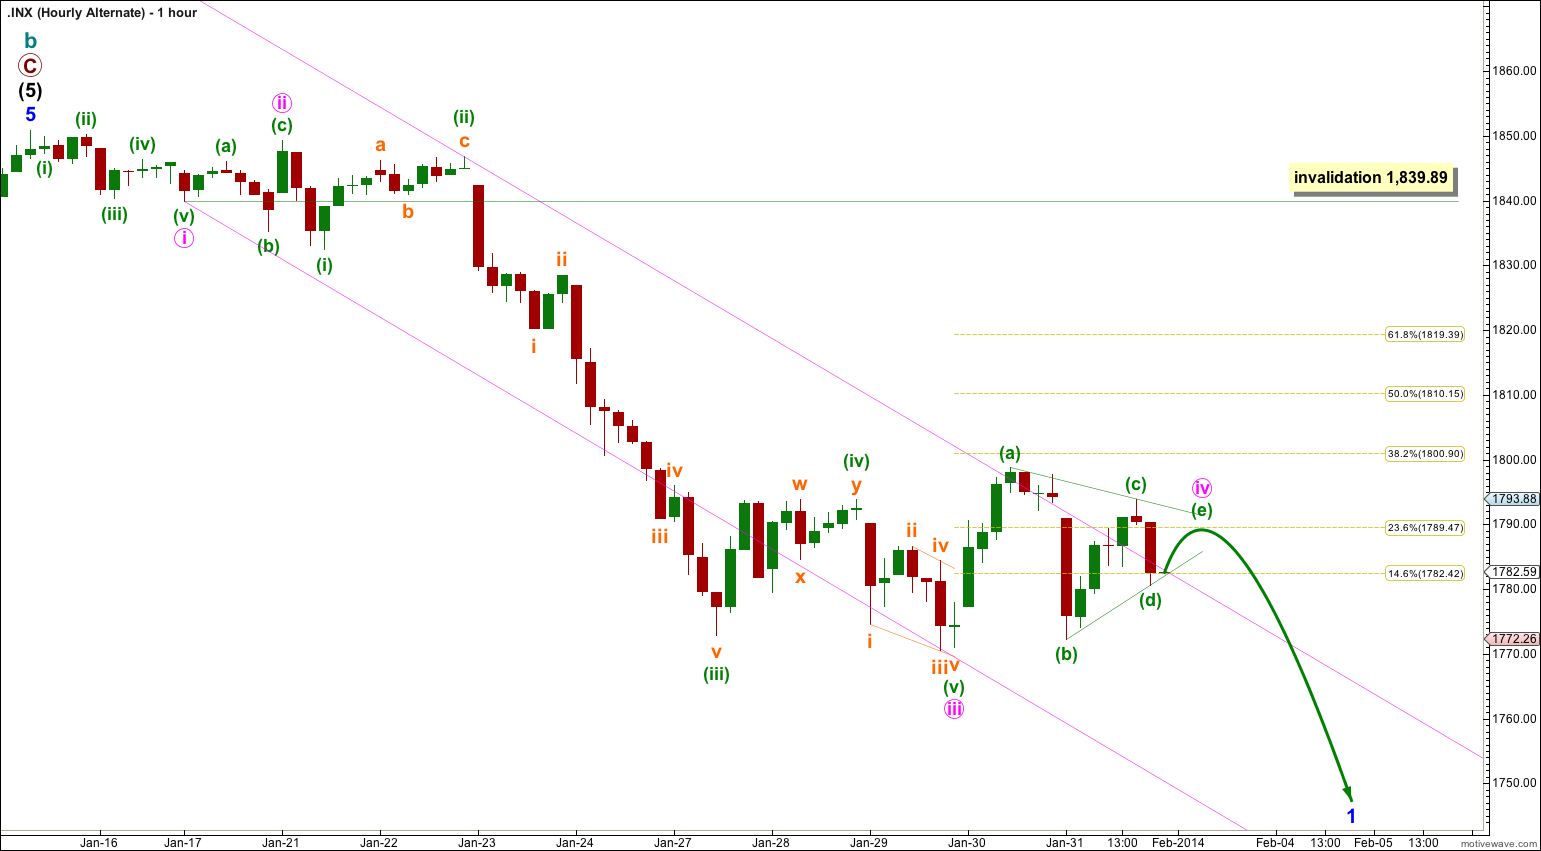
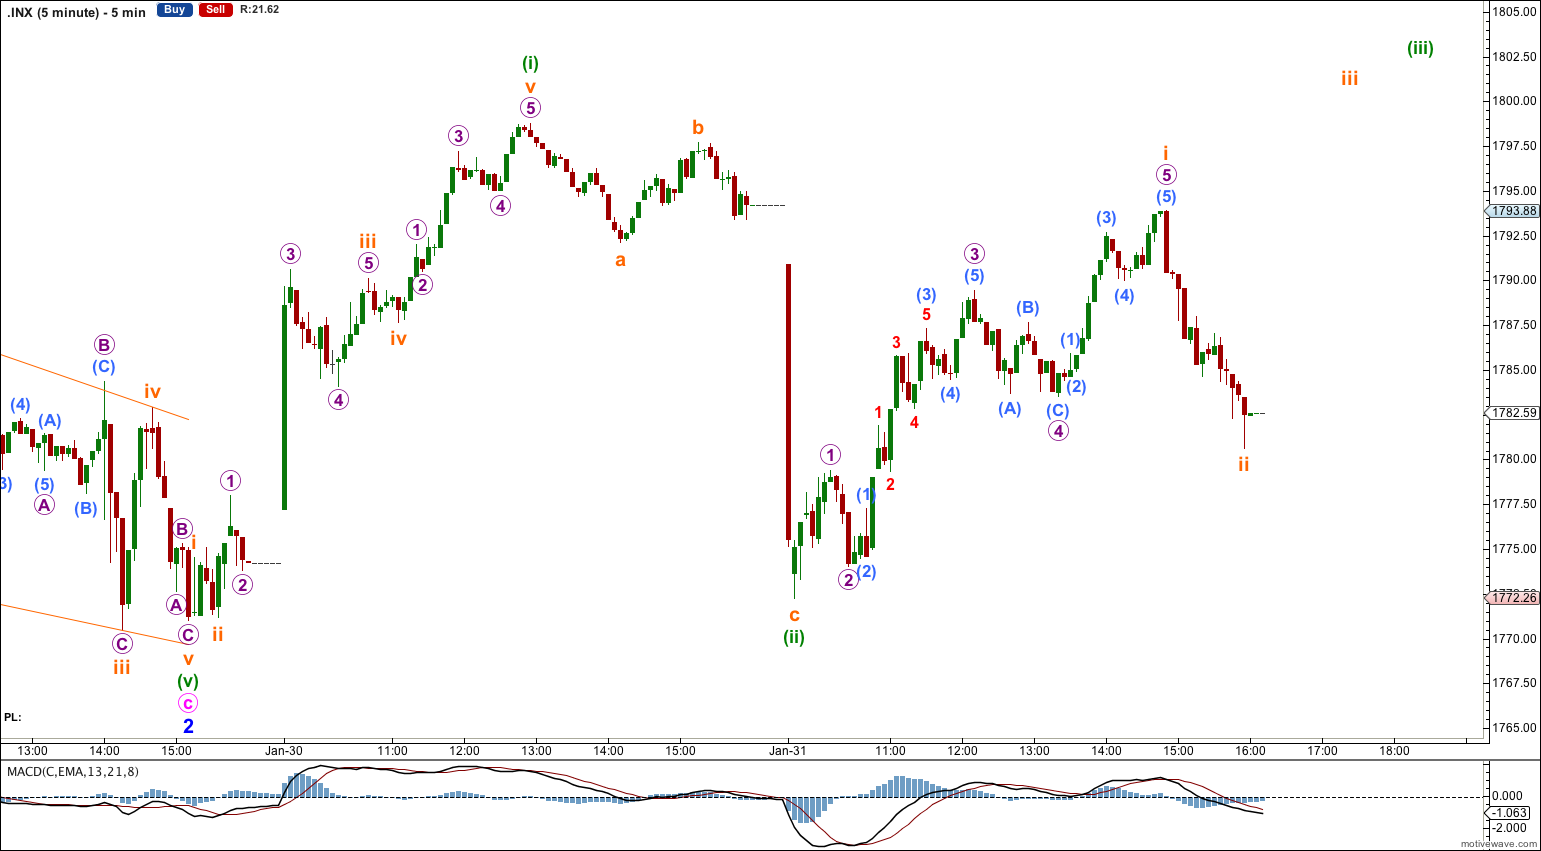
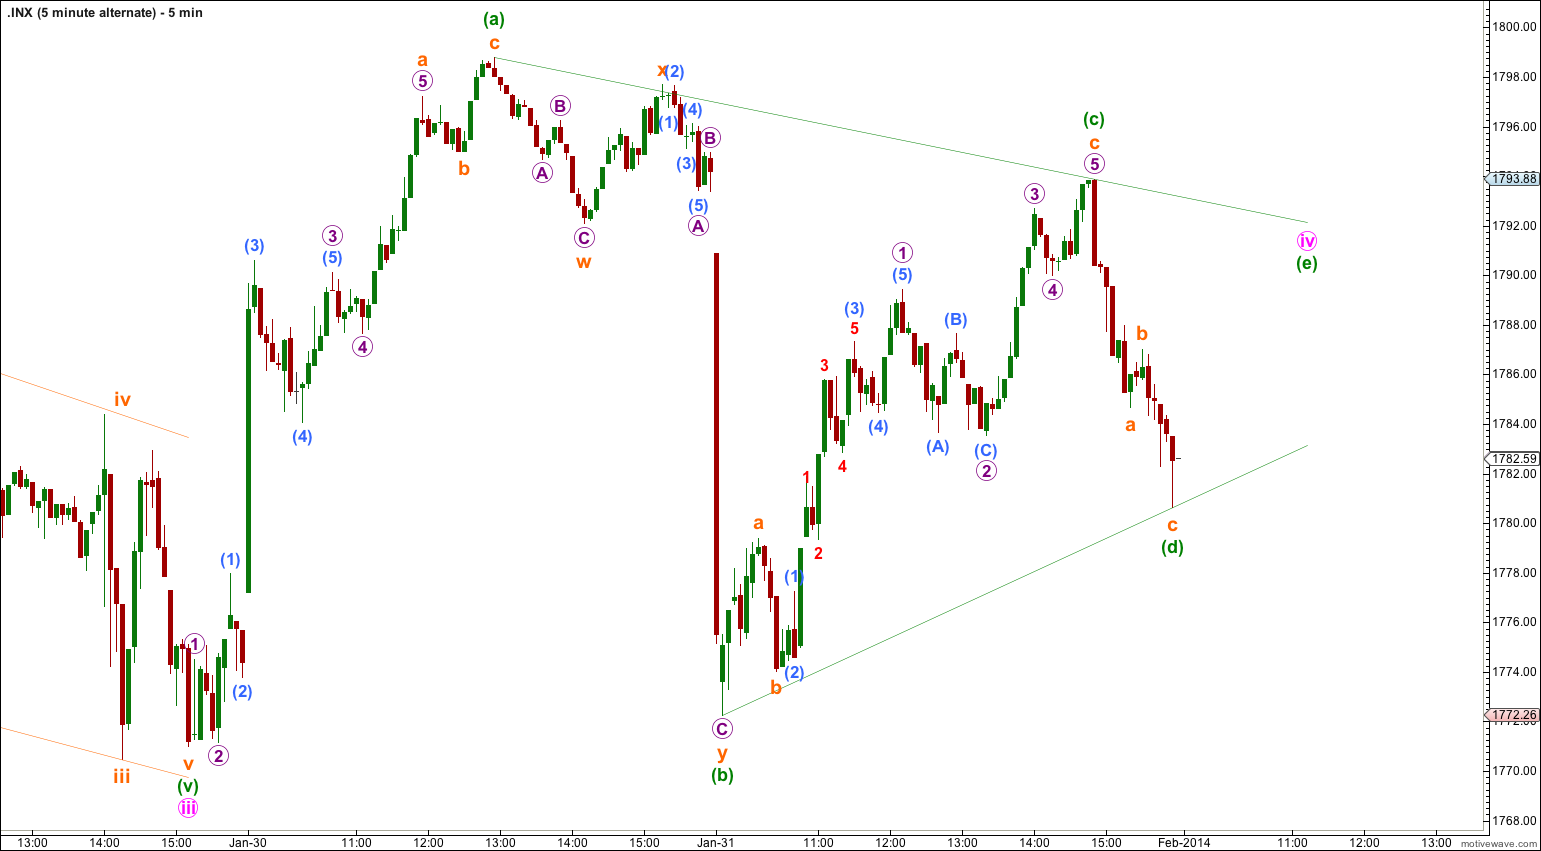
Minute wave iv would be likely to show structural alternation with minute wave ii which was a flat correction. Sideways movement for Friday’s session does not fit as a zigzag, but it could fit as a contracting triangle which is close to completion. On the five minute chart the subdivisions are ambiguous; the upwards waves labeled here minuette waves (a) and (c) can be seen as either fives or threes.
If minute wave iv is a triangle then only a little upwards movement for minuette wave (e) needs to complete. It would most likely fall a little short of the A-C trend line.
Minute wave iv may not move into minute wave i price territory. This wave count is invalidated with movement above 1,839.89.
Bullish Alternate Wave Count.
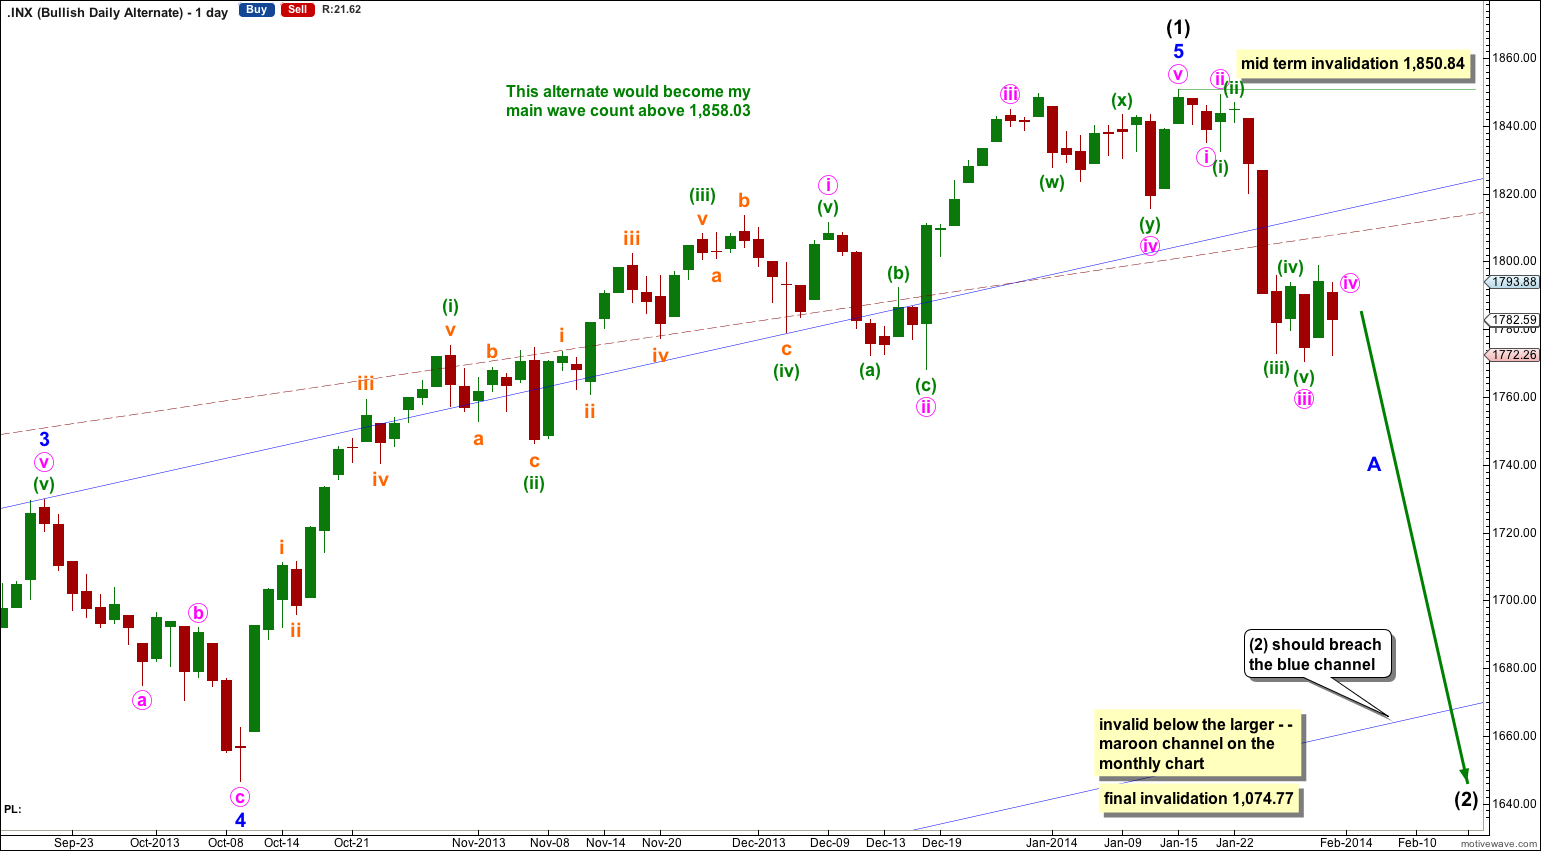
It is possible that a new cycle degree bull market began at 666.79. So far it is not yet halfway through, and I would expect it to last for a few years (at least five more years and probably longer).
In the mid term this bullish wave count may have seen an intermediate degree trend change. Intermediate wave (2) has most likely begun because price is now back in the wider blue and maroon – – – channels.
Intermediate wave (2) must subdivide as a three wave corrective structure. The first downwards movement within it must subdivide as a five and within it no second wave correction may move beyond the start of its first wave. This trend change is invalidated with any movement above 1,850.84.
Intermediate wave (2) downwards should last several weeks to a couple of months or so, and should breach the lower edge of the wide blue channel here on the daily chart.
Intermediate wave (2) should not breach support at the lower edge of the larger maroon – – – channel which is drawn the same way for both wave counts. For this alternate intermediate wave (2) should not breach the lower edge of the acceleration channel drawn about primary waves 1 and 2, one degree higher.
For me such wave 2 cannot be soooo deep.