
More downwards movement was expected to complete a red candlestick for Wednesday’s session, and this is what happened.
The wave count remains the same.
Summary: Downwards movement is almost over for now. The depth of the next upwards movement, and its structure, will tell us if there has been an intermediate or cycle degree trend change at 1,839.89.
Click on the charts below to enlarge.
Main Bearish Wave Count.
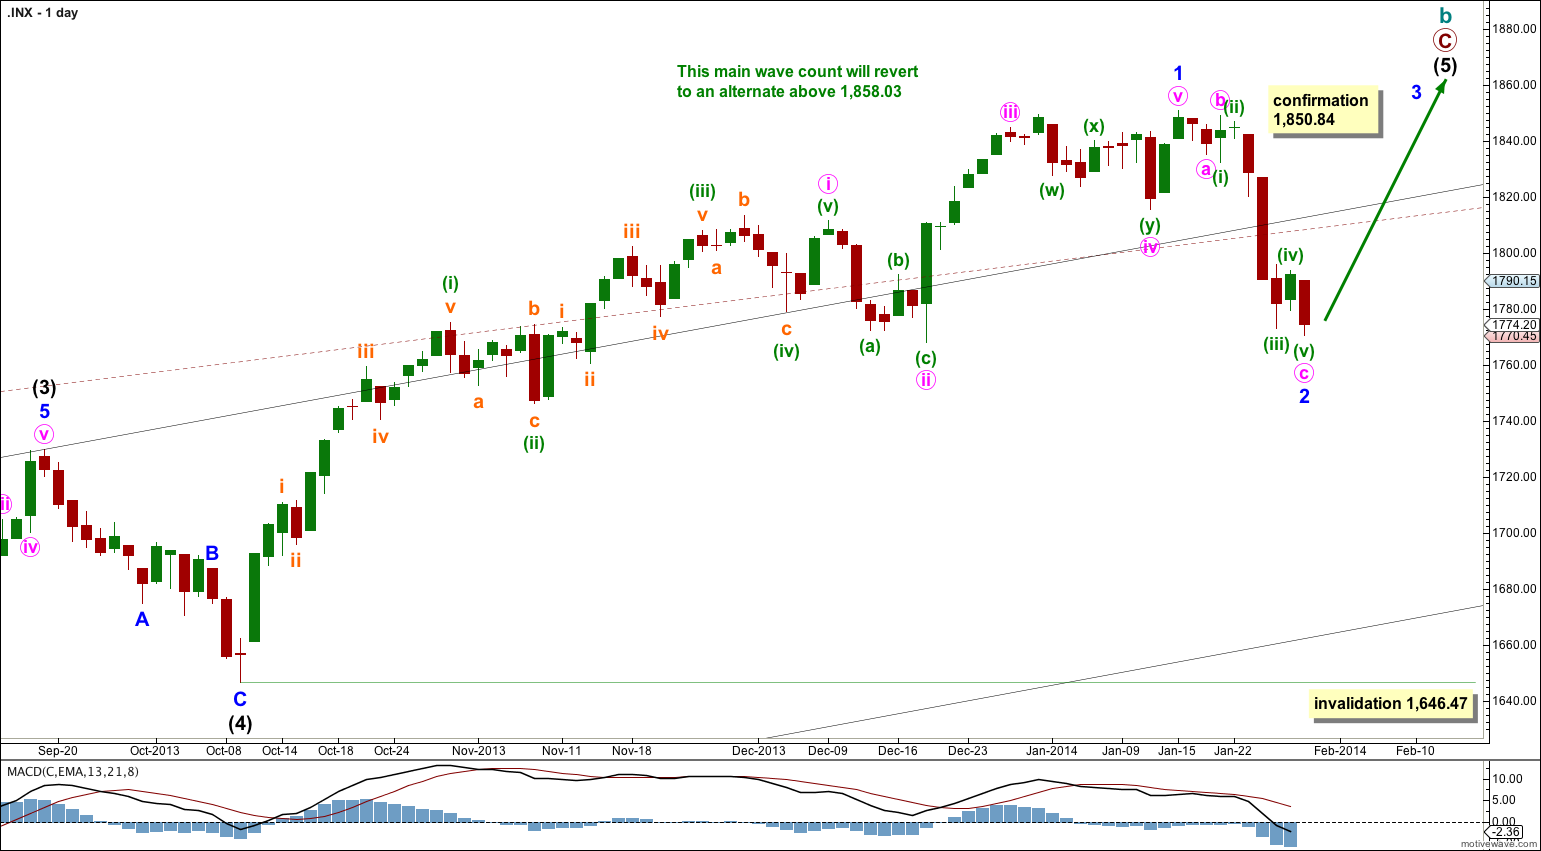
This wave count has a higher probability than the bullish alternate. Upwards movement over the last 4 years and 10 months subdivides best as a zigzag. If something is “off” about the supposed recovery then it must be a B wave because there is plenty that is off in this scenario in terms of social mood.
We should always assume that the trend remains the same until proven otherwise. While price remains above 1,646.47 we should assume the upwards trend is still in place.
The pink channel is drawn about minor wave 1 using Elliott’s first technique: draw the first trend line from the highs of minute waves i to iii, then place a parallel copy upon the low of minute wave ii. I would expect minor wave 2 to breach this channel. Minor wave 2 has now also breached the upper edges of the black and maroon – – – channels copied over from weekly and monthly charts. I had expected downwards movement to find support there. Because it did not I will give a little more weight to the alternate bearish wave count.
Minor wave 2 may not move beyond the start of minor wave 1. This wave count is invalidated with movement below 1,646.47.
At super cycle degree the structure is an expanded flat correction. Within the flat the maximum common length of cycle wave b is 138% the length of cycle wave a, and this is achieved at 1,858.03. When cycle wave b is longer than the common length of cycle wave a then the probability that an expanded flat is unfolding would reduce and it would be more likely that a long term bull market is underway. Above 1,858.03 I will swap this main wave count over with the bullish alternate.

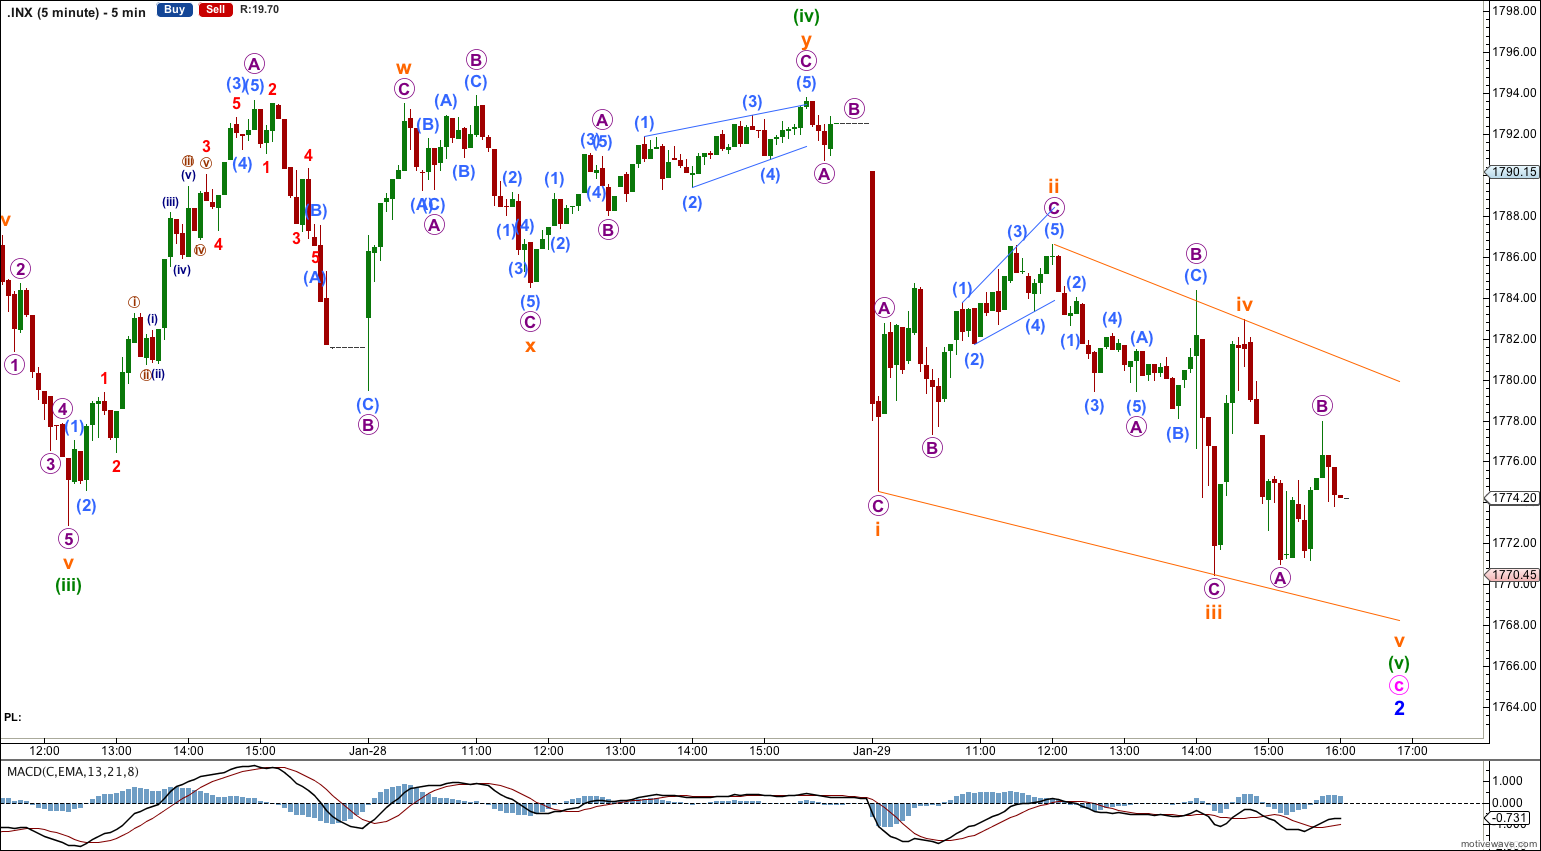
Minor wave 2 is extremely close to completion as there is almost a 5-3-5 downwards complete. At 1,766 minuette wave (v) would reach 1.618 the length of minuette wave (i). I would expect this target to be met early in tomorrow’s session.
Within minor wave 2 minute wave c has passed 4.236 the length of minute wave a, which reduces the probability of this wave count. C waves are rarely this long in relation to A waves within zigzags.
The final fifth wave of minuette wave (v) looks like it may be completing as an ending contracting diagonal; the subdivisions fit nicely on the five minute chart. Only the last part of the last zigzag down needs to complete, and this should be over quickly. Subminuette wave v is likely to end at the lower edge of the diagonal trend line.
The next upwards movement will tell us which wave count is correct. Minor wave 3 must move beyond the end of minor wave 1 above 1,850.84.
Bearish Alternate Wave Count.
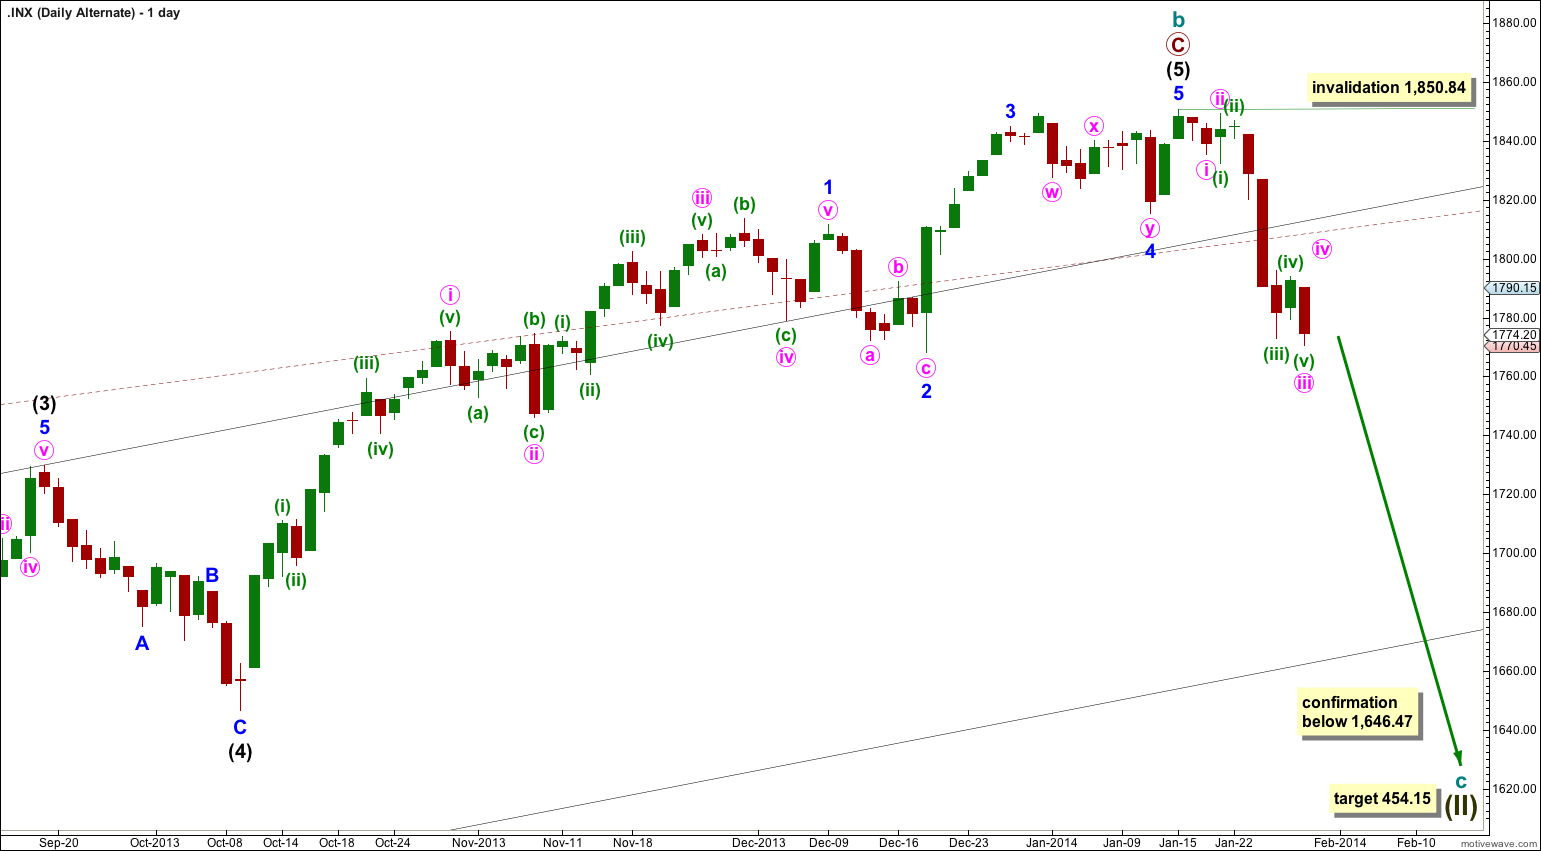
It is again possible that cycle wave b is over and that there has been a trend change at cycle degree (bearish wave count) or intermediate wave degree (bullish alternate below).
So far there is not a clear five down on the daily chart. Minute waves iv and v must complete for this to be clear. If a clear five down on the daily chart develops then this will be my main wave count.
Downwards movement must move below 1,530.09 because this super cycle wave (II) must move below the high of super cycle wave (I).
Cycle wave c should last between one to several years and should take price substantially below 666.79.
At 454.15 cycle wave c would reach 1.618 the length of cycle wave a. It should subdivide as a motive structure, most likely a simple impulse.
It is always wise to assume that the trend remains the same until proven otherwise. While price remains above 1,646.47 and / or there is no clear five down on the daily chart, then we should assume the trend remains up and this will be an alternate wave count.
There is now a clear breach of the upper edge of the black and maroon – – – channels. This increases the probability of an intermediate or cycle degree trend change.
If we see a clear five wave structure downwards on the daily chart this would become my main wave count. Movement below 1,646.47 would confirm a trend change, at least at intermediate wave degree.
Within cycle wave c no second wave correction may move beyond the start of its first wave. This wave count is invalidated with any movement above 1,850.84.
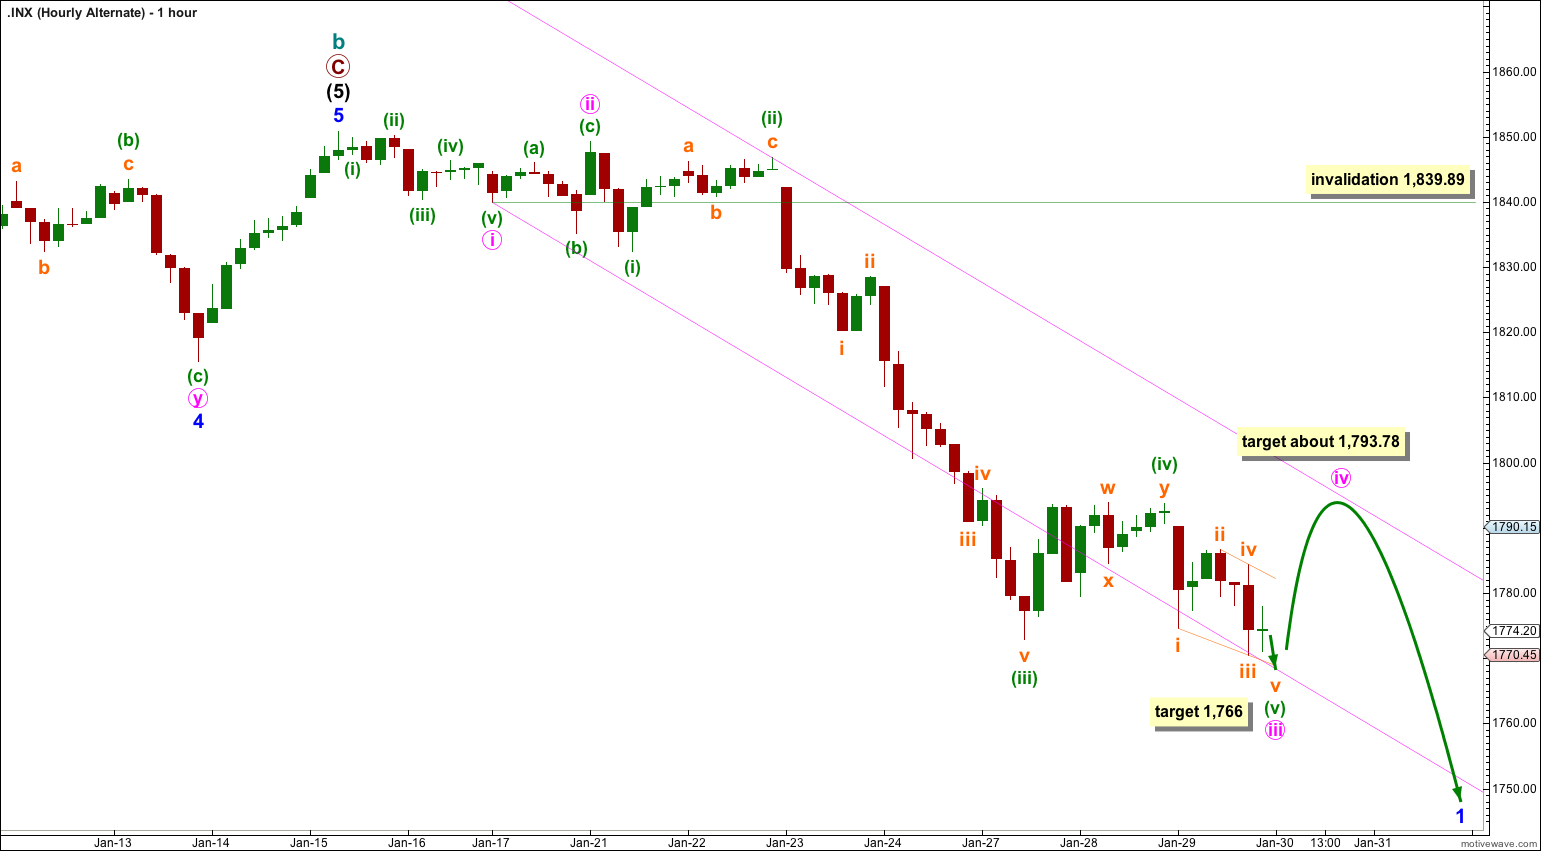
A-B-C and 1-2-3 have exactly the same subdivisions. The subdivisions on this hourly alternate are exactly the same as the main hourly wave count.
This alternate also expects a very little downwards movement to end minuette wave (v) at 1,766, and thereafter it diverges from the main hourly wave count.
Minute wave iv may not move into minute wave i price territory. This wave count is invalidated with movement above 1,839.89.
Minute wave iv would be likely to end about the end of the fourth wave of one lesser degree about 1,793.78.
I have drawn a channel about this downwards impulse (if there is a little more downwards movement tomorrow then the channel will have to be redrawn). Draw the first trend line from the lows of minute waves i to iii, then place a parallel copy upon the high of minuette wave (ii) within minute wave iii. I would expect minute wave iv to end about the upper edge of the channel.
If this wave count unfolds as expected and minor wave 1 downwards completes as a clear five then this wave count would be my main wave count.
Bullish Alternate Wave Count.
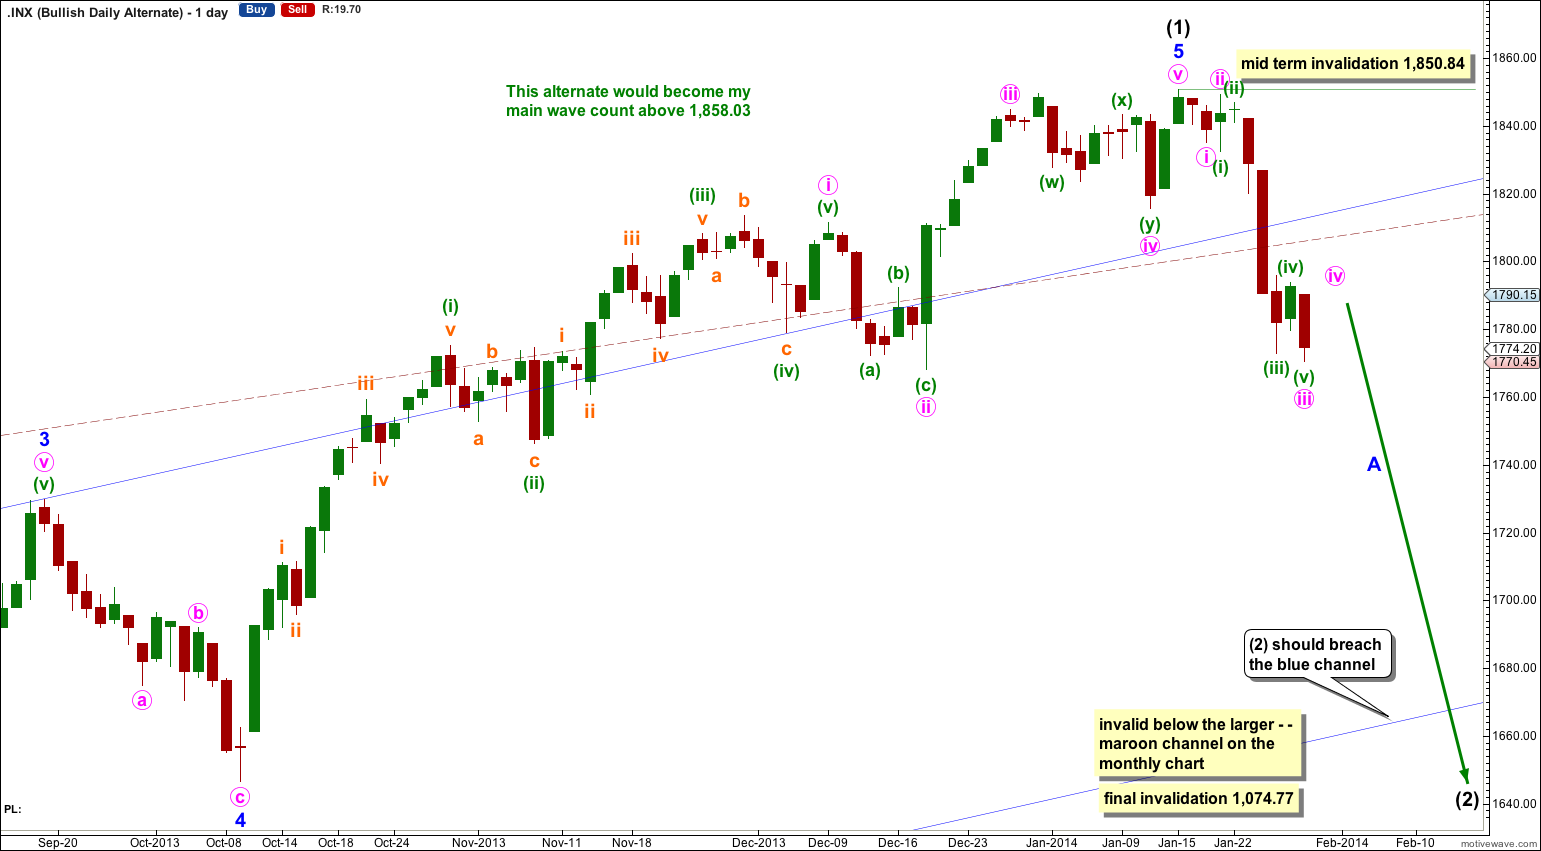
It is possible that a new cycle degree bull market began at 666.79. So far it is not yet halfway through, and I would expect it to last for a few years (at least five more years and probably longer).
In the mid term this bullish wave count may have seen an intermediate degree trend change. Intermediate wave (2) has most likely begun because price is now back in the wider blue and maroon – – – channels.
Intermediate wave (2) must subdivide as a three wave corrective structure. The first downwards movement within it must subdivide as a five and within it no second wave correction may move beyond the start of its first wave. This trend change is invalidated with any movement above 1,850.84.
Intermediate wave (2) downwards should last several weeks to a couple of months or so, and should breach the lower edge of the wide blue channel here on the daily chart.
Intermediate wave (2) should not breach support at the lower edge of the larger maroon – – – channel which is drawn the same way for both wave counts. For this alternate intermediate wave (2) should not breach the lower edge of the acceleration channel drawn about primary waves 1 and 2, one degree higher.