
Elliott Wave chart analysis for AAPL for 27th January, 2014. Please click on the charts below to enlarge.
Main Wave Count.
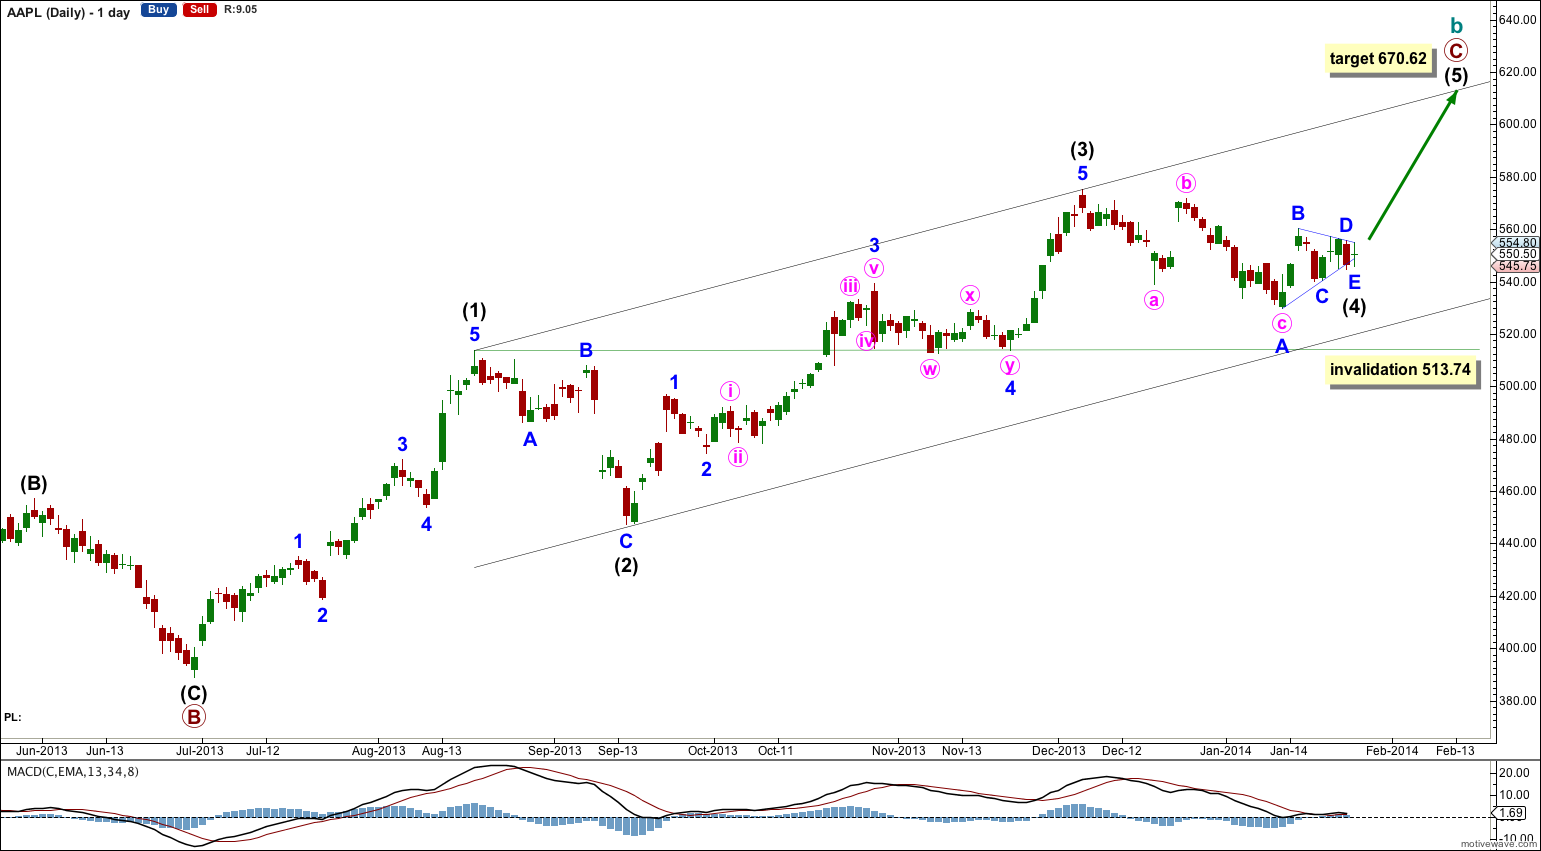
Any movement at all during regular trading hours below 513.74 would immediately invalidate this wave count. At that stage the alternate below would be confirmed.
Alternate Wave Count.
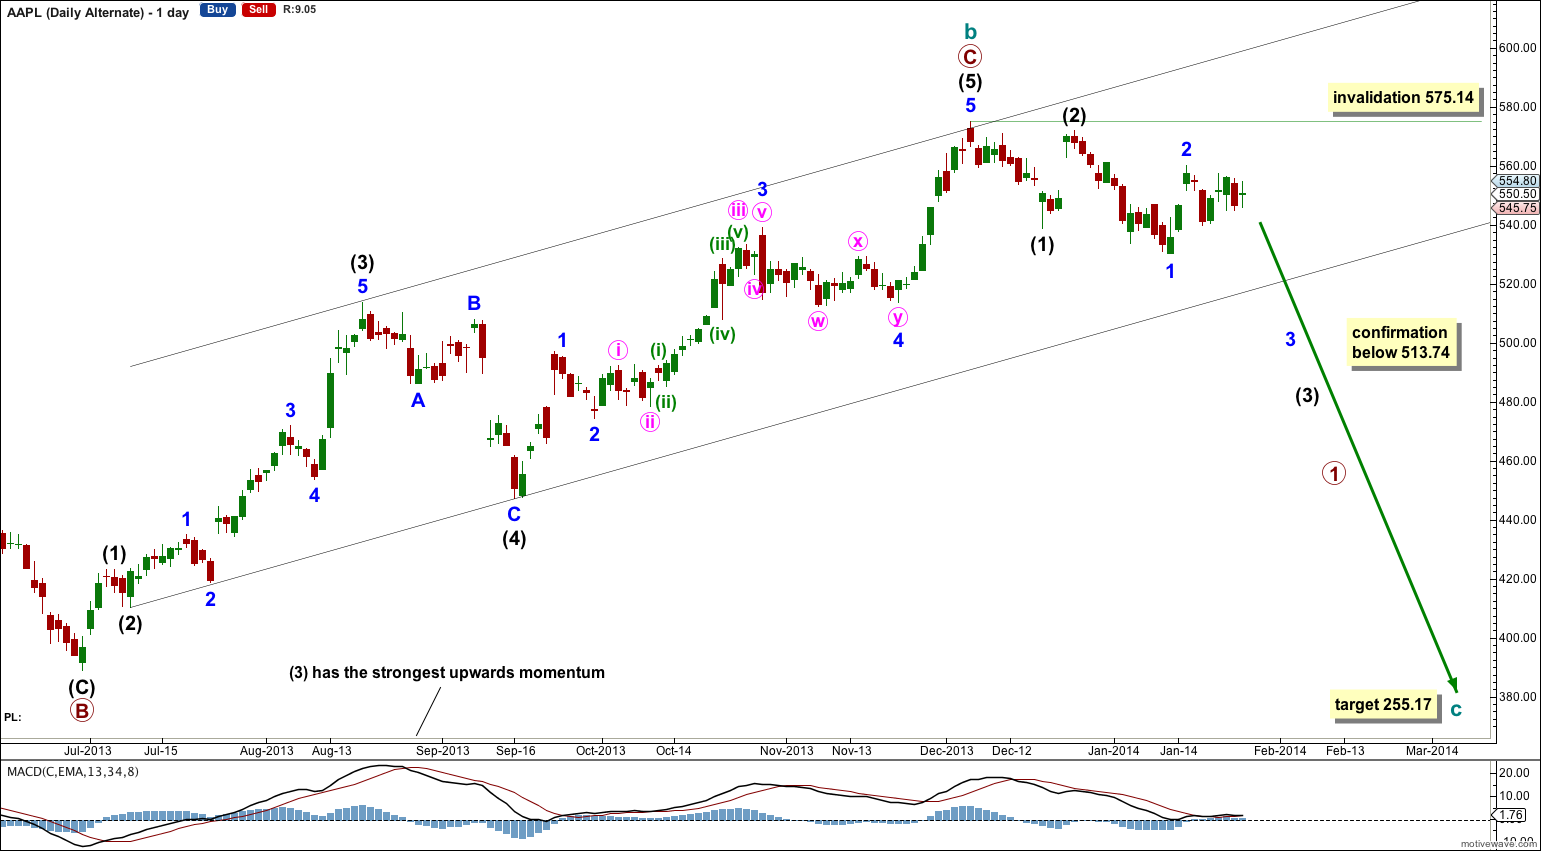
Movement below 513.74 would see further downwards movement towards a target at 255.17. This target would be about one year away.
Hi Lara
Could you please update Aapl wave counts?
Thx
Hi Lara, are you still onboard with the bearish AAPL count? It looks to me like it’s testing and maybe slightly breached the bottom of the daily channel. Is this normally a spot where you would expect a reversal back down below the 2/1 low? However, I’m having trouble counting this wave down from $575 unless it’s a bearish nest of 1’s and 2’s.
Yes I still expect AAPL is bearish. And I agree, the wave count is difficult at the moment and a nest of 1-2, 1-2 etc. fits best. Which is very bearish indeed.
I’m starting to wonder if AAPL’s decline from $575 is forming a WXY with a target between $460-$480. The decline from $575 does not look impulsive. The entire count from $705 would have to be modified. I would love to see a new post on AAPL. Thanks Lara!
I’m working on it.
It’s a horrible mess. But I think I can find something which makes sense.
What seems clearest is that a big channel about the upwards movement ending at 575 is now so clearly breached; I expect that high will remain in place.
I’m playing with a wave count which includes a truncated fifth wave at the end of the upwards movement, and a leading diagonal unfolding downwards. I’ll see how this plays out over the next few days and then I’ll be ready to publish it.
Also, would you expect the wave count to play out similarly as the previous decline? Ie…. first wave an extended deep wave or more of a rolling downward decline as it was after the first major decline which ended in Nov 2012?
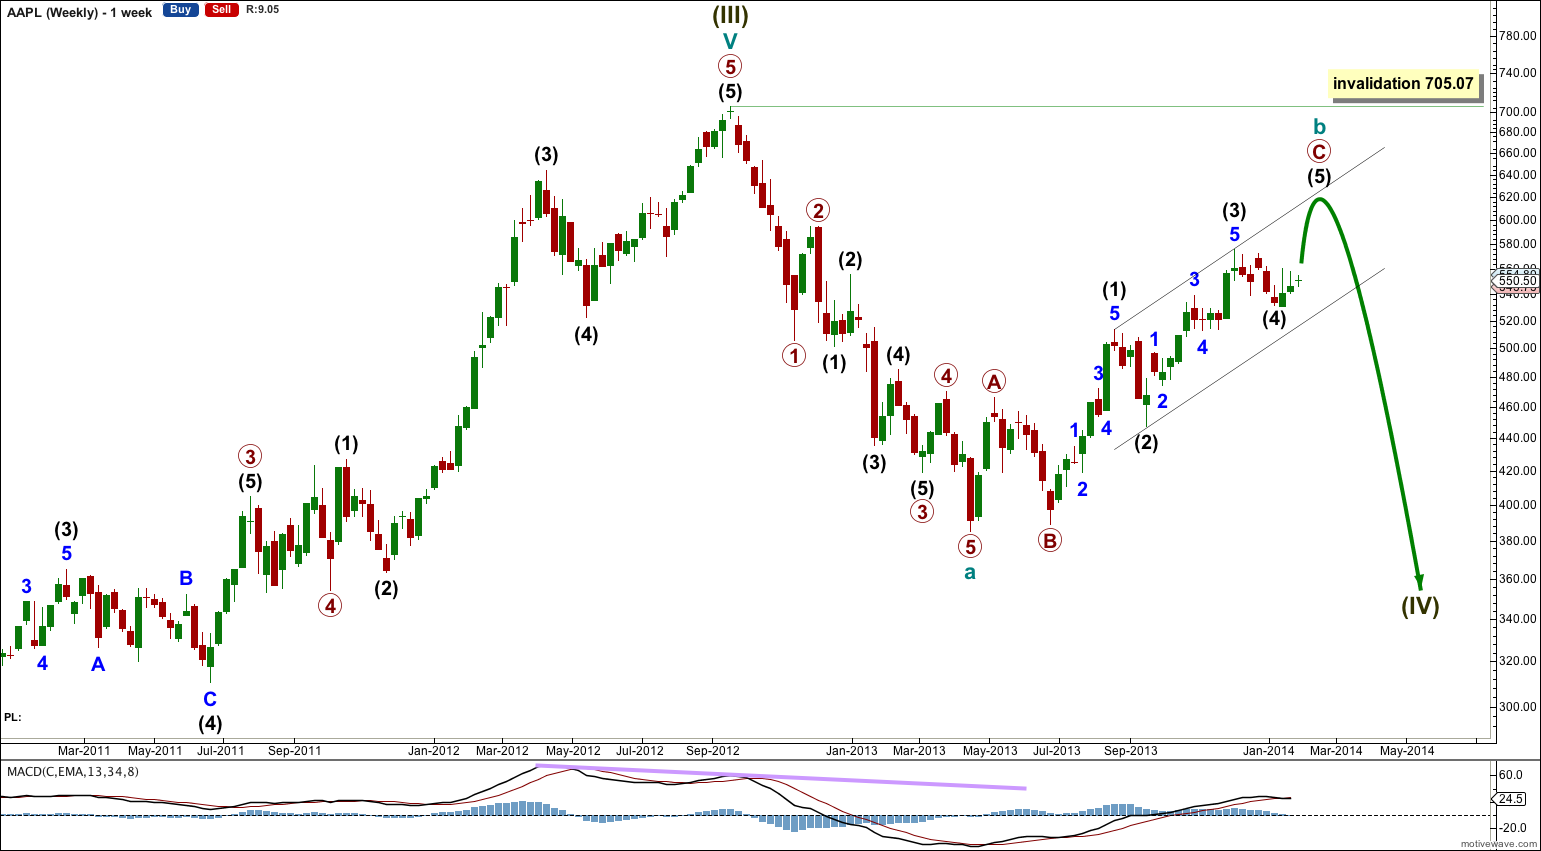
the prior decline labeled cycle a on the weekly chart had an extended third wave within it
which is the most typical wave extended within an impulse, and so I’d expect we will likely see the same here
alternatively cycle wave c could be an ending diagonal, and if so it would show alternation with the impulse of cycle wave a
next week there will be more structure of this downwards movement to analyse and I’ll begin to calculate shorter term targets
As the charts above show, my main wave count was invalidated and my alternate wave count confirmed with movement below 513.74.
At that stage my analysis expects more downwards movement. My target is 255.17.
Hi Lara,
so this would be wave one of five we are still in?
Do you have a target for the end of wave one?
At this stage I don’t have a target, no. It would be the end of a first wave.
I dont do Elliot wave I rally mostly on Indicators rather then Elliot wave counting which never gives any signals… I have predicted a fall few weeks ago with 3 major indicators that were showing the big downside is on the way #1 MACD turned Negative #2 61% retracement held and biggest of all were 2 bearish hammer down chandelles which apple closed last 2 weeks. MY target for low 300$ is coming and will unfold within 6 months. HAVE FUN!!! You still believe APPLE will go to $600? I do but not before hitting $300