
The short term target provided in last analysis was 1,827 to 1,828. It was expected to be reached during Monday’s session, and price has reached up just 1.75 points above the target.
The wave counts remain the same.
Click on the charts below to enlarge.
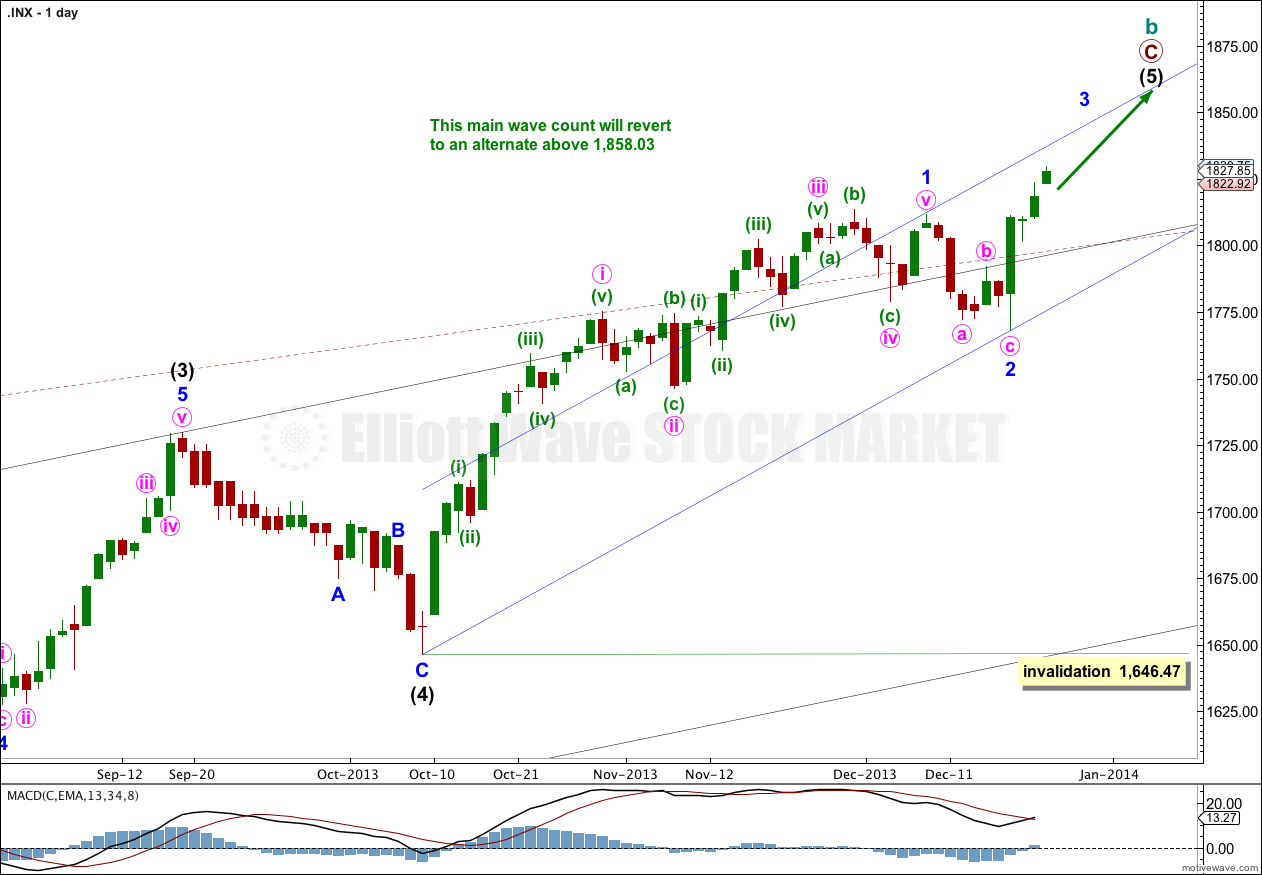
This wave count has a higher probability than the bullish alternate. Upwards movement over the last 4 1/2 years subdivides best as a zigzag. If something is “off” about the supposed recovery then it must be a B wave because there is plenty that is off in this scenario in terms of social mood.
We should always assume the trend remains the same, until proven otherwise. This is a huge trend change. I will assume we are yet to see new highs while price remains above 1,646.47.
Minor waves 1 and now also 2 are most likely complete. Minor wave 3 upwards may have begun. I have drawn an acceleration channel about minor waves 1 and 2. Minor wave 3 upwards should break through resistance at the upper trend line. The lower trend line should provide support for corrections within minor wave 3.
We may be about to see a larger fractal at minor wave degree of the structure within minor wave 1 at minute wave degree; there the first wave was extended, the third wave was shorter, and the fifth wave was shorter still.
However, the structure unfolding on the hourly chart suggests that 1,870 may be too high. When there is more structure on the hourly chart I will recalculate the target at minute wave degree. I cannot do that yet. This target may change.
Intermediate wave (3) is just 0.76 points short of 2.618 the length of intermediate wave (1). We may not see a Fibonacci ratio between intermediate wave (5) and either of (3) or (1).
Intermediate wave (1) lasted 18 days. So far intermediate wave (5) has lasted 53 days. If it is continuing it may last a total of a Fibonacci 89 days which would see it end on 10th February, 2014. However, Fibonacci time relationships are not very reliable for the S&P. This is a rough guideline only,
At super cycle degree the structure is an expanded flat correction. Within the flat the maximum common length of cycle wave b is 138% the length of cycle wave a, and this is achieved at 1,858.03. When cycle wave b is longer than the common length of cycle wave a then the probability that an expanded flat is unfolding would reduce and it would be more likely that a long term bull market is underway. Above 1,858.03 I will swap this main wave count over with the bullish alternate.
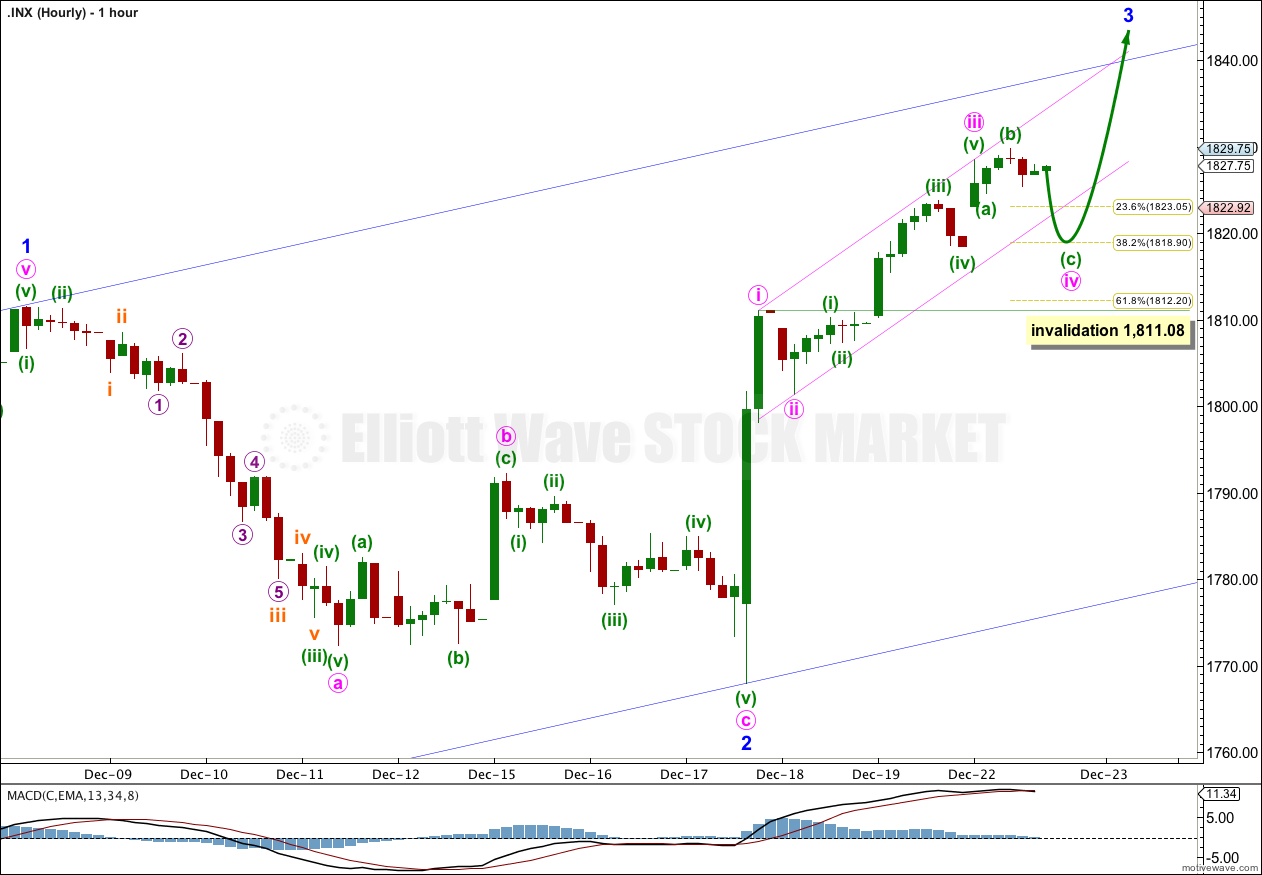
Minute wave iii is now complete. It was just 0.53 points longer than 0.618 the length of minute wave i.
Minute wave iv may end about the lower edge of the parallel channel containing minor wave 3, or it may overshoot the channel. Draw this channel with the first trend line from the highs of minute waves i to iii, then place a parallel copy upon the low of minute wave ii.
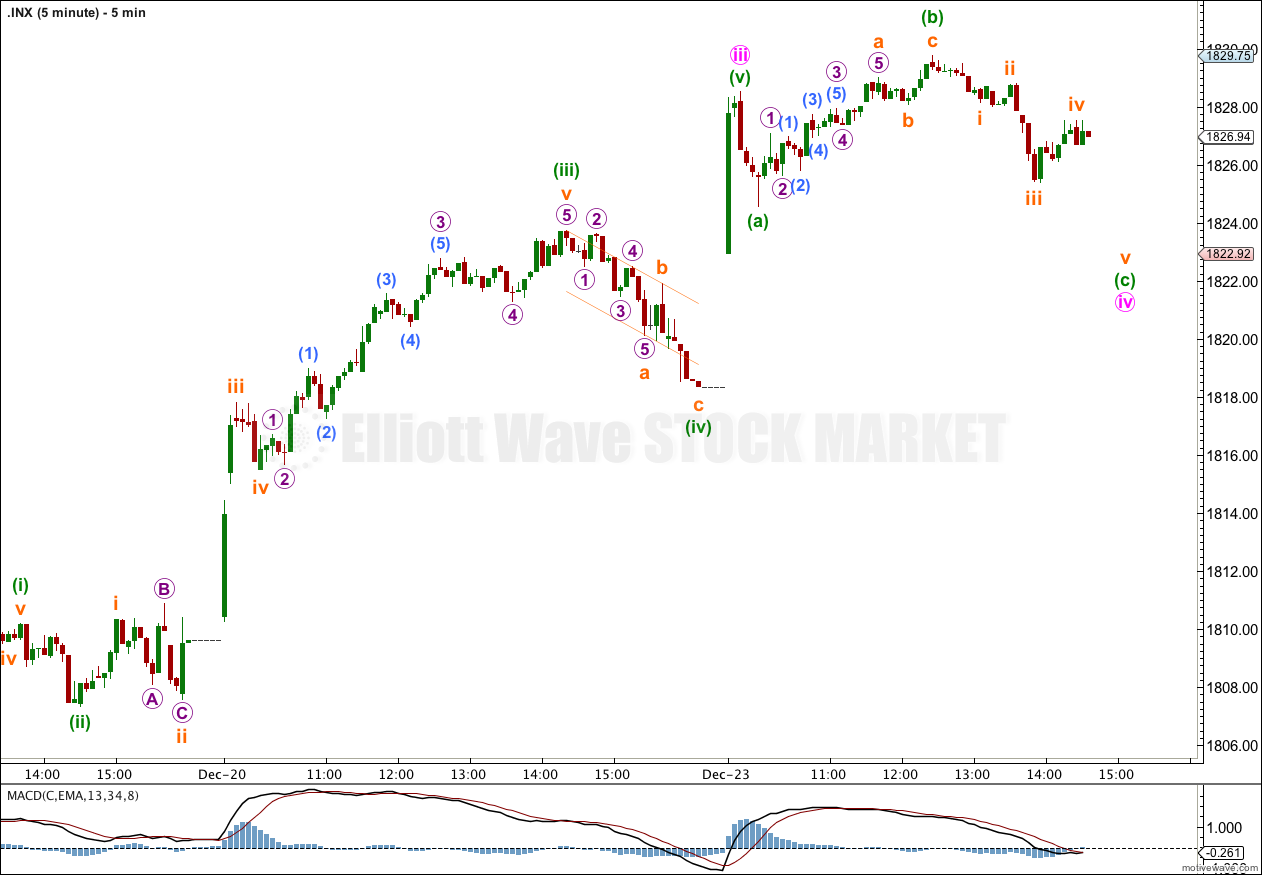
Minute wave ii was a very brief and shallow at just 23%. So far it looks like minute wave iv may be unfolding as an expanded flat correction.
The target for this fourth wave is about 1,819 where minuette wave (c) would reach 2.618 the length of minuette wave (a), and minute wave iv would reach the 0.382 Fibonacci ratio. This target would see minute wave iv end within the price territory of the fourth wave of one lesser degree (minuette wave (iv) price territory is from 1,823.75 to 1,818.31).
Minute wave iv may not move into minute wave i price territory. This wave count is invalidated with movement below 1,811.08.
When minute wave iv is completed then I would expect more upwards movement to new highs for minute wave v.
At this stage it looks like minor wave 3 may not exhibit a Fibonacci ratio to minor wave 1. When minute wave iv within minor wave 3 is completed then I will use minute wave degree to calculate a target for minor wave 3 to end. I would expect minor wave 3 to breach the upper blue trend line.
Bullish Alternate Wave Count.
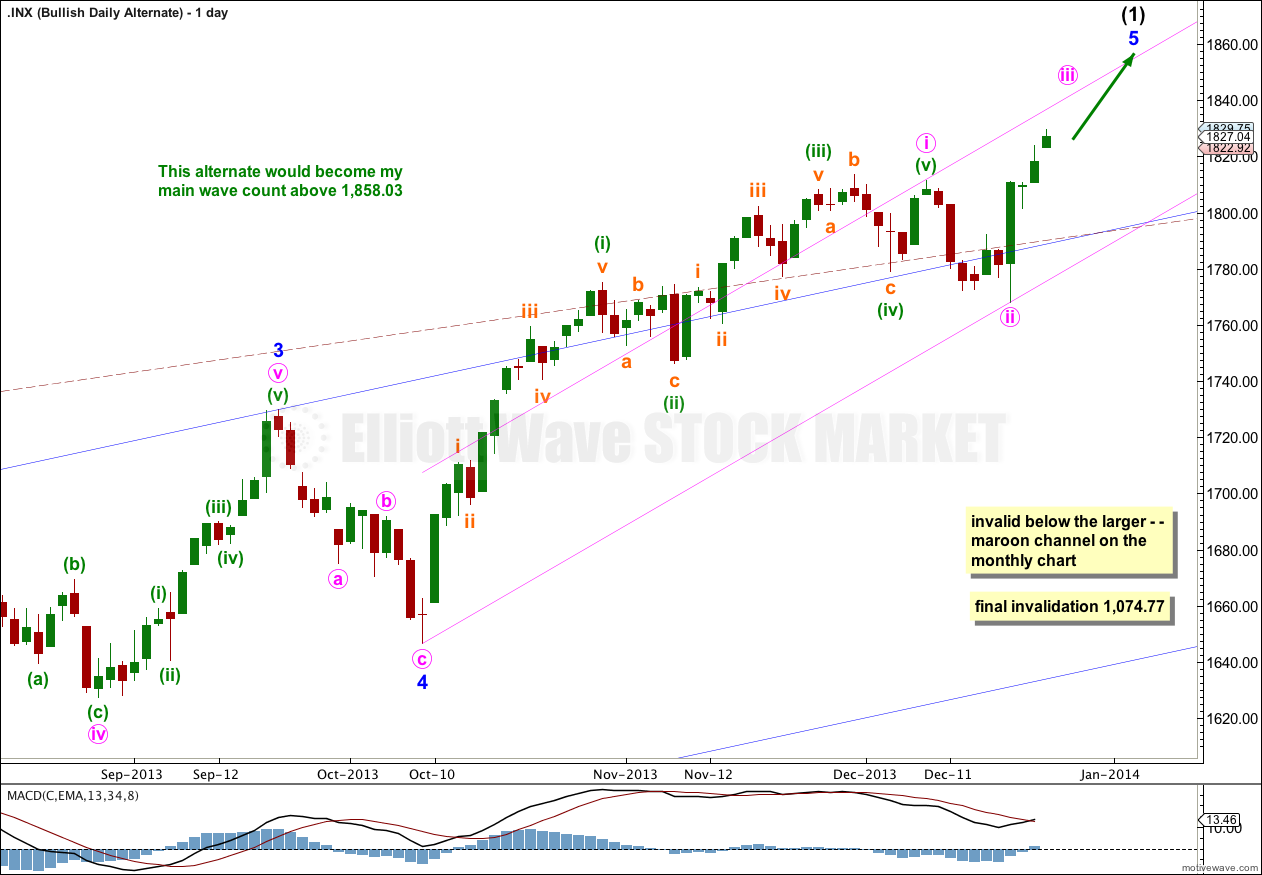
It is possible that a new cycle degree bull market began at 666.79. So far it is not yet halfway through, and I would expect it to last for a few years (at least five more years and probably longer).
The current upwards impulse, labeled intermediate wave (5) for the main wave count and minor wave 5 for this alternate is incomplete. The structure within the final fifth wave is the same, and the structure on the hourly chart is the same. Targets would be the same for this bullish wave count. This wave count again does not diverge with the main wave count, and it will not for several weeks or a a couple of months or so yet.
The maroon – – – channel is an acceleration channel drawn about primary waves 1 and 2 on the monthly chart (it is drawn in exactly the same way on the main wave count, but there it is termed a corrective channel). I would not expect intermediate wave (2) to breach this channel because a lower degree (intermediate) wave should not breach an acceleration channel of a higher degree (primary) first and second wave.