
Yesterday’s analysis expected downwards movement for Tuesday’s session towards a target at 1,790. Price has reached 0.9 points below the target. I had expected the target to be two to four days away, but it has been reached in only one day.
The wave count remains the same. I have a new hourly alternate for you today.
Click on the charts below to enlarge.
Main Wave Count.
This wave count has a higher probability than the alternate. Upwards movement over the last 4 1/2 years subdivides best as a zigzag. If something is “off” about the supposed recovery then it must be a B wave because there is plenty that is off in this scenario in terms of social mood.
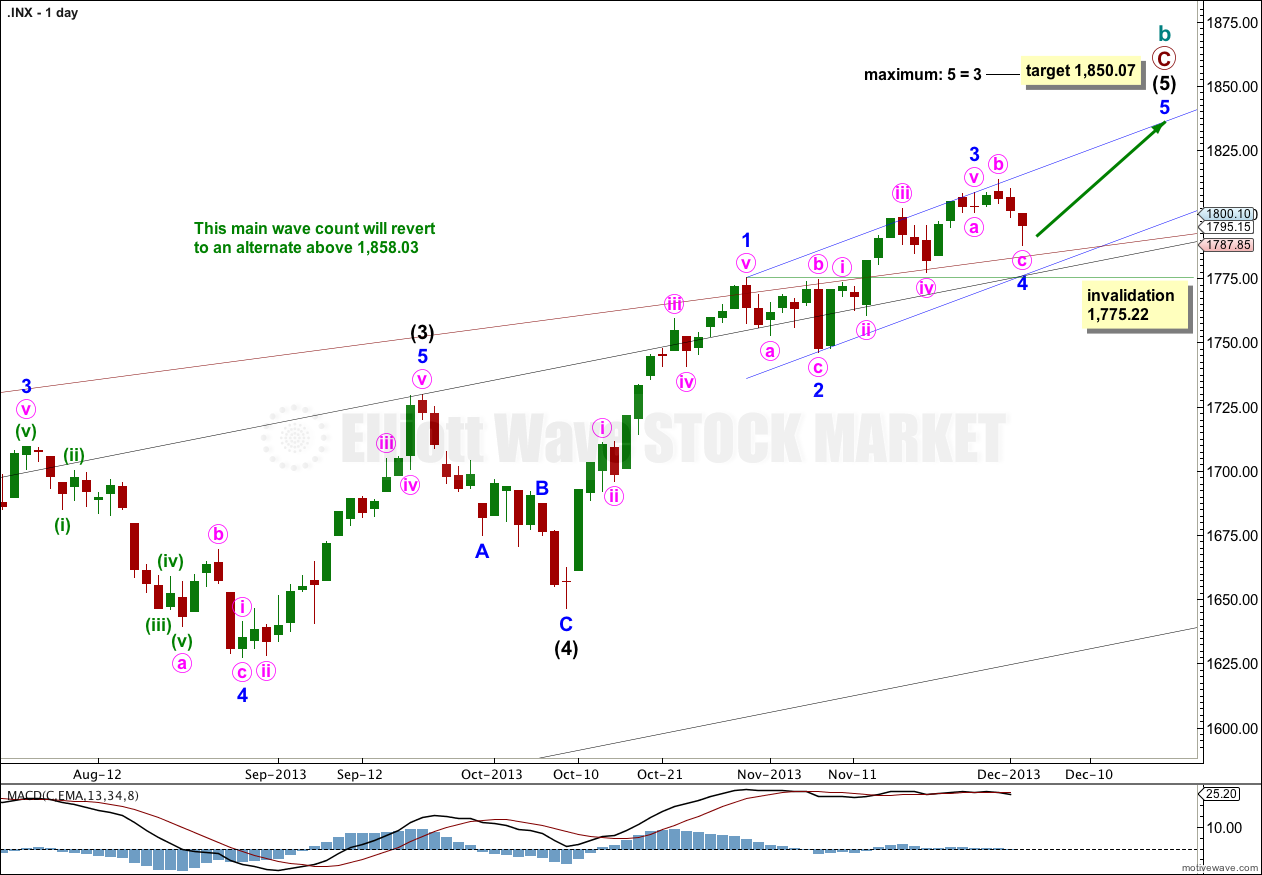
Downwards corrections may now find support along the upper edge of the big maroon channel from the monthly chart, if the upper trend line is pushed out to encompass all of primary wave A. It looks now like minor wave 4 has done this, ending very slightly above this trend line.
Intermediate wave (5) is incomplete, with minor waves 1, 2, 3 and now likely 4 complete.
Within intermediate wave (5) I can now add to the target calculation at minor wave degree. Because minor wave 3 is shorter than minor wave 1 this limits minor wave 5 to no longer than equality with minor wave 3. This would be achieved at 1,850.07, and this price point is a maximum for expected upwards movement. I would expect minor wave 5 to end slightly below this point.
Minor wave 4 may not move into minor wave 1 price territory. This wave count is invalidated with movement below 1,775.22.
At 1,858.03 cycle wave b would reach 138% the length of cycle wave a. At super cycle degree this wave count sees a large expanded flat unfolding. Within the expanded flat the maximum common length of cycle wave b is up to 138% the length of cycle wave a. When cycle wave b becomes longer than this then the probability that an expanded flat is unfolding decreases. At that stage I would swap over the main and alternate daily wave counts.
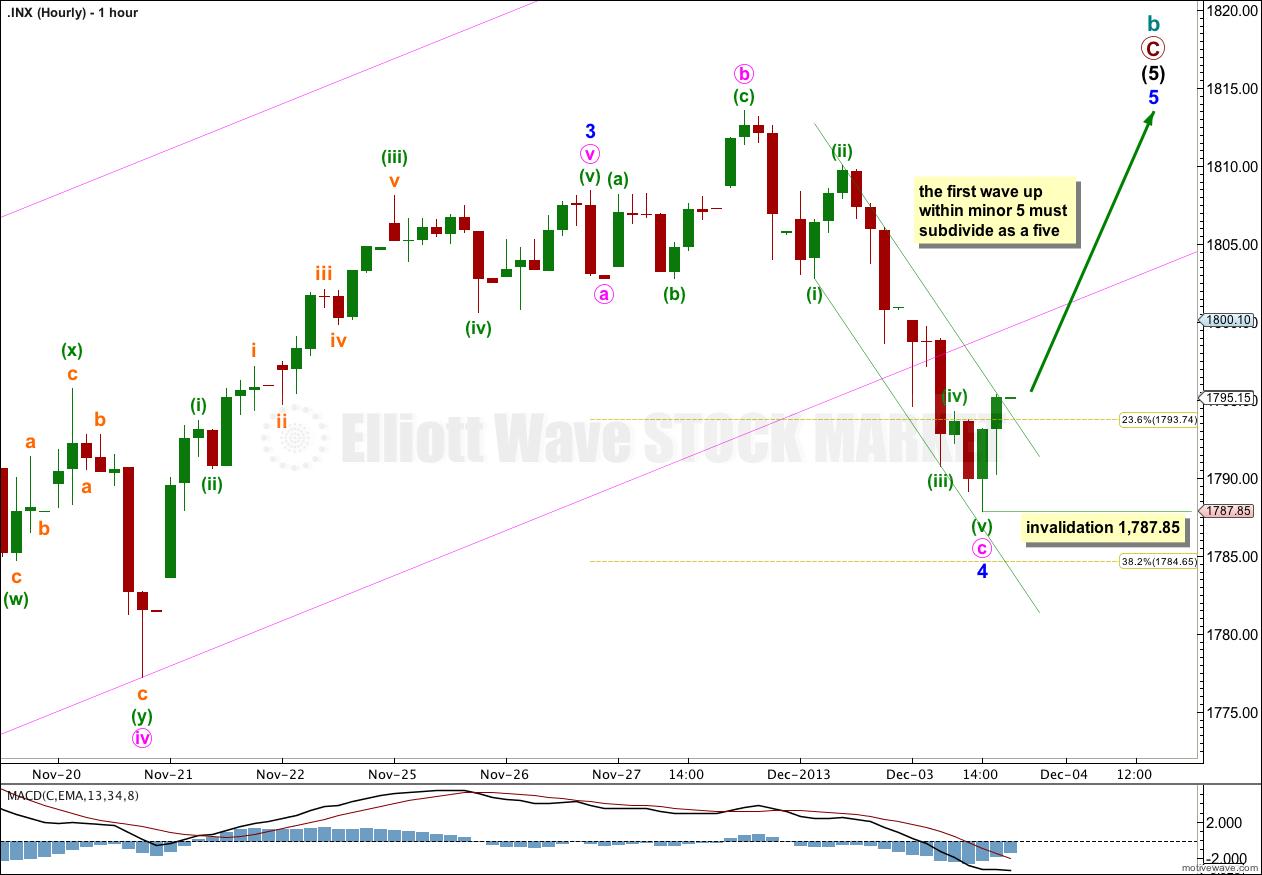
Minor wave 4 may now be over as an expanded flat correction. Within this structure minute wave b is a 190% correction of minute wave a, and minute wave c is 1.68 longer than 4.236 the length of minute wave a.
Ratios within minute wave c are: minuette wave (iii) is 1.81 points longer than 1.618 the length of minuette wave (i), and minuette wave (v) is 0.24 short of 0.618 the length of minuette wave (i).
If minor wave 4 is over here as a single expanded flat correction then it shows perfect alternation with minor wave 2. Minor wave 2 was a shallow 23% zigzag correction, and minor wave 4 is a deeper 33% expanded flat.
Minor wave 2 lasted six days. If minor wave 4 is over here it has lasted four days. The proportions are good enough for the wave count to have the right look, and it is most likely that minor wave 4 is over.
Initially a clear channel breach of the downwards sloping green channel about minute wave c would indicate a trend change. A clear five wave structure upwards on the hourly chart would confirm that minor wave 4 is over and minor wave 5 is underway.
Within minor wave 5 no second wave correction may move beyond the start of the first wave. This wave count is invalidated with movement below 1,787.85.
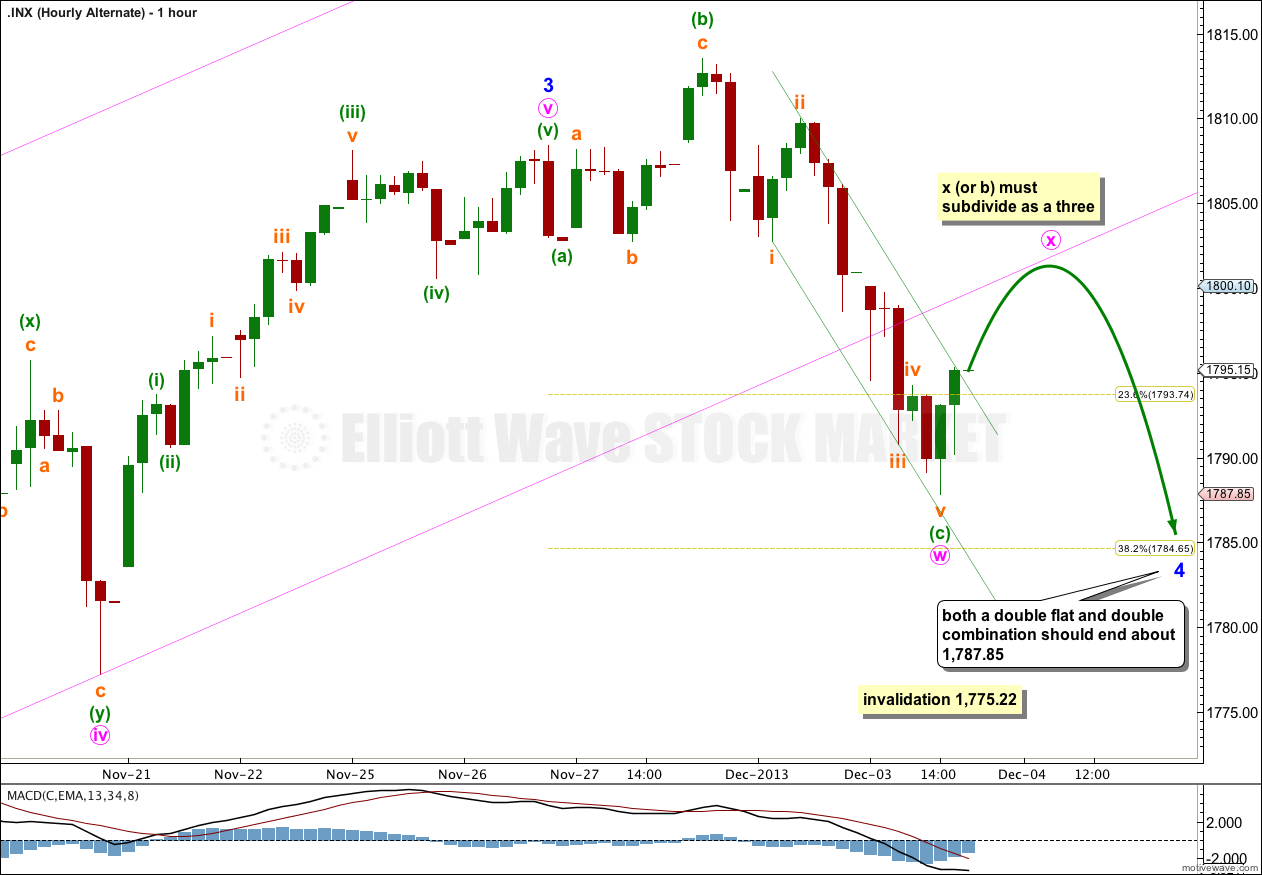
If we simply move the degree of labeling within minor wave 4 all down one degree then it is possible that only the first structure in a double flat or double combination (or only minute wave a within a flat) is completed.
Minor wave 4 could continue sideways as a double flat or double combination. However, if it did that it would be closer to nine or ten days in duration and so would look slightly out of proportion to minor wave 2. On the daily chart this alternate would not have as good a look as the main hourly wave count. For this reason I judge it to have a lower probability.
If the next upwards movement subdivides into a three wave structure then this alternate would remain valid. Movement below 1,787.85 in the next couple of days would invalidate the main hourly wave count and confirm this alternate.
If the next upwards movement subdivides into a clear five wave structure then this alternate would be discarded.
Bullish Alternate Wave Count.
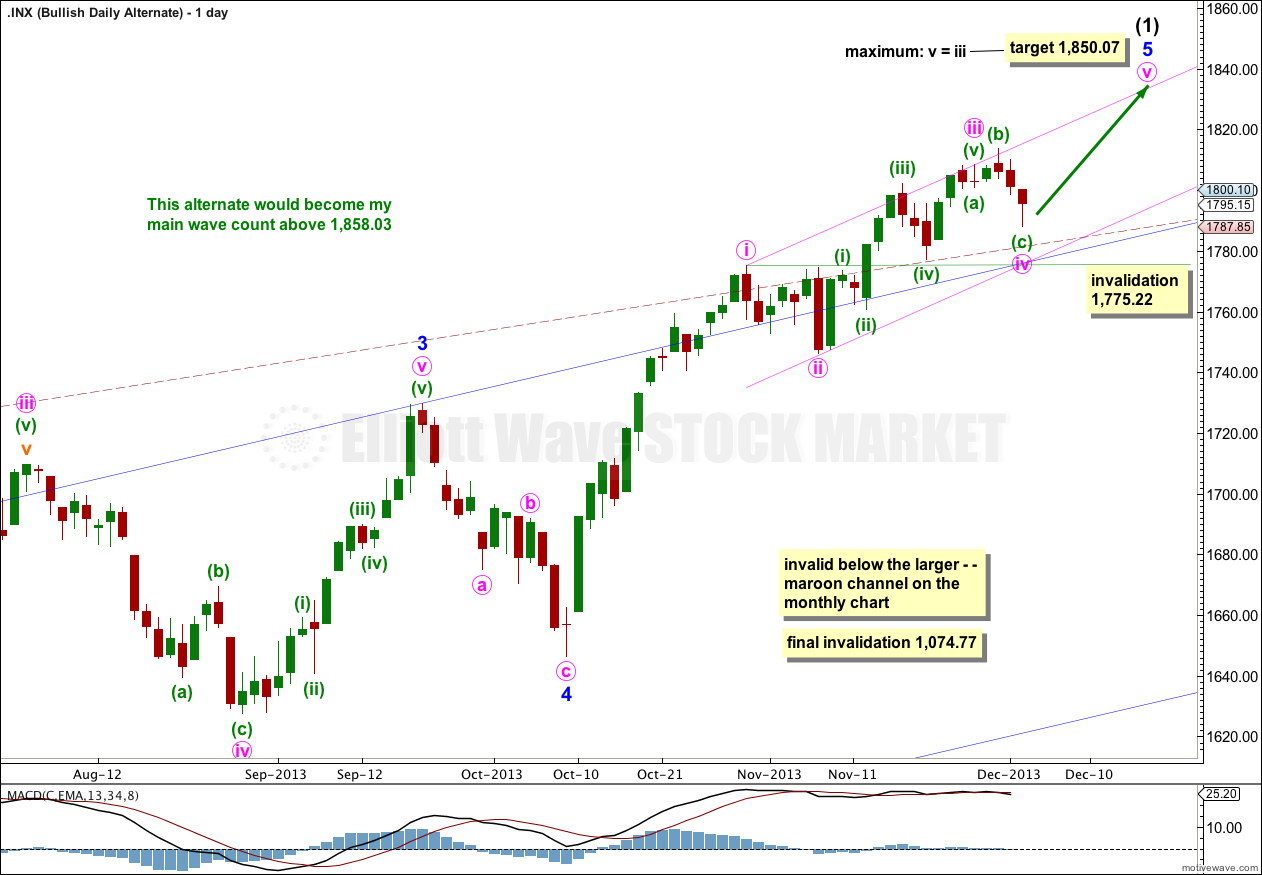
It is possible that a new cycle degree bull market began at 666.79. So far it is not yet halfway through, and I would expect it to last for a few years (at least five more years and maybe longer).
At some stage then the current upwards impulse, labeled intermediate wave (5) for the main wave count and minor wave 5 for this alternate, will be completed. At that stage both wave counts would expect a trend change. The main wave count would expect a huge cycle degree trend change, and this alternate would expect an intermediate degree trend change. If the downwards movement subdivides as a three and remains within the maroon channel then this alternate would be preferred. If it breaches the channel this alternate would be discarded.
The maroon – – – channel is an acceleration channel drawn about primary waves 1 and 2 on the monthly chart (it is drawn in exactly the same way on the main wave count, but there it is termed a corrective channel). I would not expect intermediate wave (2) to breach this channel because a lower degree (intermediate) wave should not breach an acceleration channel of a higher degree (primary) first and second wave.
The daily chart shows the structure of minor wave 5. It is incomplete. Targets are the same because they are calculated using the same wave lengths as the main wave count. This bullish alternate does not diverge from the main wave count at this stage, and it will not for some weeks (or months) to come.