
A new high for Friday was unexpected and breached the invalidation point on the hourly chart.
Overall though it still looks most likely that a fourth wave is completing. The wave count is changed at the hourly chart level.
Click on the charts below to enlarge.
Main Wave Count.
This wave count has a higher probability than the alternate. Upwards movement over the last 4 1/2 years subdivides best as a zigzag. If something is “off” about the supposed recovery then it must be a B wave because there is plenty that is off in this scenario in terms of social mood.
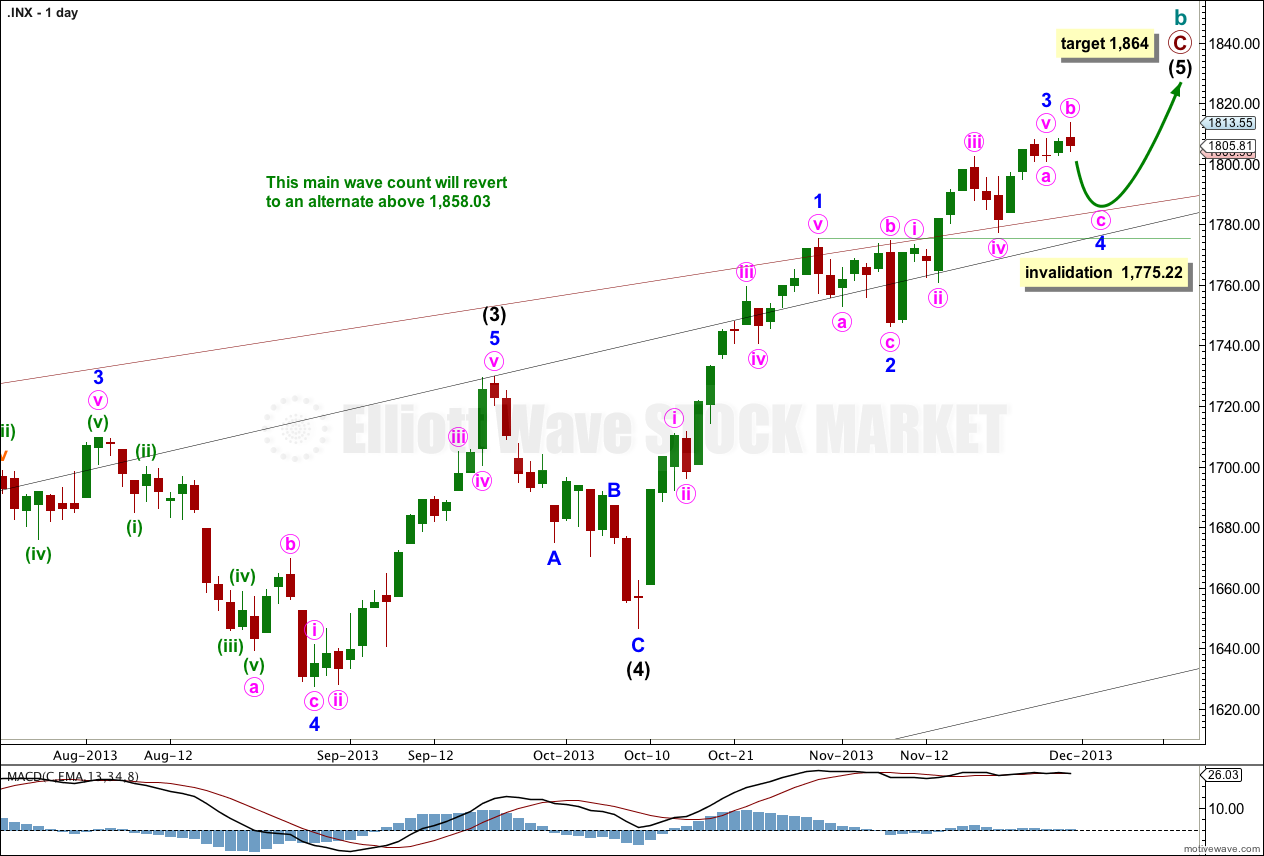
Downwards corrections may now find support along the upper edge of the big maroon channel from the monthly chart, if the upper trend line is pushed out to encompass all of primary wave A.
Intermediate wave (5) is incomplete, with minor waves 1 and 2 and now most likely 3 completed.
At 1,864 intermediate wave (5) would reach equality in length with intermediate wave (1). This is the most common ratio between first and fifth waves so this target has a good probability. When minor wave 4 within intermediate wave (5) is complete I will add to this calculation at a second wave degree, so it may change or widen to a small zone.
Minor wave 4 may not move into minor wave 1 price territory. This wave count is invalidated with movement below 1,775.22.
I would expect minor wave 4 to find support at the upper edge of the big maroon channel copied over from the monthly chart.
At 1,858.03 cycle wave b would reach 138% the length of cycle wave a. At super cycle degree this wave count sees a large expanded flat unfolding. Within the expanded flat the maximum common length of cycle wave b is up to 138% the length of cycle wave a. When cycle wave b becomes longer than this then the probability that an expanded flat is unfolding decreases. At that stage I would swap over the main and alternate daily wave counts.
Last analysis had two hourly wave counts, and the alternate was considered confirmed with movement above 1,808.42. However, that wave count does not have the right look at all. On the daily chart if minute wave v of minor wave 3 is continuing, then it would have a strong three wave look to it. It must subdivide as a five. Also, the downwards movement at the end of Friday’s session took price back into what would be first wave territory on the alternate wave count invalidating that structure.
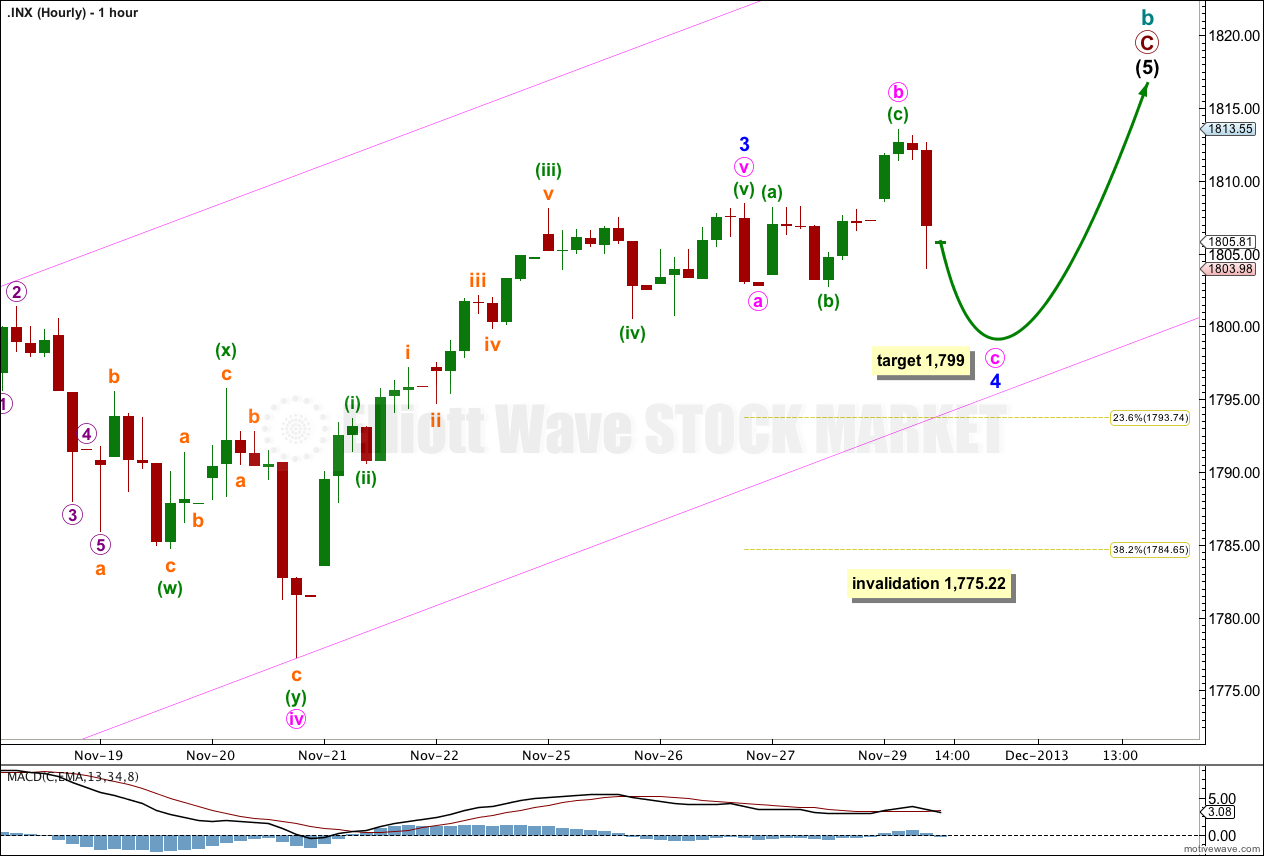
A new high invalidated the prior labeling of minor wave 4. It may be unfolding as an expanded flat correction, a double flat, double combination or running triangle. Within the correction minute waves a and b may be complete. Minute wave b is a 190% correction of minute wave a. This is longer than the maximum common length of 138%, but because the subdivisions fit nicely on the five minute chart I expect this labeling is most likely correct.
Within this expanded flat at 1,799 minute wave c would reach 2.618 the length of minute wave a. Minute wave c is extremely likely to make a new low below 1,802.75 to avoid a truncation and a very rare running flat.
Minor wave 4 may not breach the parallel channel containing minor wave 3, as it may be too shallow. Alternately, this expanded flat may be only the first in a double, and the second structure may breach the channel with sideways movement. Minor wave 2 lasted six sessions, and I would expect minor wave 4 to be of about the same duration. So far it has lasted only two sessions, and I would expect about another four sessions to be very likely.
If minor wave 4 is unfolding as a flat, double flat, combination or triangle then it is showing nice alternation with minor wave 2 zigzag.
I would expect downwards movement towards the target to be reached in one to three sessions. When the first expanded flat is over then I will consider the possibility of a double, depending upon how long the first structure takes.
Minor wave 4 may not move into minor wave 1 price territory. This wave count is invalidated with movement below 1,775.22.
Bullish Alternate Wave Count.
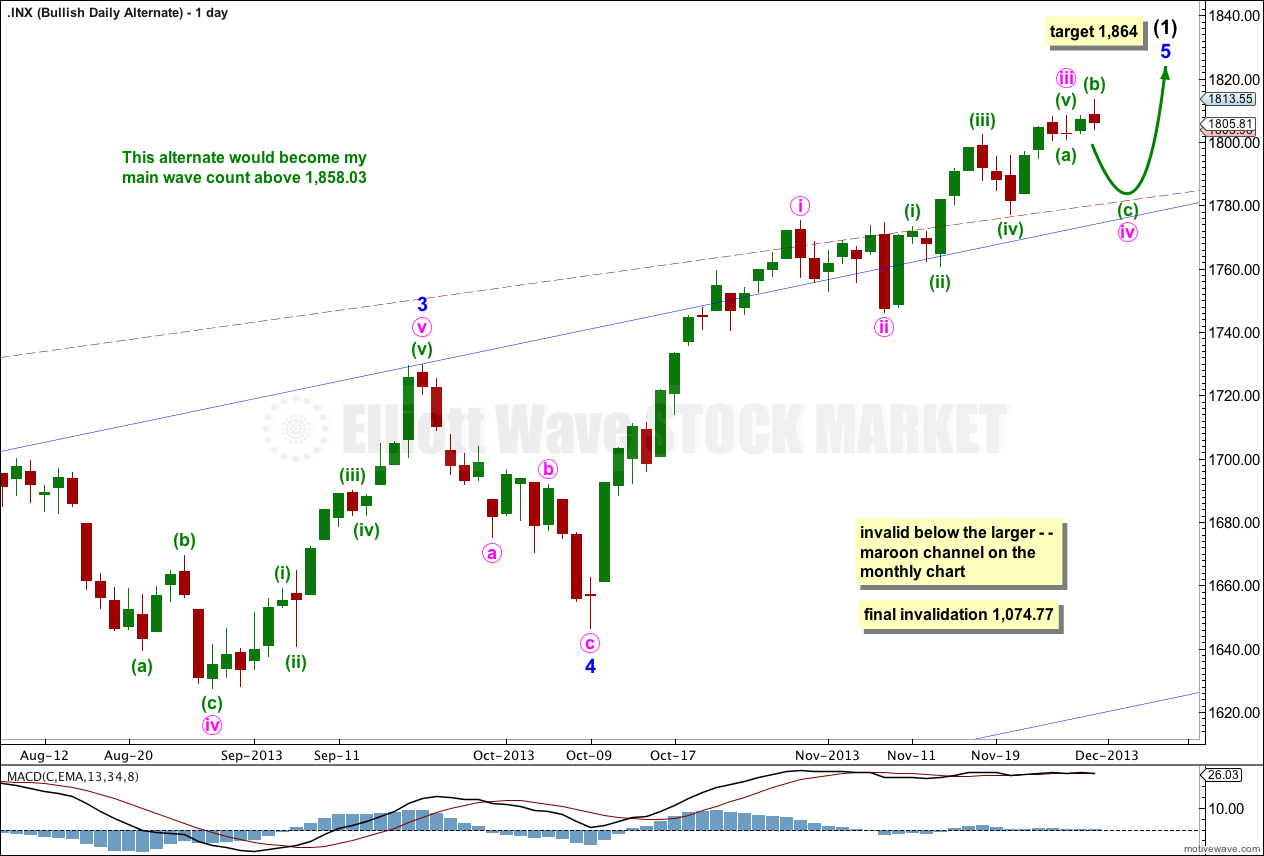
It is possible that a new cycle degree bull market began at 666.79. So far it is not yet halfway through, and I would expect it to last for a few years (at least five more years and maybe longer).
At some stage then the current upwards impulse, labeled intermediate wave (5) for the main wave count and minor wave 5 for this alternate, will be completed. At that stage both wave counts would expect a trend change. The main wave count would expect a huge cycle degree trend change, and this alternate would expect an intermediate degree trend change. If the downwards movement subdivides as a three and remains within the maroon channel then this alternate would be preferred. If it breaches the channel this alternate would be discarded.
The maroon – – – channel is an acceleration channel drawn about primary waves 1 and 2 on the monthly chart (it is drawn in exactly the same way on the main wave count, but there it is termed a corrective channel). I would not expect intermediate wave (2) to breach this channel because a lower degree (intermediate) wave should not breach an acceleration channel of a higher degree (primary) first and second wave.
The daily chart shows the structure of minor wave 5. It is incomplete. Targets are the same because they are calculated using the same wave lengths as the main wave count. This bullish alternate does not diverge from the main wave count at this stage, and it will not for some weeks (or months) to come.
Lara,
I was just looking at your bullish alternates for the Dow and S&P. Your Dow count suggests the market is still within maroon 1, whereas the S&P is in maroon 3. Is that correct? Thanks.
Peter
Yes… and no.
I think I need to update my Dow bullish alternate by moving the degree of labeling within the new upwards trend all up one degree.