
Last analysis expected downwards and sideways movement on the hourly chart for a fourth wave correction which is what has happened.
The wave count remains the same. I can now calculate a target for this fourth wave to end.
Click on the charts below to enlarge.
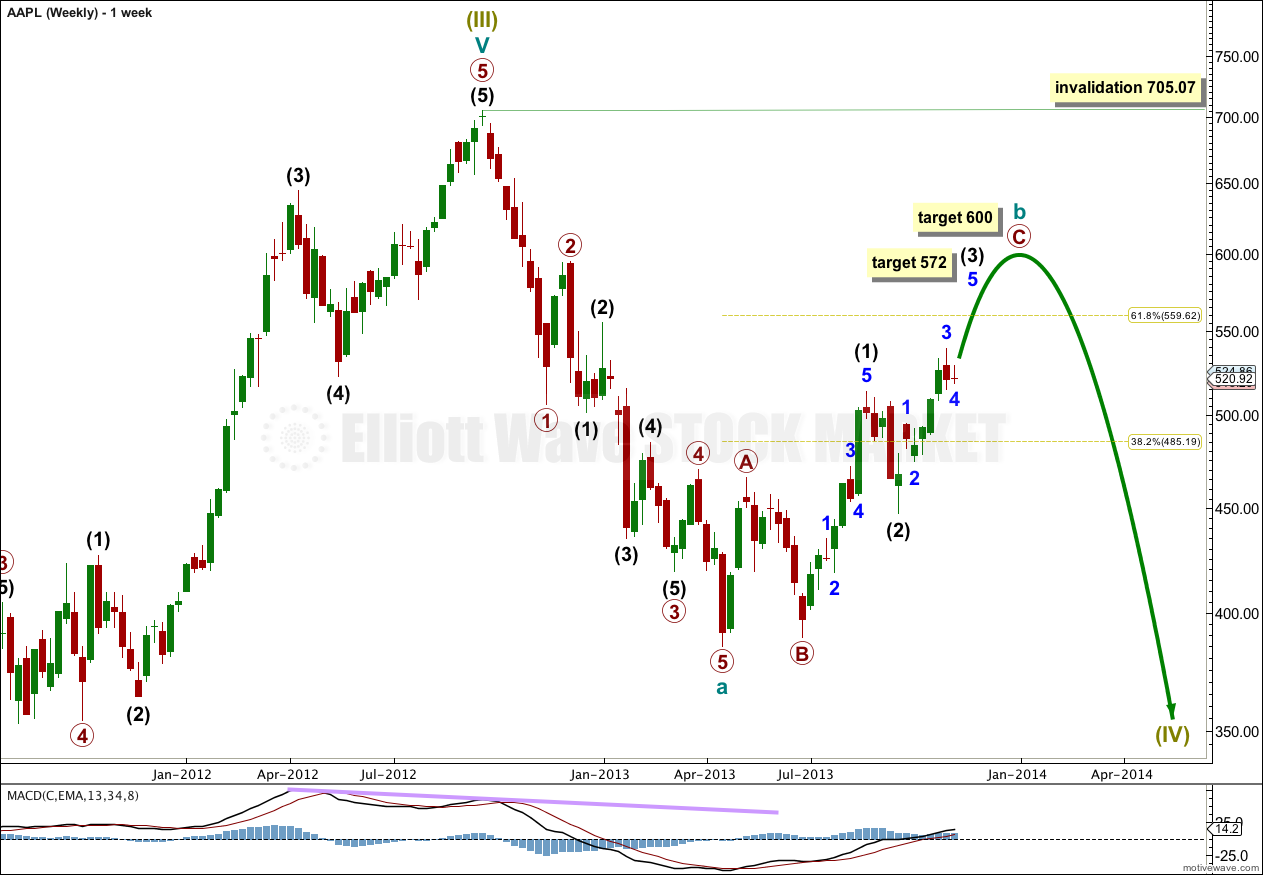
A large zigzag structure for a fourth wave correction at supercycle degree may be unfolding.
Within the zigzag cycle wave a is a complete impulse. Within cycle wave a there are no adequate Fibonacci ratios between primary waves 1, 3 and 5.
Cycle wave b is unfolding as a zigzag. Within the larger zigzag cycle wave b may not move beyond the start of cycle wave a. This wave count is invalidated with movement above 705.07.
At 600 primary wave C would reach 2.618 the length of primary wave A.
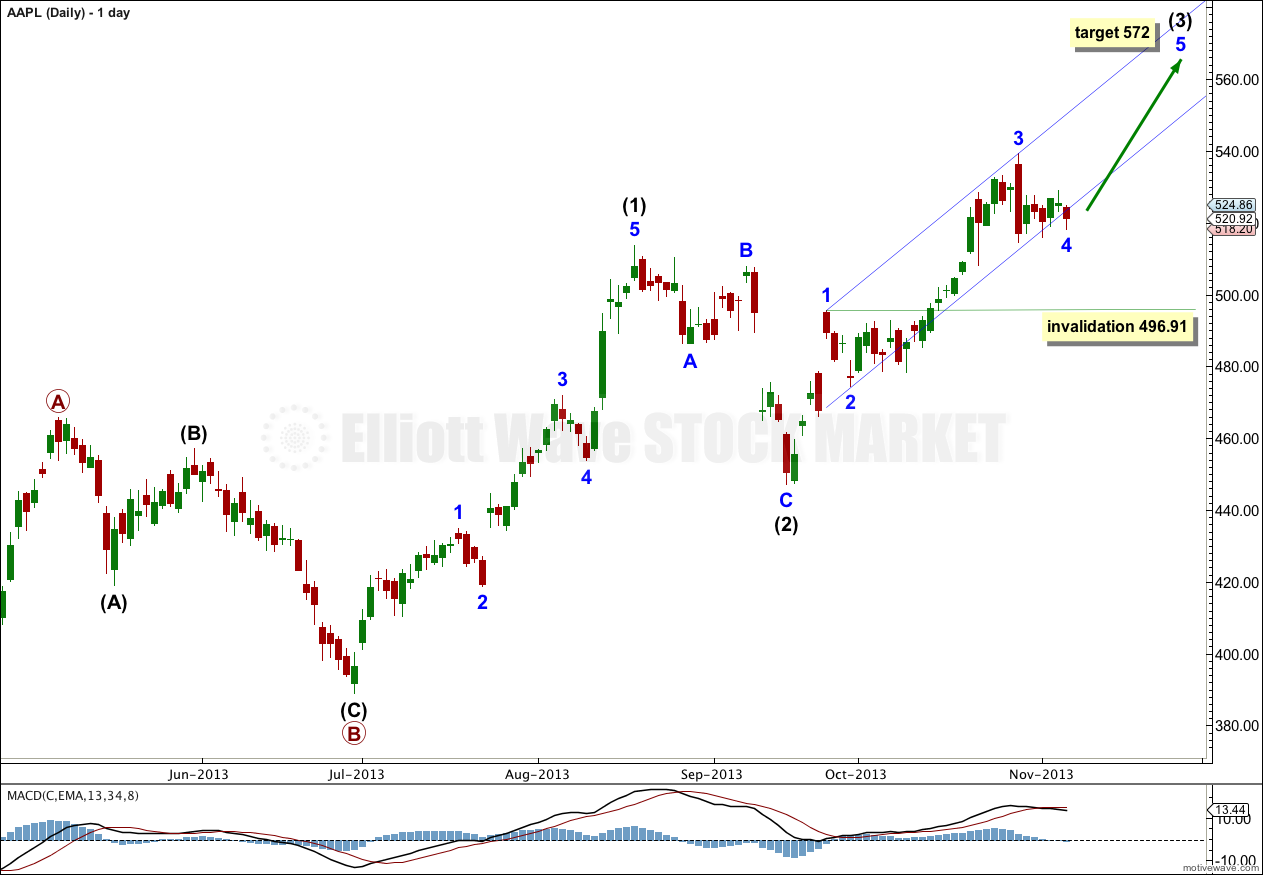
The daily chart shows the structure of cycle wave b.
Within primary wave B there is no Fibonacci ratio between intermediate waves (A) and (C).
Within intermediate wave (1) there are no adequate Fibonacci ratios between minor waves 1, 3 and 5.
Within intermediate wave (2) there is no Fibonacci ratio between minor waves A and C.
Within intermediate wave (3) minor wave 3 has no Fibonacci ratio to minor wave 1.
Minor wave 4 has breached the parallel channel about intermediate wave (3) drawn using Elliott’s first technique. Sometimes fourth waves do this. When they do the channel should be redrawn when they have ended. I will be able to do this next week for you.
Minor wave 4 is incomplete and should move a little lower. When it is complete minor wave 5 should make new highs and move toward the target at 572.
Minor wave 4 may not move into minor wave 1 price territory. This wave count is invalidated with movement below 496.91.
At 572 intermediate wave (3) would reach equality in length with intermediate wave (1). When minor wave 4 within intermediate wave (3) is completed I will add to this target calculation at minor wave degree, so it may change or widen to a small zone.
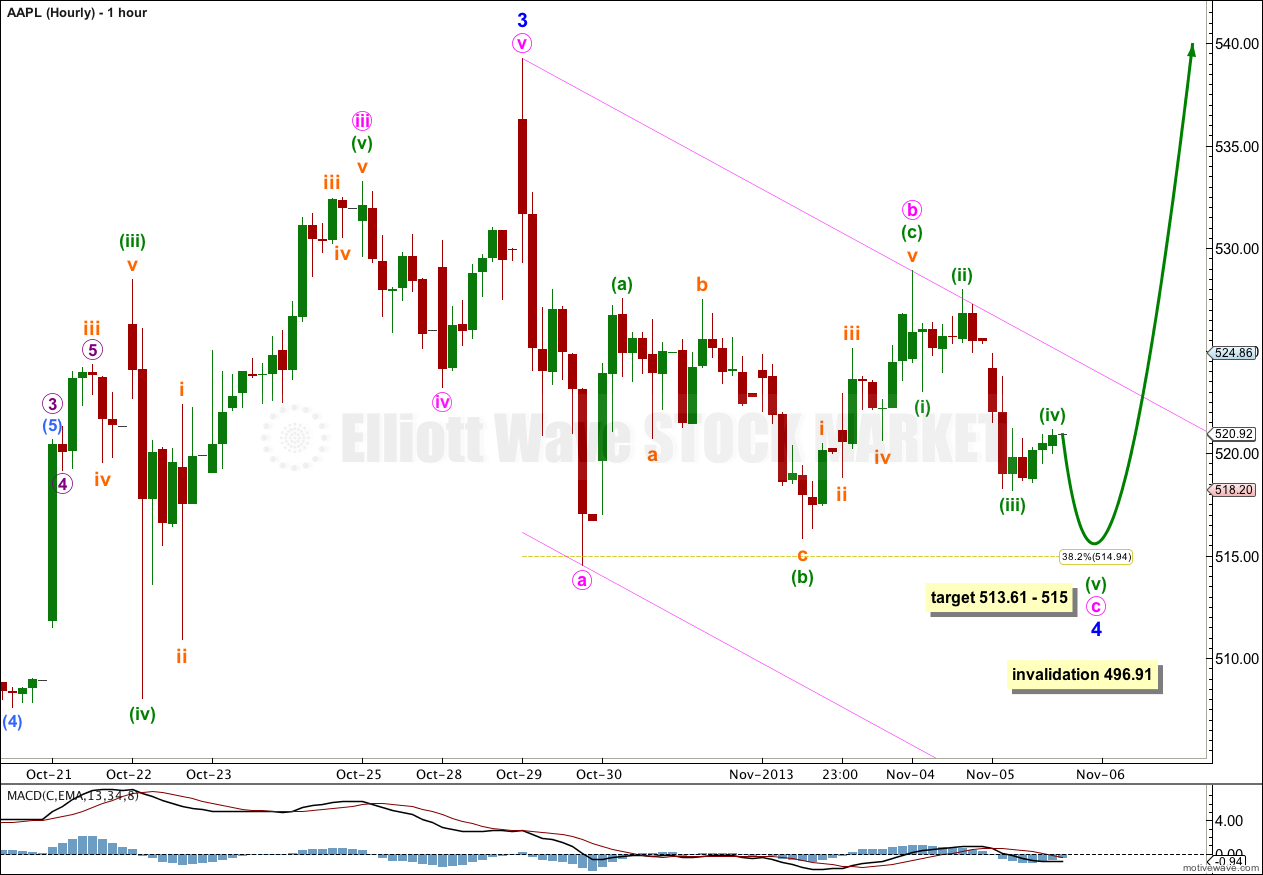
The hourly chart this week shows the structure of minor wave 4. It is unfolding as a zigzag.
Although minute wave a within it looks like a three wave structure on the hourly chart it has an impulsive wave count on the five minute chart. The fourth and second waves within it are out of proportion.
Minute wave b was a sideways moving zigzag.
Minute wave c is unfolding as an impulse. The final fifth wave down is required to complete the structure. This should be over within 24 hours.
At 513.61 minute wave c would reach 0.618 the length of minute wave a. At 515 minuette wave (v) would reach equality in length with minuette wave (i).
I favour the lower end of this small target zone because it would avoid a truncation. It is most likely that minute wave c will end below the end of minute wave a at 514.54.
This would see minor wave 4 end just slightly below the 0.382 Fibonacci of minor wave 3.
I would expect minute wave c to end midway within the downward sloping channel drawn about minor wave 4. When this channel is clearly breached by subsequent upward movement then I would have confidence that minor wave 4 is over and minor wave 5 upwards is underway.