
Yesterday’s analysis expected downwards movement which is what has happened. The target is not yet reached, but the structure is incomplete.
I am today making some adjustments to the alternate bullish monthly wave count so that it makes more sense.
Click on the charts below to enlarge.
Main Wave Count.
This wave count has a higher probability than the alternate. Upwards movement over the last 4 1/2 years subdivides best as a zigzag. If something is “off” about the supposed recovery then it must be a B wave because there is plenty that is off in this scenario in terms of social mood.
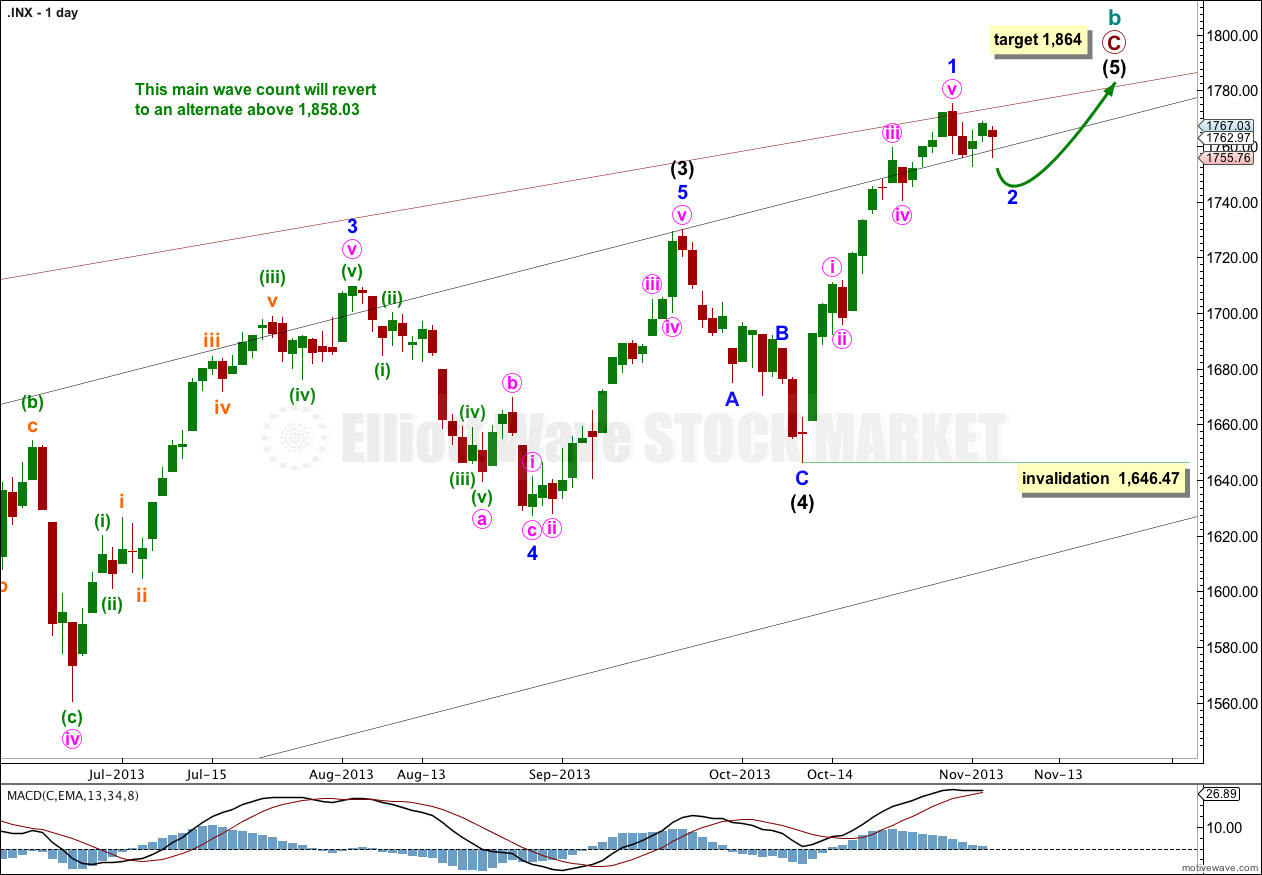
Price may have found resistance along the upper edge of the big maroon channel from the monthly chart, if the upper trend line is pushed out to encompass all of primary wave A.
At 1,858.03 cycle wave b would reach 138% the length of cycle wave a. This wave count sees a super cycle expanded flat unfolding, and the maximum common length for a B wave within a flat is 138% the length of the A wave. Above this point this wave count would reduce in probability and it would be more likely that a longer term bull market is underway.
Intermediate wave (5) is either incomplete with just minor wave 1 within it completed (as per the first hourly chart below) or, if we move the degree of labeling within it up one degree, intermediate wave (5) and in turn cycle wave b may now be completed.
However, we should always assume the trend remains the same until proven otherwise. I now have four conditions to be satisfied in looking for a trend change. As each condition is satisfied my confidence in this trend change would increase.
At 1,864 intermediate wave (5) would reach equality in length with intermediate wave (1). This is the most common ratio between first and fifth waves so this target has a good probability.
Within intermediate wave (5) no second wave correction may move beyond the start of the first wave. This wave count is invalidated with movement below 1,646.47.
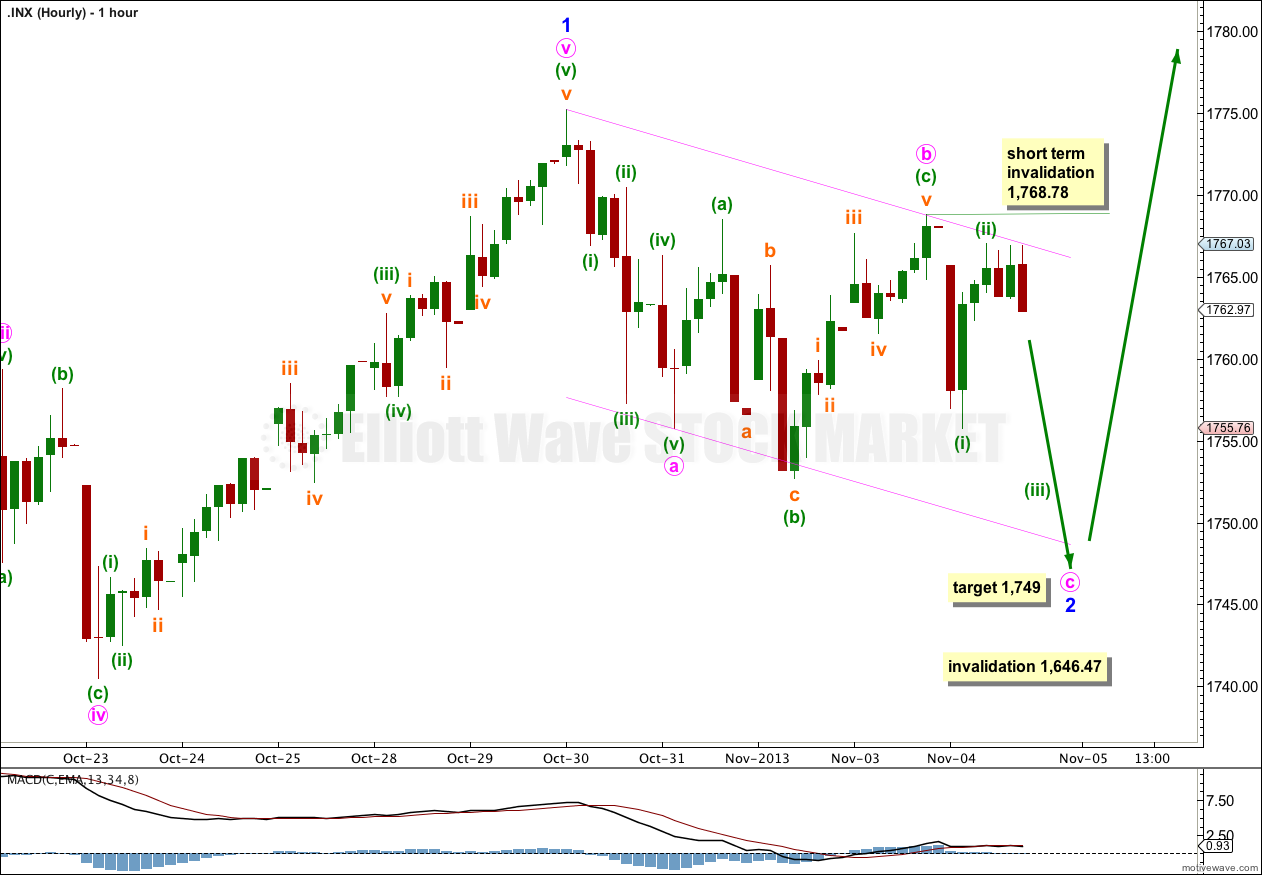
So far to the downside there is a 5-3 and an incomplete five. This may be an incomplete zigzag for a second wave correction.
Within minute wave c minuette wave (i) subdivides nicely on the five minute chart into an impulse. Minuette wave (ii) may be incomplete and may move higher. If it does it may not move beyond the start of minuette wave (i) at 1,768.78.
It is most likely that minute wave c is incomplete because it would be slightly truncated. I would expect most likely more downwards movement tomorrow. At 1,749 minute wave c would reach equality in length with minute wave a.
If price moves above 1,768.78 tomorrow before making new lows then it is just possible that minor wave 2 could be over. Within it minute wave c could be complete, ending at 1,755.76 which is just 0.04 points truncated above the end of minute wave a at 1,755.72. However, this has a low probability because of the truncation and because the structure would not have a very typical look.
Minor wave 2 may not move beyond the start of minor wave 1. This wave count is invalidated with movement below 1,646.47.
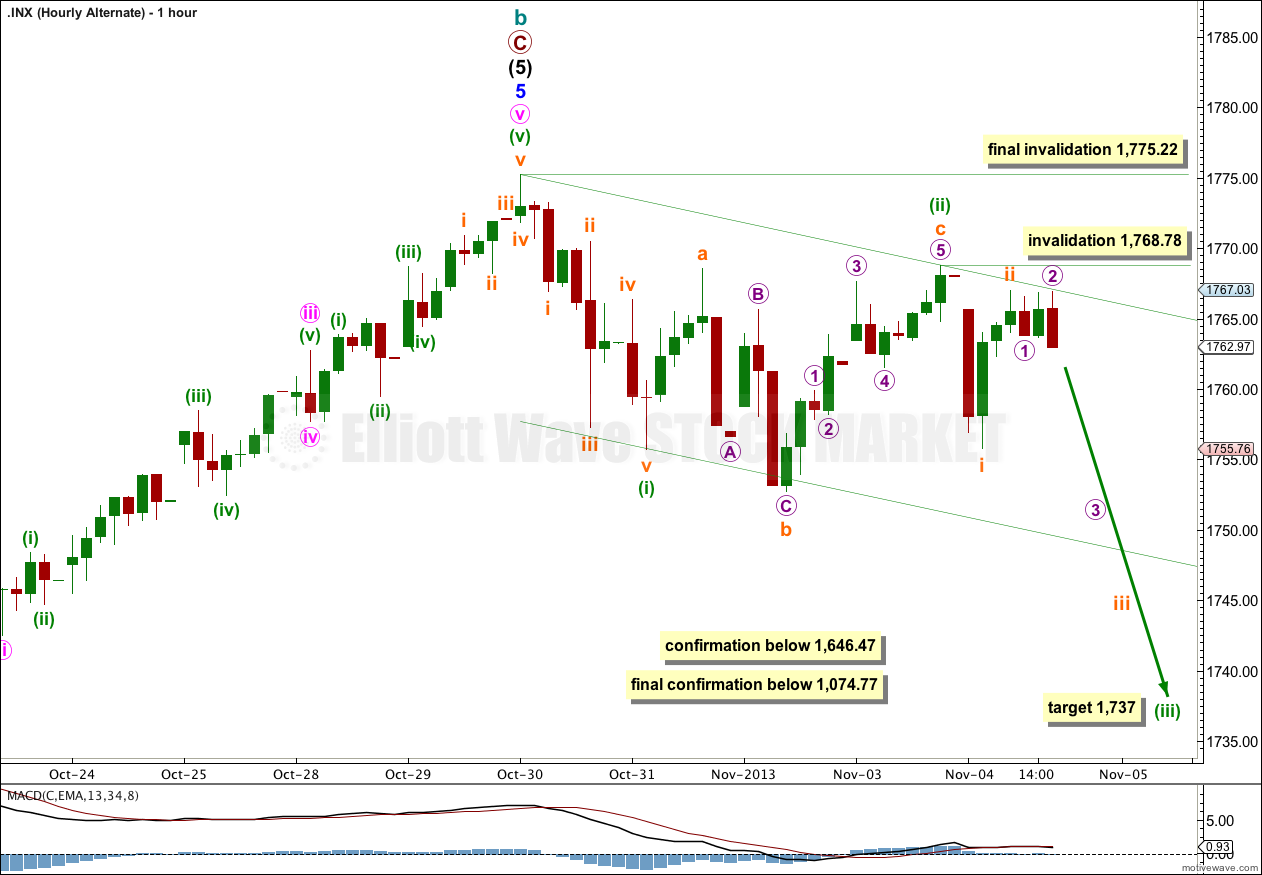
If we simply move the degree of labeling within intermediate wave (5) all up one degree it is possible that this entire wave of cycle wave b is completed. This is an enormous trend change. This wave count has an excellent fit, excellent Fibonacci ratios and a very good look overall. But at this early stage we do not have confirmation of a trend change of this magnitude. The next downwards trend for cycle wave c should last from one to several years and take price substantially below 666.79.
In looking for confirmation and confidence in this wave count I will look for the following (in order):
1. Movement below 1,646.47.
2. A clear breach of the black channel on the daily chart containing primary wave C.
3. A clear breach of the larger maroon channel on the monthly chart containing cycle wave b.
4. Final price confirmation with movement below 1,074.77.
As each condition is satisfied my confidence in this trend change would increase. Below the maroon parallel channel on the monthly chart this would be my only wave count at cycle degree.
A-B-C and 1-2-3 have exactly the same subdivisions. If this next wave down is a third wave I would expect it to breach the acceleration channel drawn here, and to show an increase in downward momentum. At 1,737 minuette wave (iii) would reach 1.618 the length of minuette wave (i).
This wave count expects a strong increase in downward momentum tomorrow.
Alternate Bullish Wave Count.
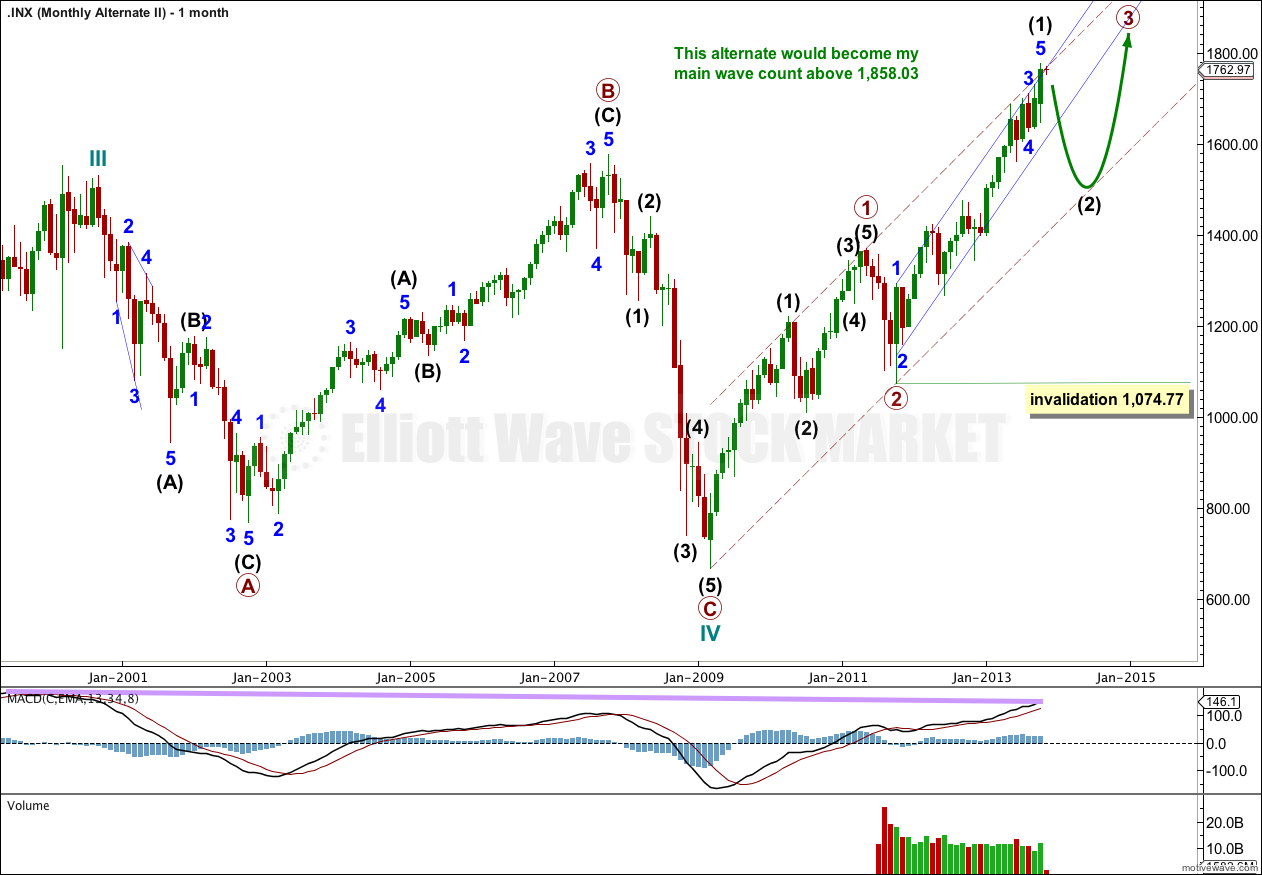
I am adjusting this bullish daily wave count today to avoid as many problems with it as possible.
Primary wave 1 may have subdivided exactly as primary wave A has on the main monthly chart. This avoids the problem of a lower degree second wave clearly breaching an acceleration channel about a higher degree first wave.
Primary wave 3 may not yet have passed its middle. Although upward momentum has increased it may yet be to increase further, and primary wave 3 should break above the acceleration channel about primary wave 1.
Intermediate wave (2) should now unfold to the downside. It should find support at the lower end of the acceleration channel about primary wave 1, and should not breach this trend line.
Intermediate wave (2) may not move beyond the start of intermediate wave (1). This wave count is invalidated with movement below 1,074.77.
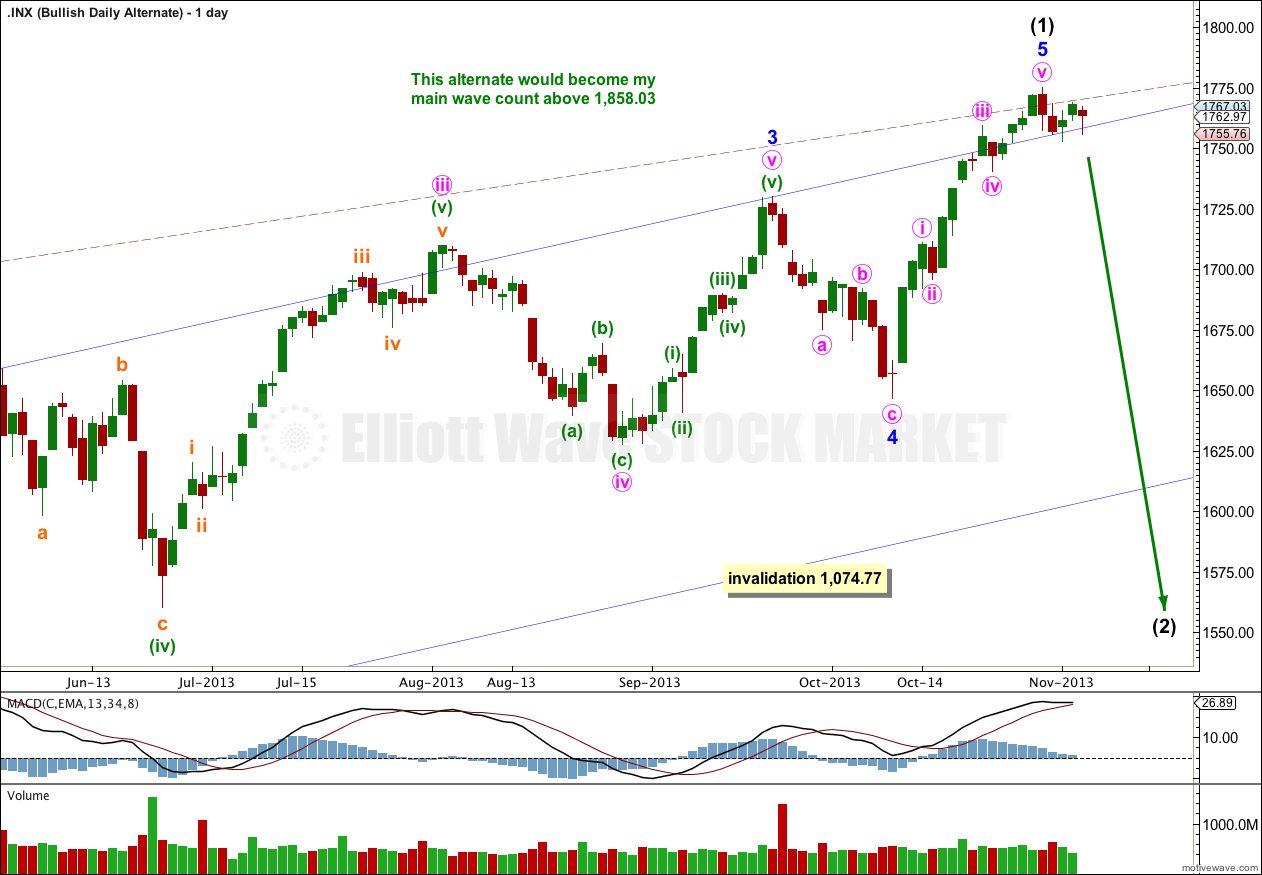
It is possible that we are and have been in a new bull market for a cycle degree fifth wave. Cycle waves should last from one to several years (as a rough guideline).
For this alternate downwards movement may have now begun for intermediate wave (2). This downwards movement must subdivide as a corrective structure, most likely a zigzag.
Intermediate wave (2) may not move beyond the start of intermediate wave (1). This wave count is invalidated with movement below 1,074.77.
Lara,
Yesterday you wrote:
“4. Final price confirmation with movement below 1,370.58.”
But today the number is listed at 1074.77. What has caused this change? It that is correct then we need a 700 point drop in the S&P before we can confirm the C wave is in process. The remainder of the C wave, if the S&P falls to 650, is only a little over 350 points.
For those who wait until final confirmation to take a position, two thirds of the move will be over.
I appreciate your thoughts and all your good work.
Thanks,
Rodney
What has changed is my analysis of the alternate monthly bullish wave count, to see it have a better fit.
This is why I would rather use the parallel channel on the monthly chart for confidence in the bearish wave count. When that channel is breached by downward movement then I would have confidence in the bearish wave count and the bullish wave count would look wrong.
The bullish wave count now sees a second wave down, rather than a fourth wave down.
Second waves of lower degrees should not breach the acceleration channel of the first and second waves of higher degrees. If they do than another count should be considered.
You are right, the final price confirmation point is very low.
But I would not wait for that to be breached in order to have confidence that it is not a second wave in a bull market, but a larger movement in a bear market.