
Yesterday’s analysis had a main wave count at the daily and hourly chart level which expected more upwards movement. This is what has happened. We have not seen a trend change on 28th October, although we did reach the target at that date.
We must always assume the trend remains the same until proven otherwise.
I will continue now to publish the bullish alternate each day, and I have determined a price point at which it would become the main wave count based upon Elliott wave guidelines.
Click on the charts below to enlarge.
Main Wave Count.
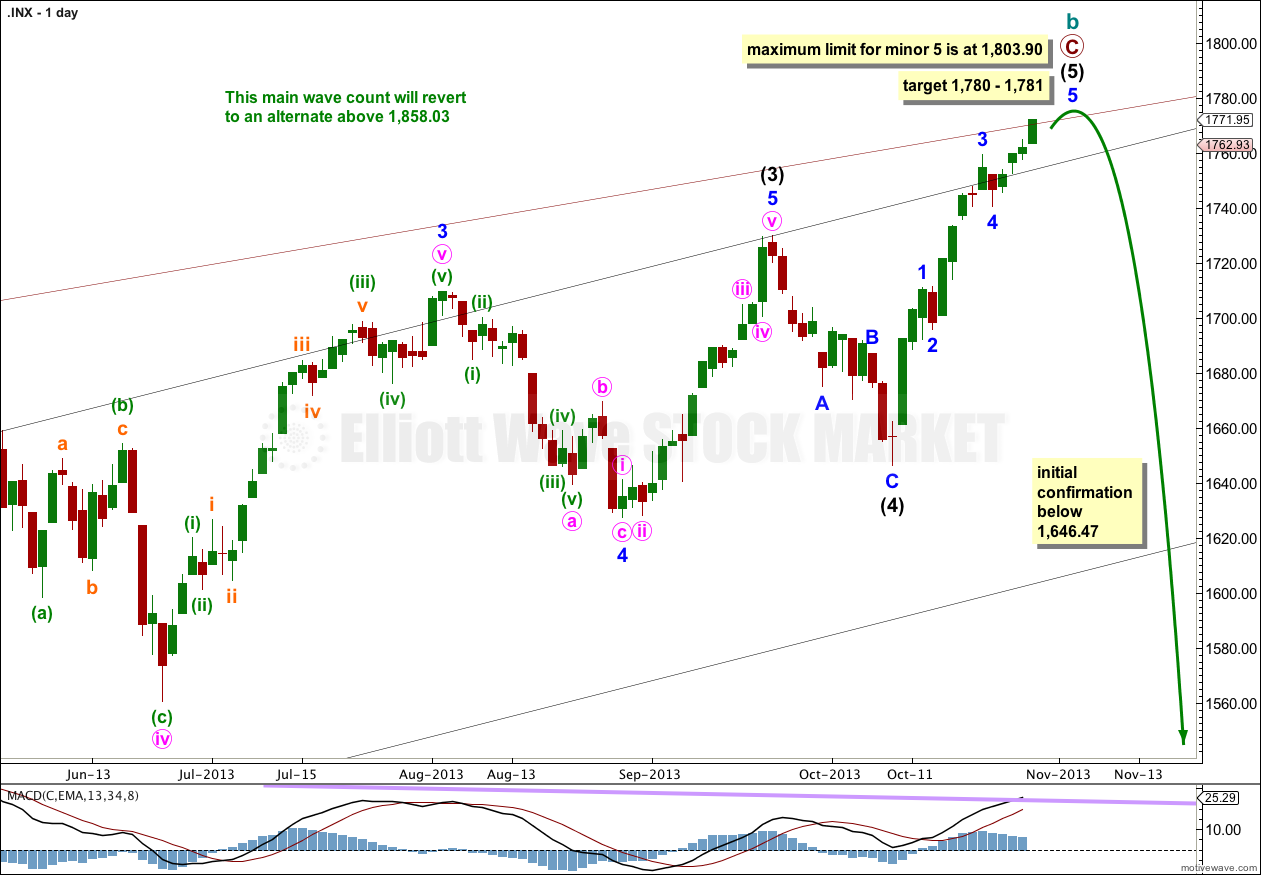
This wave count has a higher probability than the alternate. Upwards movement over the last 4 1/2 years subdivides best as a zigzag. Importantly, it does not show typical features of a third wave having just passed the strongest middle portion (which the alternate says must have recently happened). If something is “off” about the supposed recovery then it must be a B wave because there is plenty that is off in this scenario in terms of social mood.
Price has today just reached the upper edge of the big maroon channel from the monthly chart, if the upper trend line is pushed out to encompass all of primary wave A. It may find resistance in this area.
At 1,858.03 cycle wave b would reach 138% the length of cycle wave a. This wave count sees a super cycle expanded flat unfolding, and the maximum common length for a B wave within a flat is 138% the length of the A wave. Above this point this wave count would reduce in probability and it would be more likely that a longer term bull market is underway.
Intermediate wave (4) lasted 14 days, just one more than a Fibonacci 13.
The next Fibonacci duration for intermediate wave (5) to end would be in a total of 21 days on 7th November. Please note: this is a rough guideline only. Within this wave count there are few Fibonacci time relationships at primary or intermediate degree. Sometimes this happens, but not often enough to be reliable.
October is a common month for big trend changes with the S&P 500. It is also possible that intermediate wave (5) may end within the next two sessions.
Within intermediate wave (5) minor wave 3 is slightly shorter than equality with minor wave 1. This limits minor wave 5 to no longer than equality with minor wave 3, because a third wave may never be the shortest wave. This limit is at 1,803.90.
At 1,781 intermediate wave (5) would reach 0.236 the length of intermediate wave (3).
Within intermediate wave (5) no second wave correction may move beyond the start of the first wave. This wave count is invalidated with movement below 1,646.47.
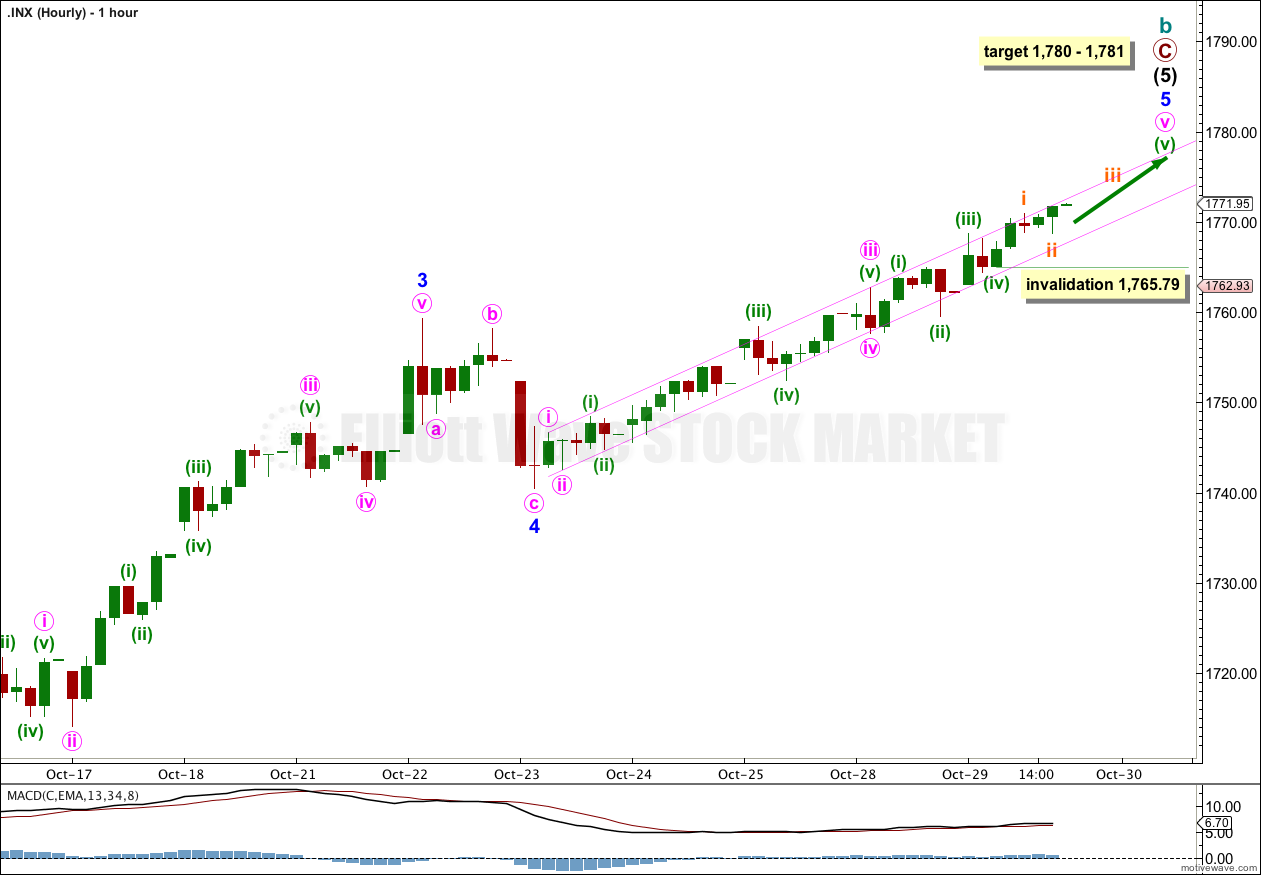
Minute wave v is very clearly not over; it did not end yesterday.
At 1,780 minor wave 5 would reach 0.618 the length of minor wave 3. At 1,781 intermediate wave (5) would reach 0.236 the length of intermediate wave (3).
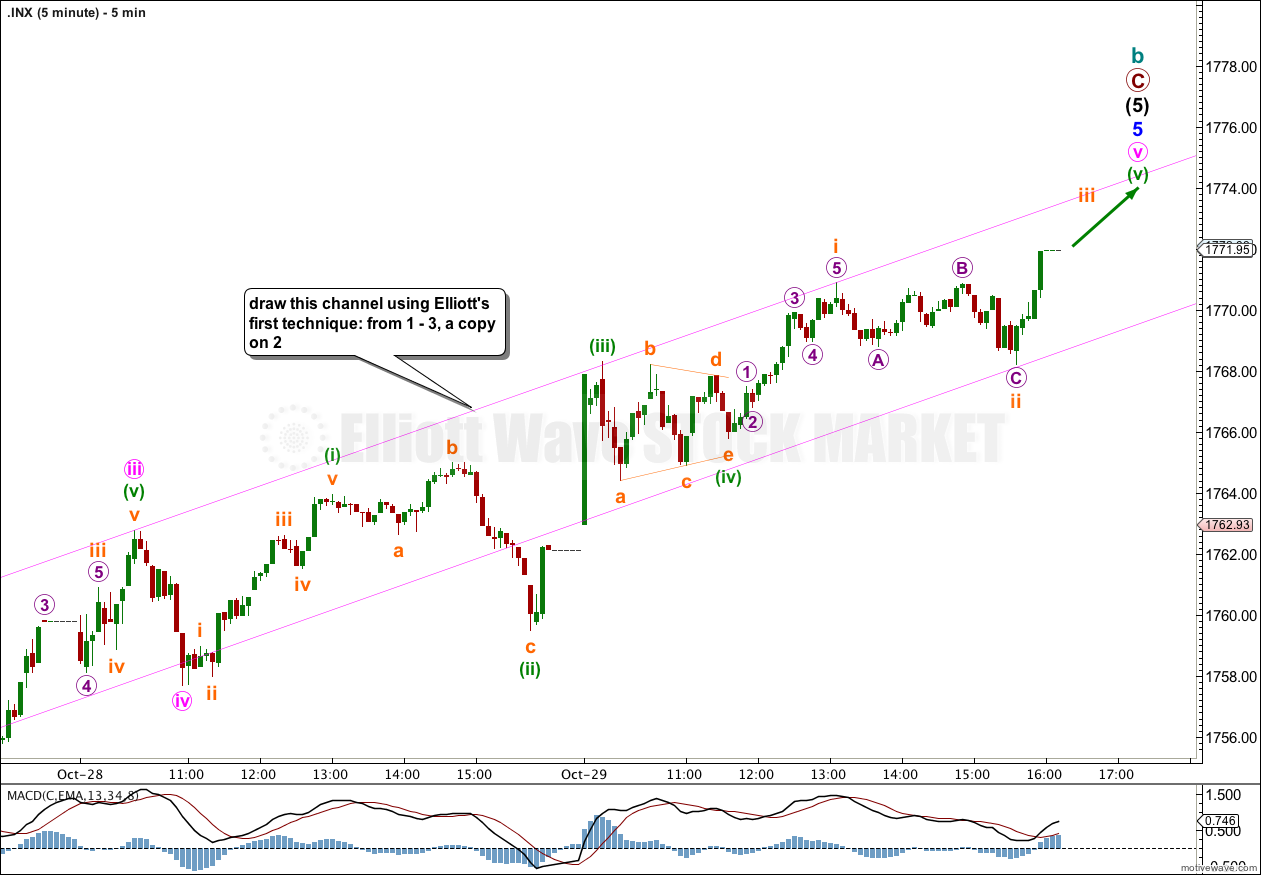
Within minute wave v I have analysed the structure carefully on the five minute chart. Minuette wave (i) ended at 1,763.95, and minuette wave (iii) has no Fibonacci ratio to minuette wave (i) and ended at 1,768.32. Minuette wave (ii) was an expanded flat and minuette wave (iv) was a triangle.
Minuette wave (v) looks like it is extending, and the structure is incomplete. I would expect more upwards movement tomorrow from this five minute chart analysis (below).
Draw a parallel channel about minor wave 5 using Elliott’s first technique. Draw the first trend line from the highs of minute waves i to iii, then place a parallel copy upon the low of minute wave ii. At this stage this channel is showing perfectly where price is finding support and resistance.
Within minuette wave (v) if subminuette wave ii moves lower it may not move beyond the start of subminuette wave i. This wave count is invalidated with movement below 1,765.79.
Alternate Wave Count.
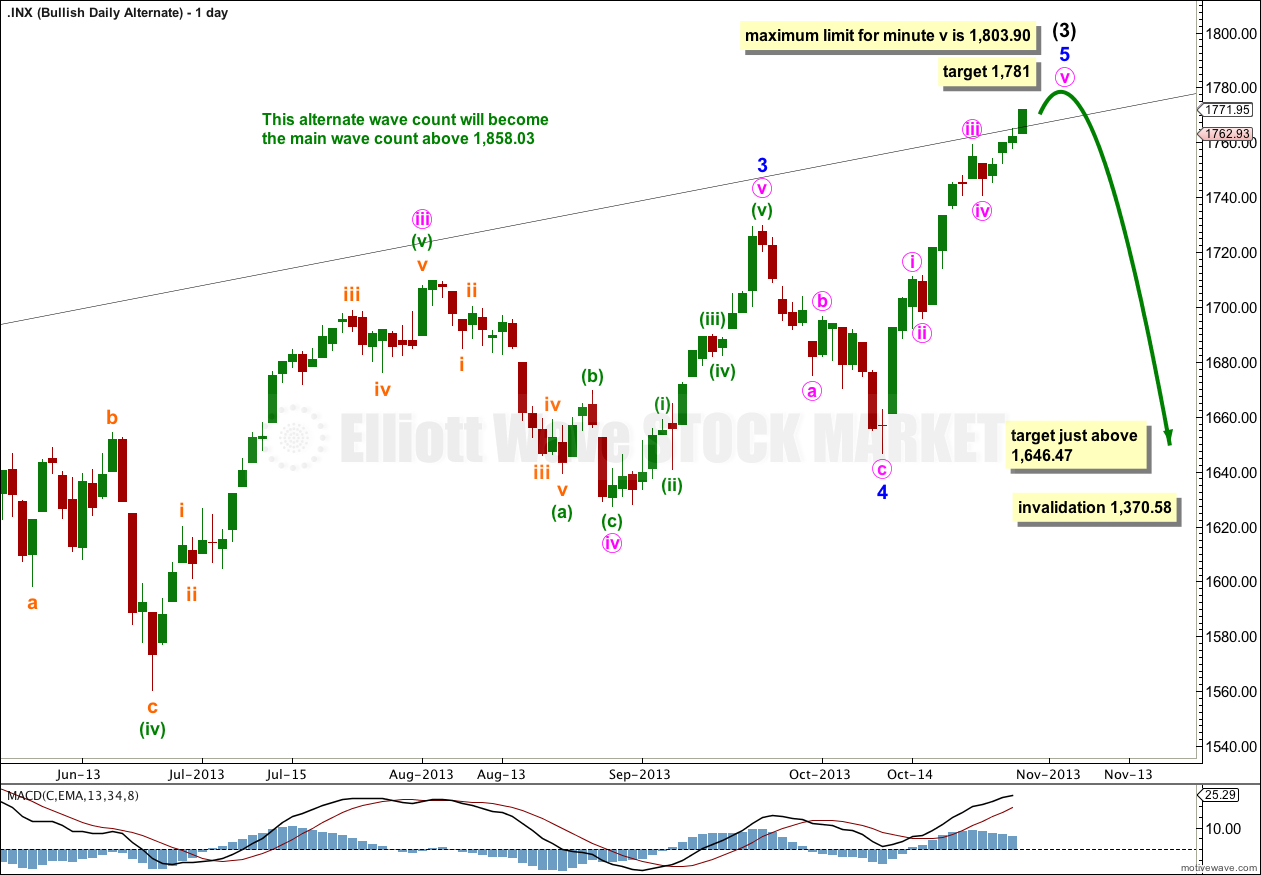
It is possible that we are and have been in a new bull market for a cycle degree fifth wave. Cycle waves should last from one to several years (as a rough guideline).
For this alternate downwards movement would be expected to begin soon for intermediate wave (4). This downwards movement must subdivide as a corrective structure, most likely a flat, combination or a triangle.
Intermediate wave (4) may not move into intermediate wave (1) price territory. This wave count would be invalidated with movement below 1,370.58.