
Yesterday’s analysis expected downwards and sideways movement for one to three days. This is not what happened as price has moved higher.
The wave count remains the same.
It is time to revise the big picture. I will cover monthly charts for this main wave count and the bullish alternate today.
Click on the charts below to enlarge.
Main Wave Count.
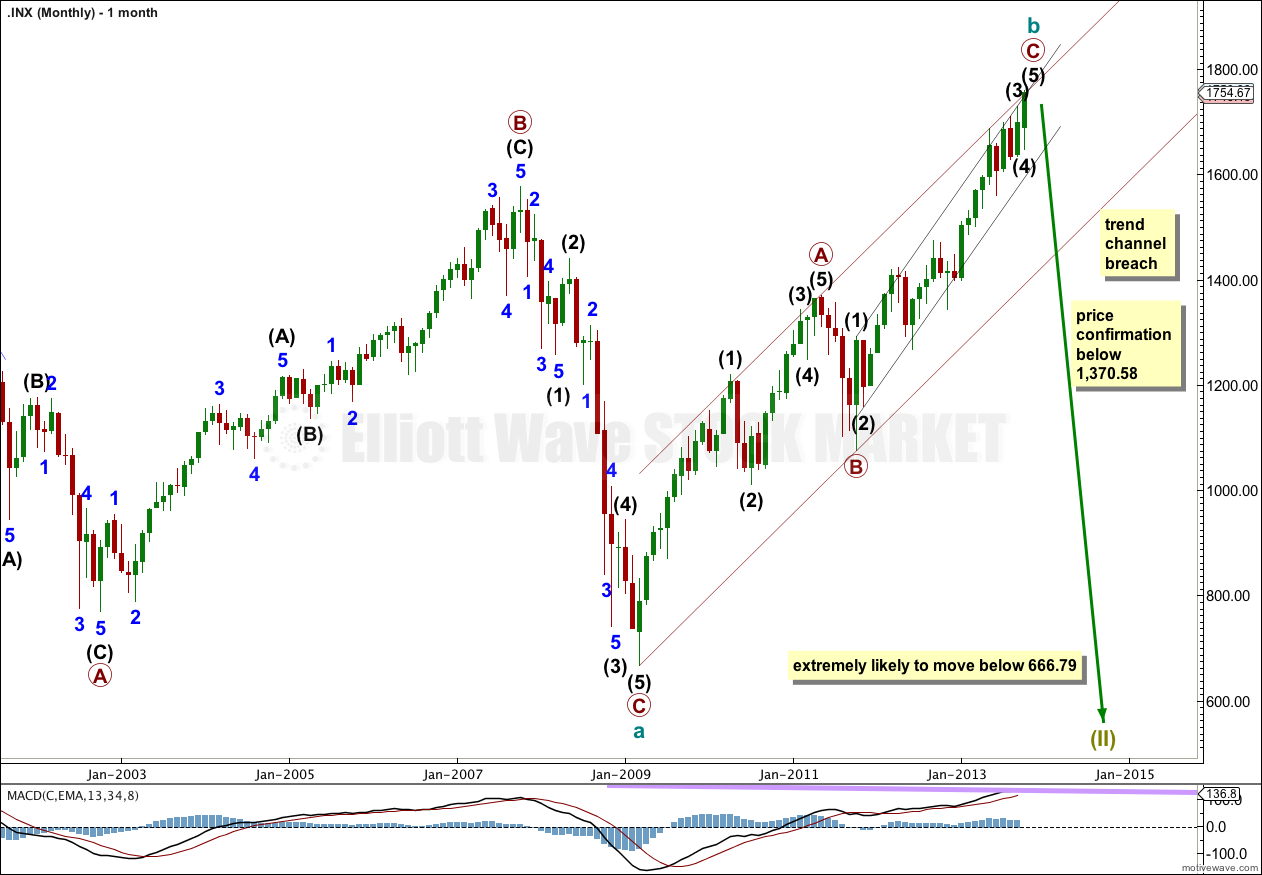
This is the main wave count at the monthly chart level. It expects that a big expanded flat correction is unfolding at super cycle degree.
Within the expanded flat cycle wave a subdivided into a three wave structure, a flat correction.
Cycle wave b is an almost complete zigzag, and it is over 105% the length of cycle wave a. This indicates an expanded flat.
Expanded flat corrections normally have C waves which take price substantially beyond the end of the A wave, and I would expect cycle wave c to end substantially below 666.79.
Movement below the maroon parallel channel would provide trend channel confirmation that cycle wave b is over and the next wave should then be underway.
Movement below 1,370.58 would invalidate the bullish alternate wave count. At that stage this would be my only wave count and I would have confidence in a target well below 666.79.
Intermediate wave (4) lasted 14 days, just one more than a Fibonacci 13.
If intermediate wave (5) exhibits a Fibonacci time relationship it may end in a Fibonacci 13 days (or sessions) on 28th October. Please note: this is a rough guideline only. Within this wave count there are few Fibonacci time relationships at primary or intermediate degree. Sometimes this happens, but not often enough to be reliable.
October is a common month for big trend changes with the S&P 500. This wave count could very well complete the structure for intermediate wave (5) this month, and maybe even this week.
Within primary wave C intermediate wave (3) was just 0.76 points longer than 2.618 the length of intermediate wave (1).
Ratios within intermediate wave (3) are: minor wave 3 was 16.23 points longer than 1.618 the length of minor wave 1, and minor wave 5 was just 2.14 points short of 0.236 the length of minor wave 3.
Ratios within minor wave 3 are: minute wave iii was just 7.66 points longer than 1.618 the length of minute wave i, and minute wave v has no Fibonacci ratio to either of minute waves iii or i.
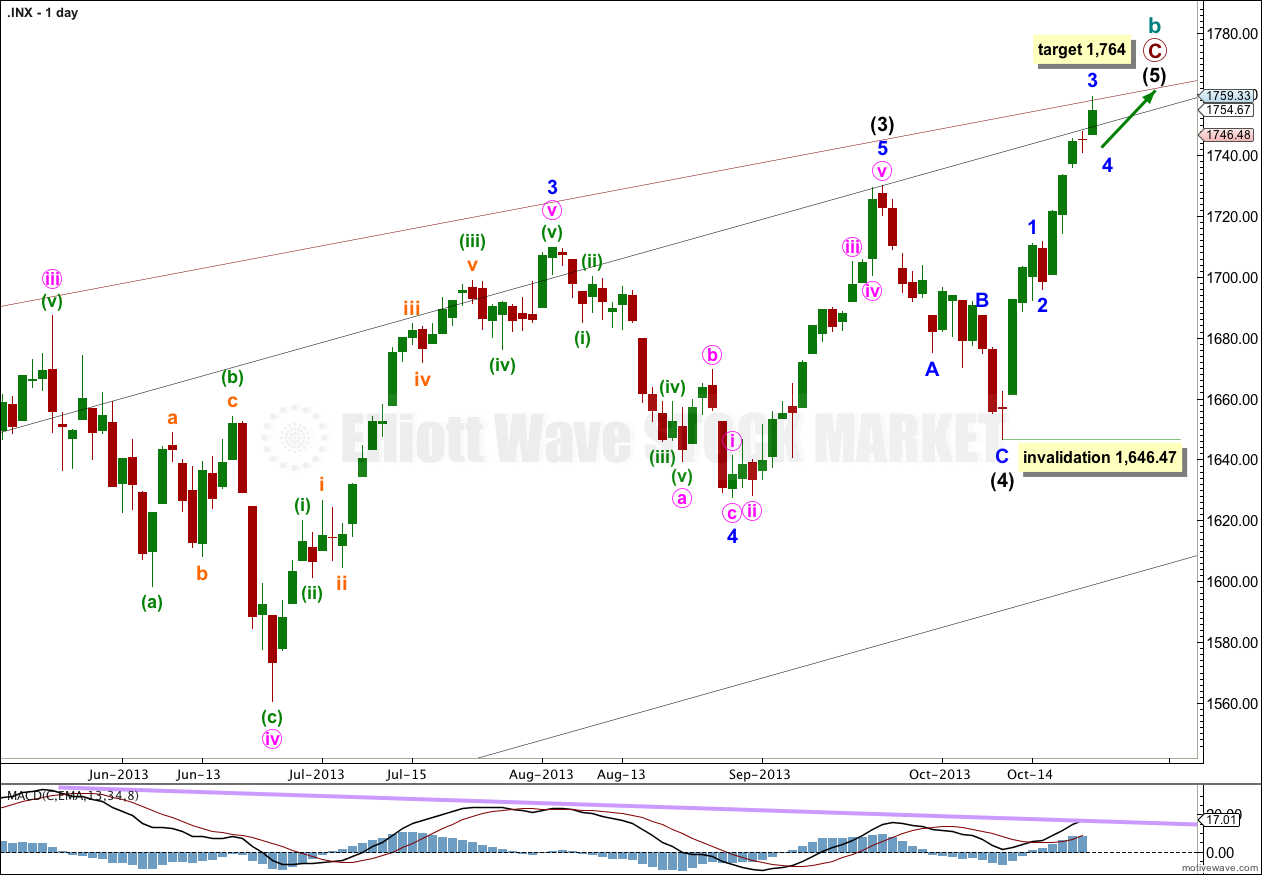
At 1,764 primary wave C would reach equality with primary wave A. If price continues through this first target then the next target would be at 1,781 where intermediate wave (5) would reach 0.236 the length of intermediate wave (3).
Within intermediate wave (5) no second wave correction may move beyond the start of the first wave. This wave count is invalidated with movement below 1,646.47.
With so many subdivisions on the way up there are several possible interpretations of this upwards impulse. What is clear is that it subdivides as an impulse.
Although Monday’s candlestick was a red doji on the daily chart it may not have been minor wave 4. That seems too brief and shallow. I expect minor wave 4 to last a little longer and be deeper.
With this labeling minor wave 3 is now just 1.16 points short of equality with minor wave 1.
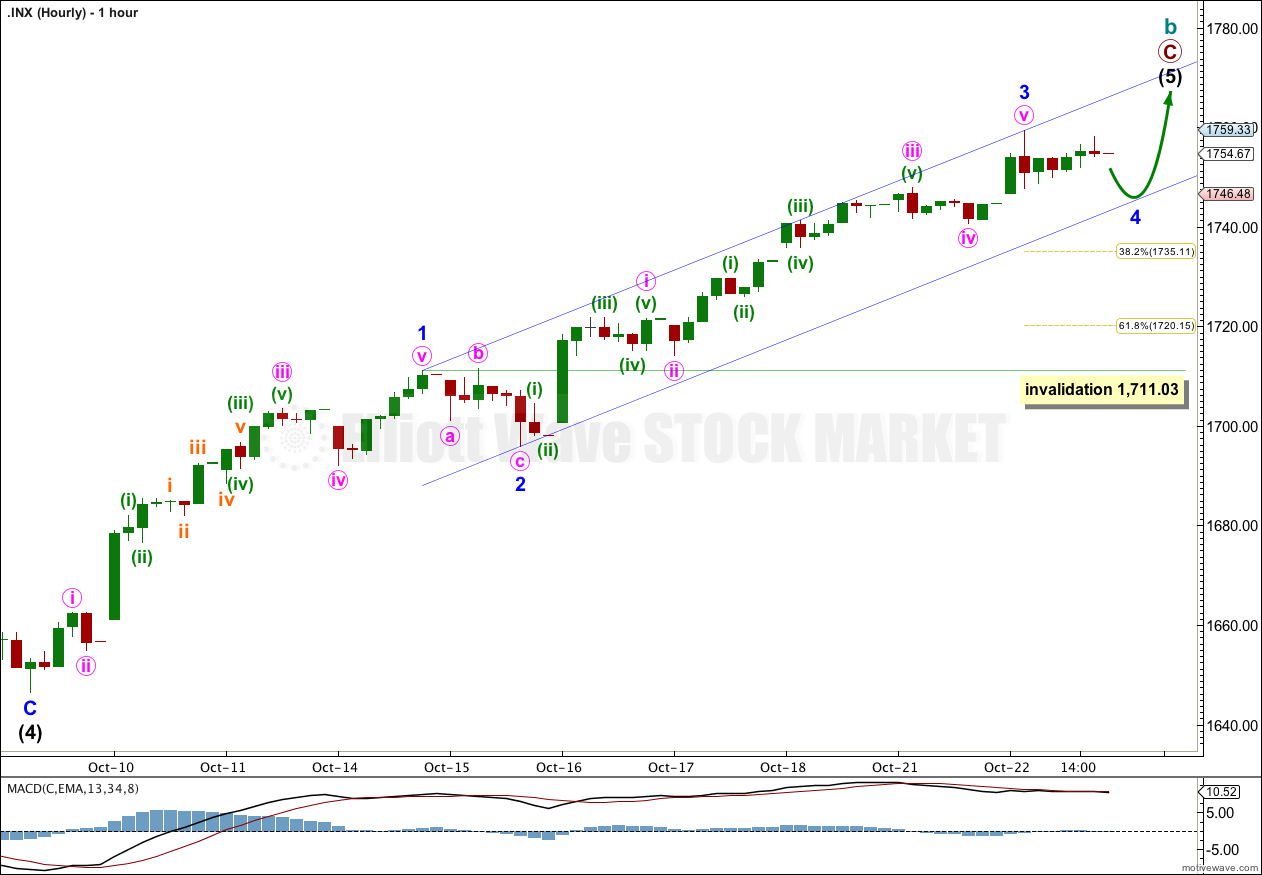
Within minor wave 3 there are no Fibonacci ratios between minute waves i, iii and v. Minute wave v is close to 0.618 the length of minute wave iii but the difference is just over 10%. The lack of adequate Fibonacci ratios here makes me consider that this may not be the correct labeling, and if incorrect it may be that minor wave 3 is not over and may end tomorrow with a little more upwards movement.
Minor wave 4 is probably yet to unfold. It may not move into minor wave 1 price territory. This wave count is invalidated with movement below 1,711.03.
Alternate Wave Count.
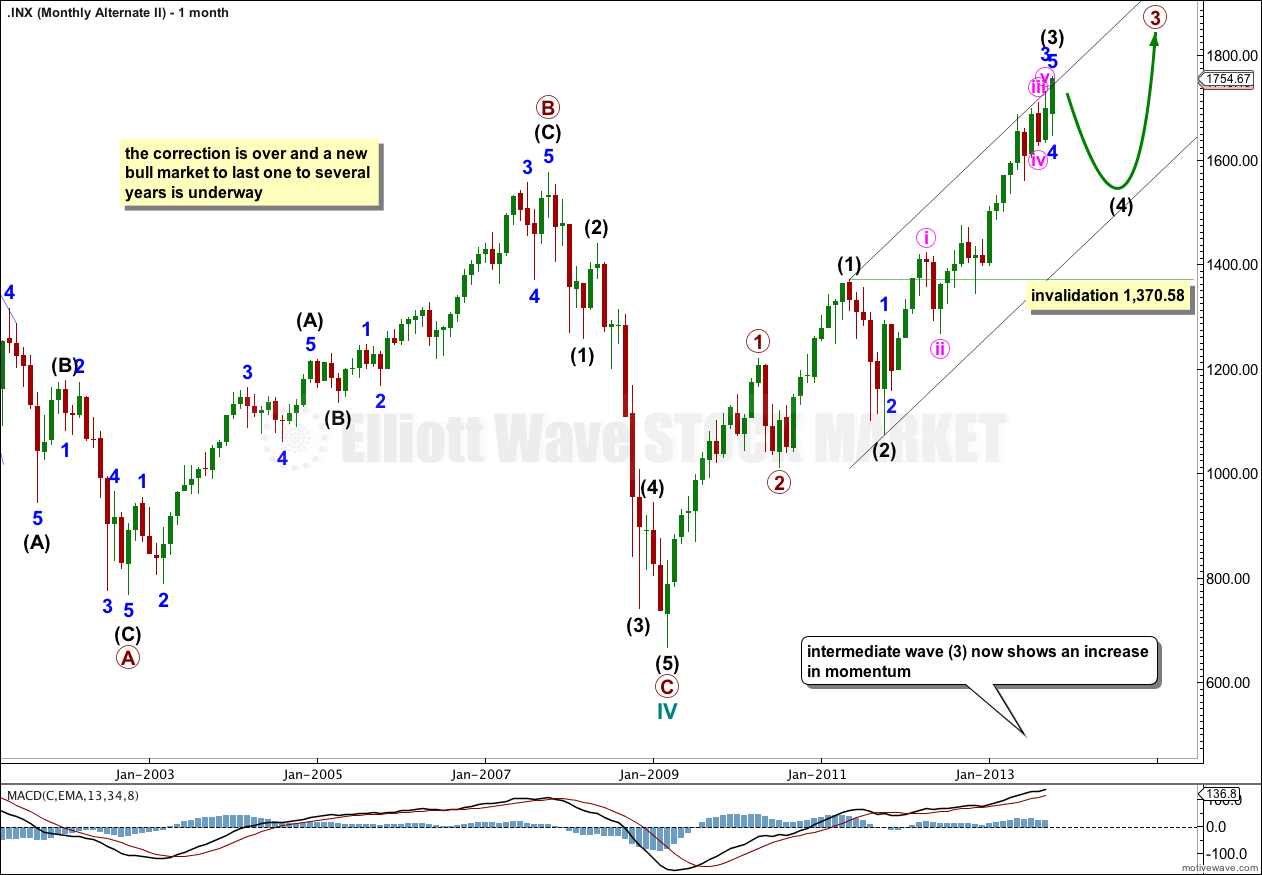
This alternate looks at the possibility that the S&P 500 is within a new bull market which should last one to several years in total. So far it has lasted over 4.5 years.
If the expanded flat correction labeled here cycle wave IV was the end of the correction then upwards movement since 666.79 may be an unfolding impulse, which would be incomplete.
At this stage this wave count would be looking for a fourth wave correction for intermediate wave (4) to begin very soon. This correction should last a few weeks. Intermediate wave (4) may not move into intermediate wave (1) price territory. This wave count is invalidated with movement below 1,370.58. This is the price point which differentiates the main monthly wave count with this alternate monthly wave count.

On this daily chart I have moved out to show the entire structure of intermediate wave (3). For the main wave count the subdivisions are the same and this is labeled primary wave C.
At 1,880 minor wave 5 would reach equality in length with minor wave 3.
The channel drawn here is a best fit. If it is very clearly breached by downwards movement then I would expect that intermediate wave (3) is over and intermediate wave (4) is underway.
Lara,
Does your inclusion of the alternate monthly count tonight suggest that you are starting to lean more toward this count?
At what point would you abandon the main monthly count?
Peter
No, it’s still an alternate with (in my judgement) a lower probability than the main wave count.
I included it today because I wanted to update the historic analysis and to do that I must cover alternates.
If we keep going up after October ends the alternate will increase in probability. If we have a monthly candlestick close outside the big maroon channel on the monthly chart I would switch to the alternate, at that stage it would be clearly a third wave up.